


1. Introduction
The relationship between interest rates and stock prices has long been a topic of debate among scholars, although the more general conclusion is that interest rates are negatively correlated with stock prices, but this can vary under specific conditions. Despite the abundance of these studies, few have addressed the short-term or even ultra-short-term impact of interest rates on stock prices. Since 17 March 2022, the Federal Reserve has claimed to have begun a path of successive interest rate hikes in response to excessive inflation. The Fed's interest rate hike behavior provides empirical material to study the relationship between interest rates and stock prices. Part 2 of the paper reviews the previous literature on the relationship between interest rate and stock price and describes the US interest rate hike situation. Part 3 and part 4 use two ARIMA models to go over the impact of the Fed's interest rate hike on Wal-Mart's stock (WMT) price. The paper concludes that interest rate changes slightly negatively impact Wal-Mart's stock price in the ultra-short-term, or 9-day horizon, but not in the short-term, 10-week horizon. The paper concludes with recommendations for the government as well as investors based on this finding.
2. Literature Review
2.1. Interest Rate and Stock Price
A widely accepted conclusion is that the stock price and the interest rate have a negative relationship. This conclusion has often been explained by the investors move the funds from the stock market to deposits or bond market. According to the dividend discount model, the stock price is the present value of the future dividend stream, so increase in the interest rate will lead to an increase in the discount rate, and therefore the price will fall.
However, the facts are more complex and a simple rise in interest rates is rare and often accompanied by simultaneous changes in other factors. Scholars have therefore explored the relationship between interest rates and stock prices in depth. They examine whether a negative relationship exists, in what circumstance and significance, and how this relationship co-move with other factors. Tarek Ibrahim et al., stated that both the inflation rate and the real interest rate influence the stock price where inflation rate negatively affected the stock price, and real interest rate positively affected it [1]. Mohamed A. researched that the long-term interest rate negatively influenced the stock prices, while different stocks have different sensitivities [2]. Muhammed et al., examined a negative relationship between interest rate and stock & gold prices in Pakistan [3]. Suhadak, S. and Suciany, Amenda also pointed out that interest rate has a negative significantly influence on stock prices [4]. Adilla et al., conversely pointed out that interest rate measured using interest rate sensitivity failed to affect the stock prices of manufacturing companies listed on Indonesia Stock Exchange [5]. Raphael I. and Hassan E. examined that the interest rate risk of stocks, and they found that the modified duration have a negatively influence on stock price but the convexity has a positive impact though the joint effect is negative [6].
Despite the depth of these studies, however, most of them have targeted at stock indexes and the relative long-term interest rate and long term effects. Few studies have focused on the impact of interest rate on individual stocks in the ultra-short and short-term. This paper will attempt to fill this gap by examining the impact of interest rate changes on the stock price of Wal-Mart, a top U.S. retail company [7], in both the ultra-short and short-term by using ARIMA models.
2.2. United States’ Short Term Interest Rate 2022-2023
According to the monetary policy report provided by the Federal Reserve in June 2022, the inflation rate was too high that well above the 2% objective, they raised federal funds rate in March 17 [8]. It was the start of increasing interest rates. By the end of August 2023, the federal funds rate had been raised 11 times in the past year, from 0.25% ~ 0.5% to 5.25% ~ 5.5% [9]. Federal funds rate is a short term rate that banks borrowed from each other, which could be a proxy of short-term interest rates. The fed funds rate is an important monetary policy tool, and the adjustment of the fed funds rate can affect the market to a considerable extent [10], so it is chosen as the subject of this paper.
3. Research Designs
3.1. Data Source
This paper retrieved data from the Investment, a platform that provides real-time quotes for stocks and relevant financial assets, to find out the daily and weekly closing price data from 2010.1.1 to 2023.8.9 as a data source for the empirical estimation. Data earlier than 2010 were not taken owing to the impact of the 2008 financial crisis. Besides, stock prices after 2022.3.16, which is the first time that the Federal Reserve increased the interest rate, are highlighted as a data basis, on which we generate a time series based for the analysis to study the impact of federal rate hike on Walmart stock price.
3.2. Weak Stationarity Tests
After accomplishing the construction of the model, where the paper takes logarithms on the stock’s prices, the paper performed an ADF test to examine its smoothness. For the daily data, the paper take a first-order difference; for weekly data, the paper takes 2nd order differences to obtain reasonable orders for ARMA model, which will be explained in part 4.1 in details. The original hypothesis is that the model is not smooth, as shown in Table 1. The p-values for the raw data are higher than 0.1, where it cannot reject the original hypothesis. After 1st order differences, the p-values become 0, which is less than 0.1, so the original hypothesis can be rejected.
Table 1: Weak stationarity test.
t | p | |
Daily | ||
Raw | -2.423 | 0.3673 |
1st order difference | -40.779 | 0 |
Weekly | ||
Raw | -2.260 | 0.4560 |
1st order difference | -17.846 | 0 |
2nd order difference | -29.903 | 0 |
3.3. ARIMA Model Specification
Equation(1) shows that the ARIMA(p,d,q) model combined the AR(p) model, which is represented by \( {∅_{0}}+\sum _{i=1}^{p}{∅_{i}}{x_{t-i}} \) ; with the MA(q) model that is \( {α_{i}}-\sum _{i=1}^{q}{∅_{i}}{α_{t-i}} \) . Apart from the AR(p) model and the MA(q) model, the ARIMA(p,d,q) model also requires taking differences in the raw data to ensure stationarity. The order of the differences is denoted by “i.” which is its difference between a simple ARMA(p,q) model. As a result, the model is enabled to use the historical returns and errors to forecast the future’s return. This paper set up three different ARIMA models for the daily and weekly.
\( {P_{t}}={∅_{0}}+\sum _{i=1}^{p}{∅_{i}}{x_{t-i}}+{α_{i}}-\sum _{i=1}^{q}{∅_{i}}{α_{t-i}} \) (1)
To be specific, the AR model in this paper uses the historical logarithms prices of WMT over the period from 2010.1.1 to the last trading date before the start of increasing the interest rate, which is different in terms of daily and weekly, to forecast the future. The MA model uses past volatility to estimate the future. As a result, the prices if no increase in interest rates could be estimated to be compared with the actual prices. The model takes differences for data, ensuring the model is based on stationary series.
4. Empirical Results and Discussion
4.1. Order of ARIMA model and Residual test
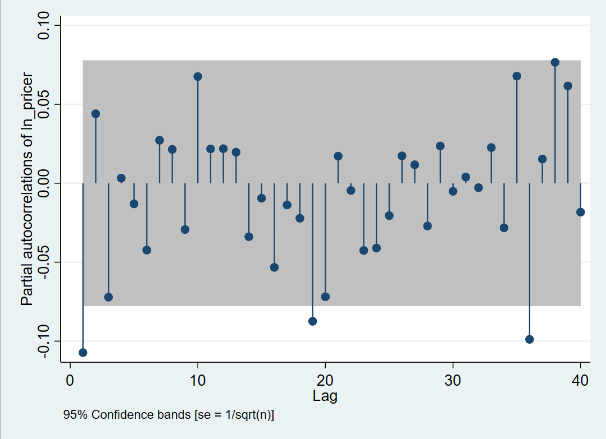
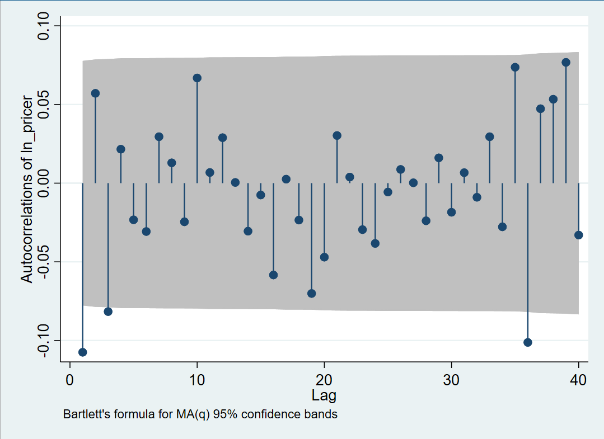
Using PACF and ACF, the lag orders of the logarithm’s prices for AR and MA models are determined.
PACF | ACF |
Daily | |
|
|
Weekly | |
|
|
Figure 1: ARMA (p, q) identification | |
Photo credit: Original | |
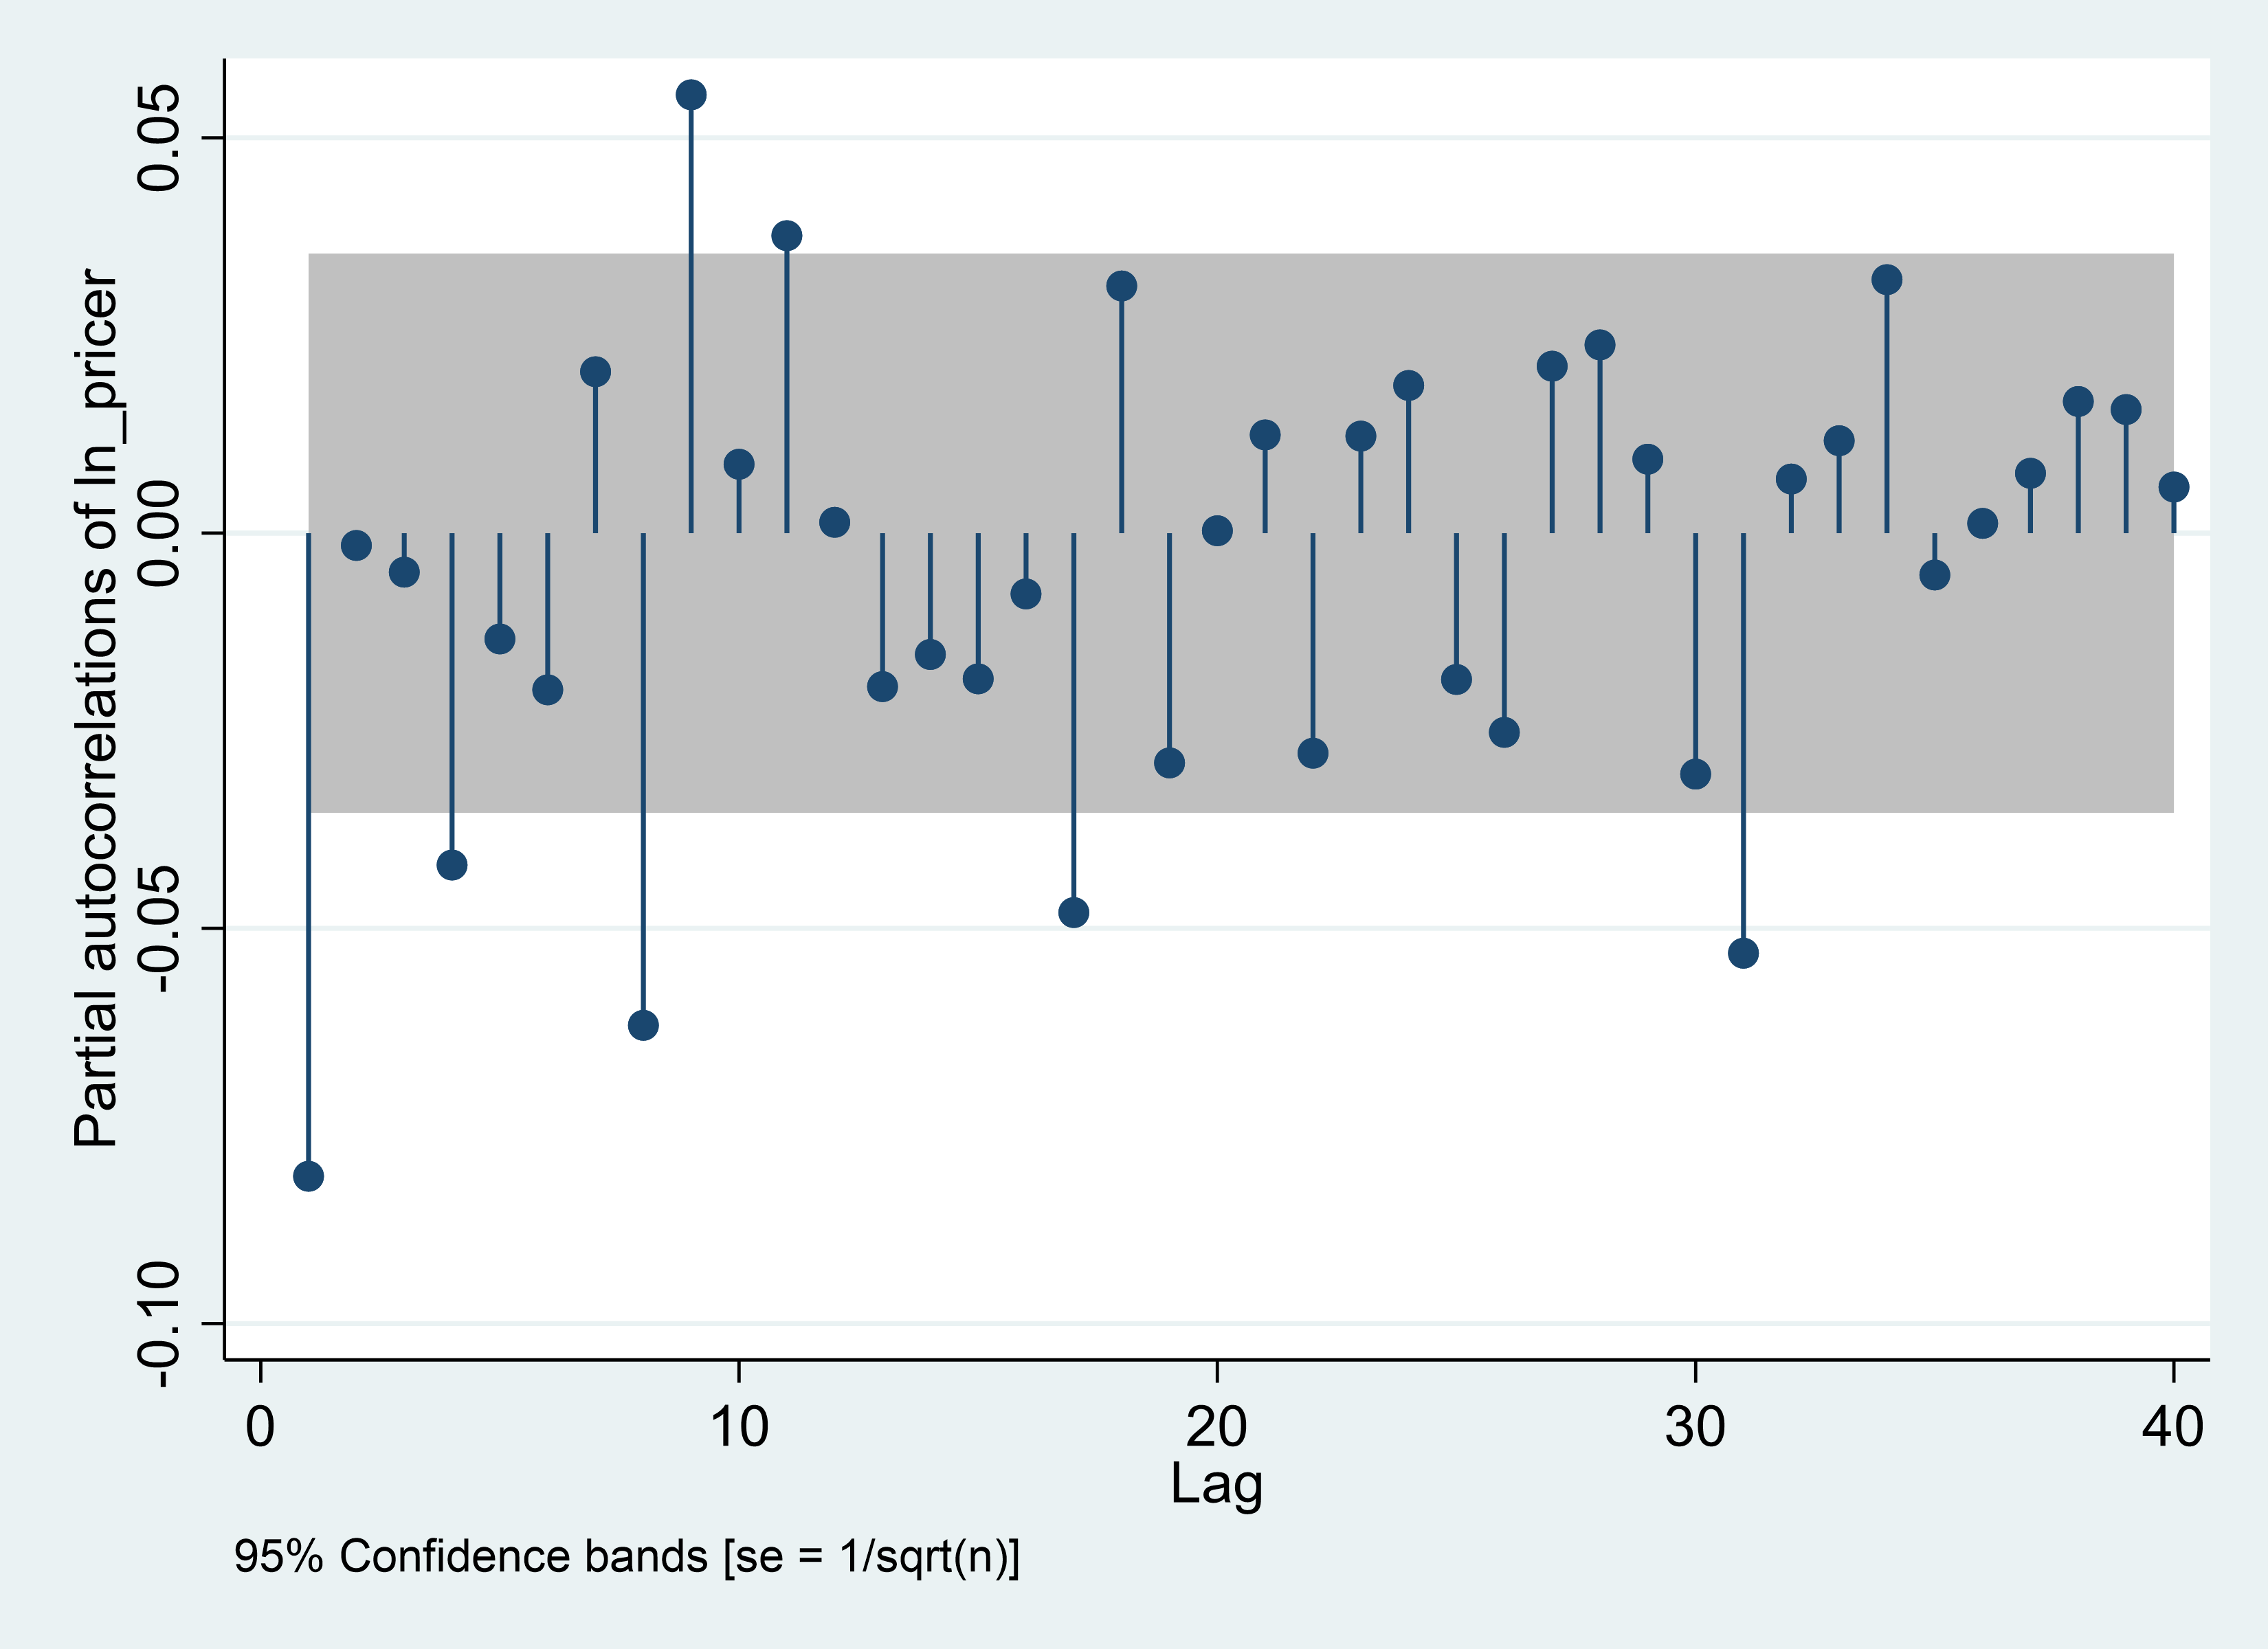
As the Figure 1 shown, an ARIMA (9,1,9) model can be adopted for the daily data and an ARIMA (10,2,2) model can be implemented for the weekly data.
Portmanteau tests are conducted to examine whether residuals are white noise.
Table 2: Residual test.
Model | Portmanteau (Q) statistic | Prob > chi2 |
Daily-ARIMA(9,1,9) | 32.0045 | 0.8121 |
Weekly-ARIMA(10,2,2) | 32.4187 | 0.7973 |
According to the Table 2, p-values are larger than 0.1, accepting the original hypothesis that the series are white noise. As a result, the models are sufficient.
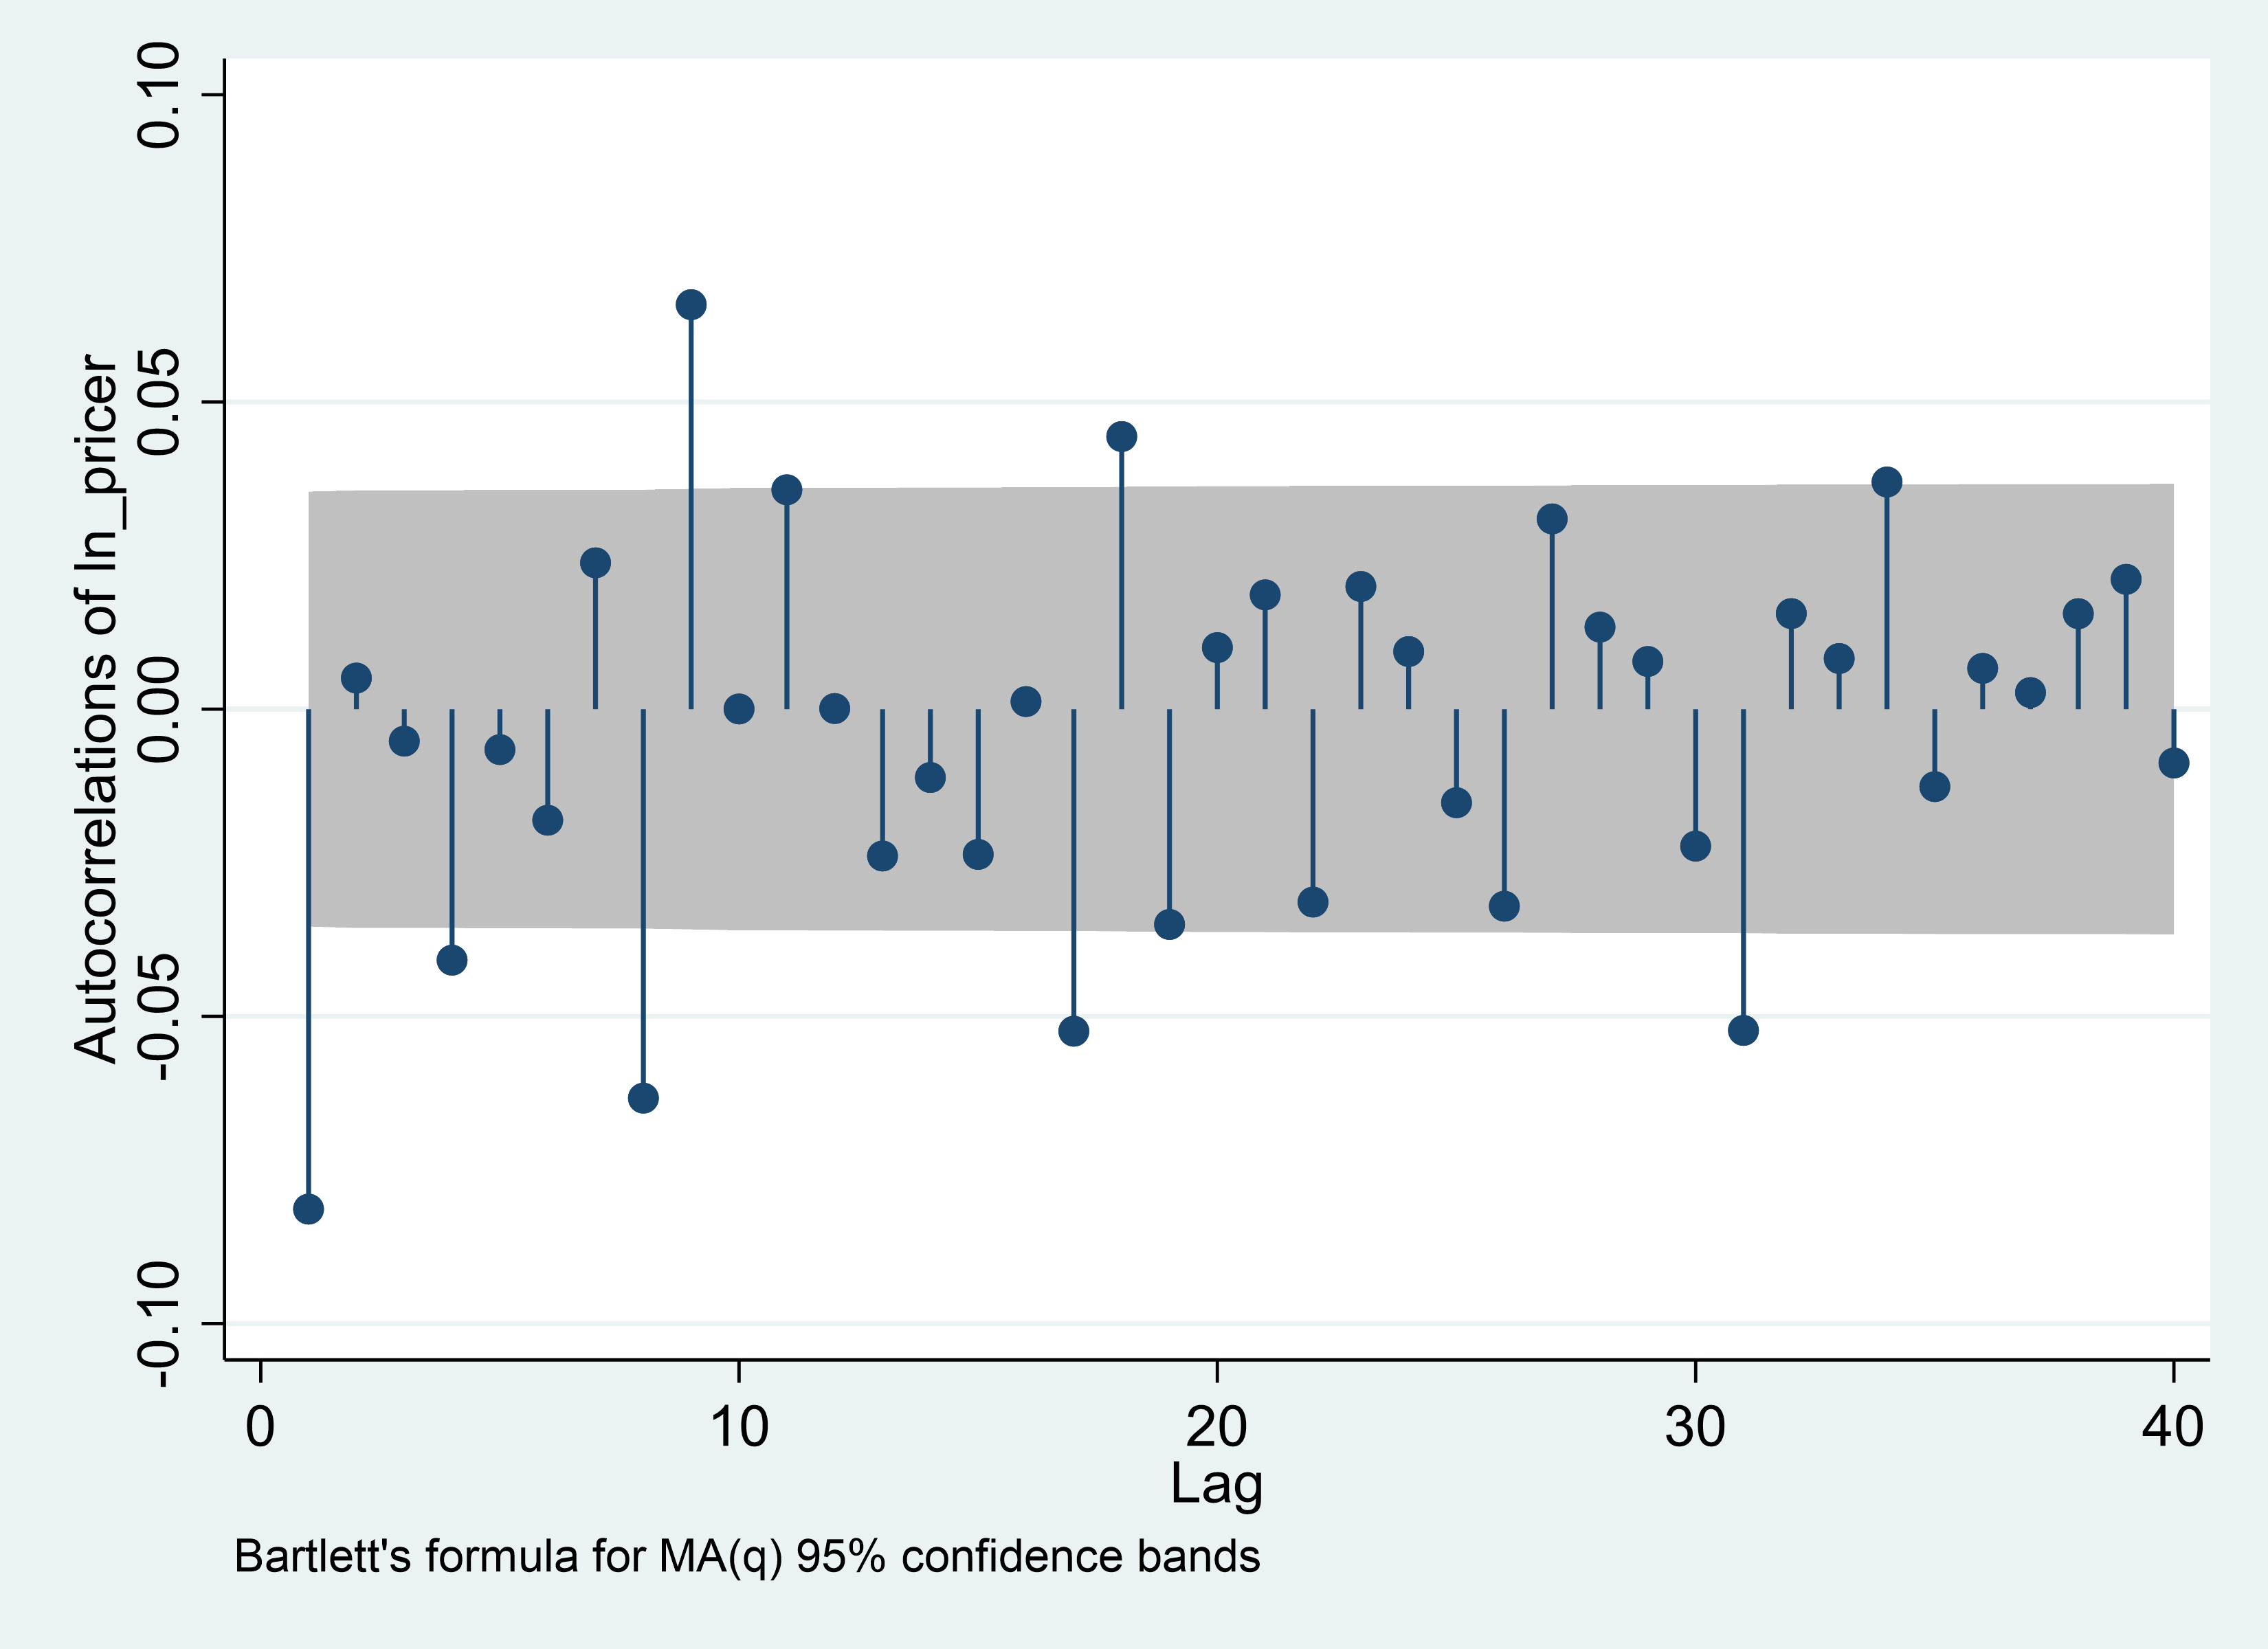
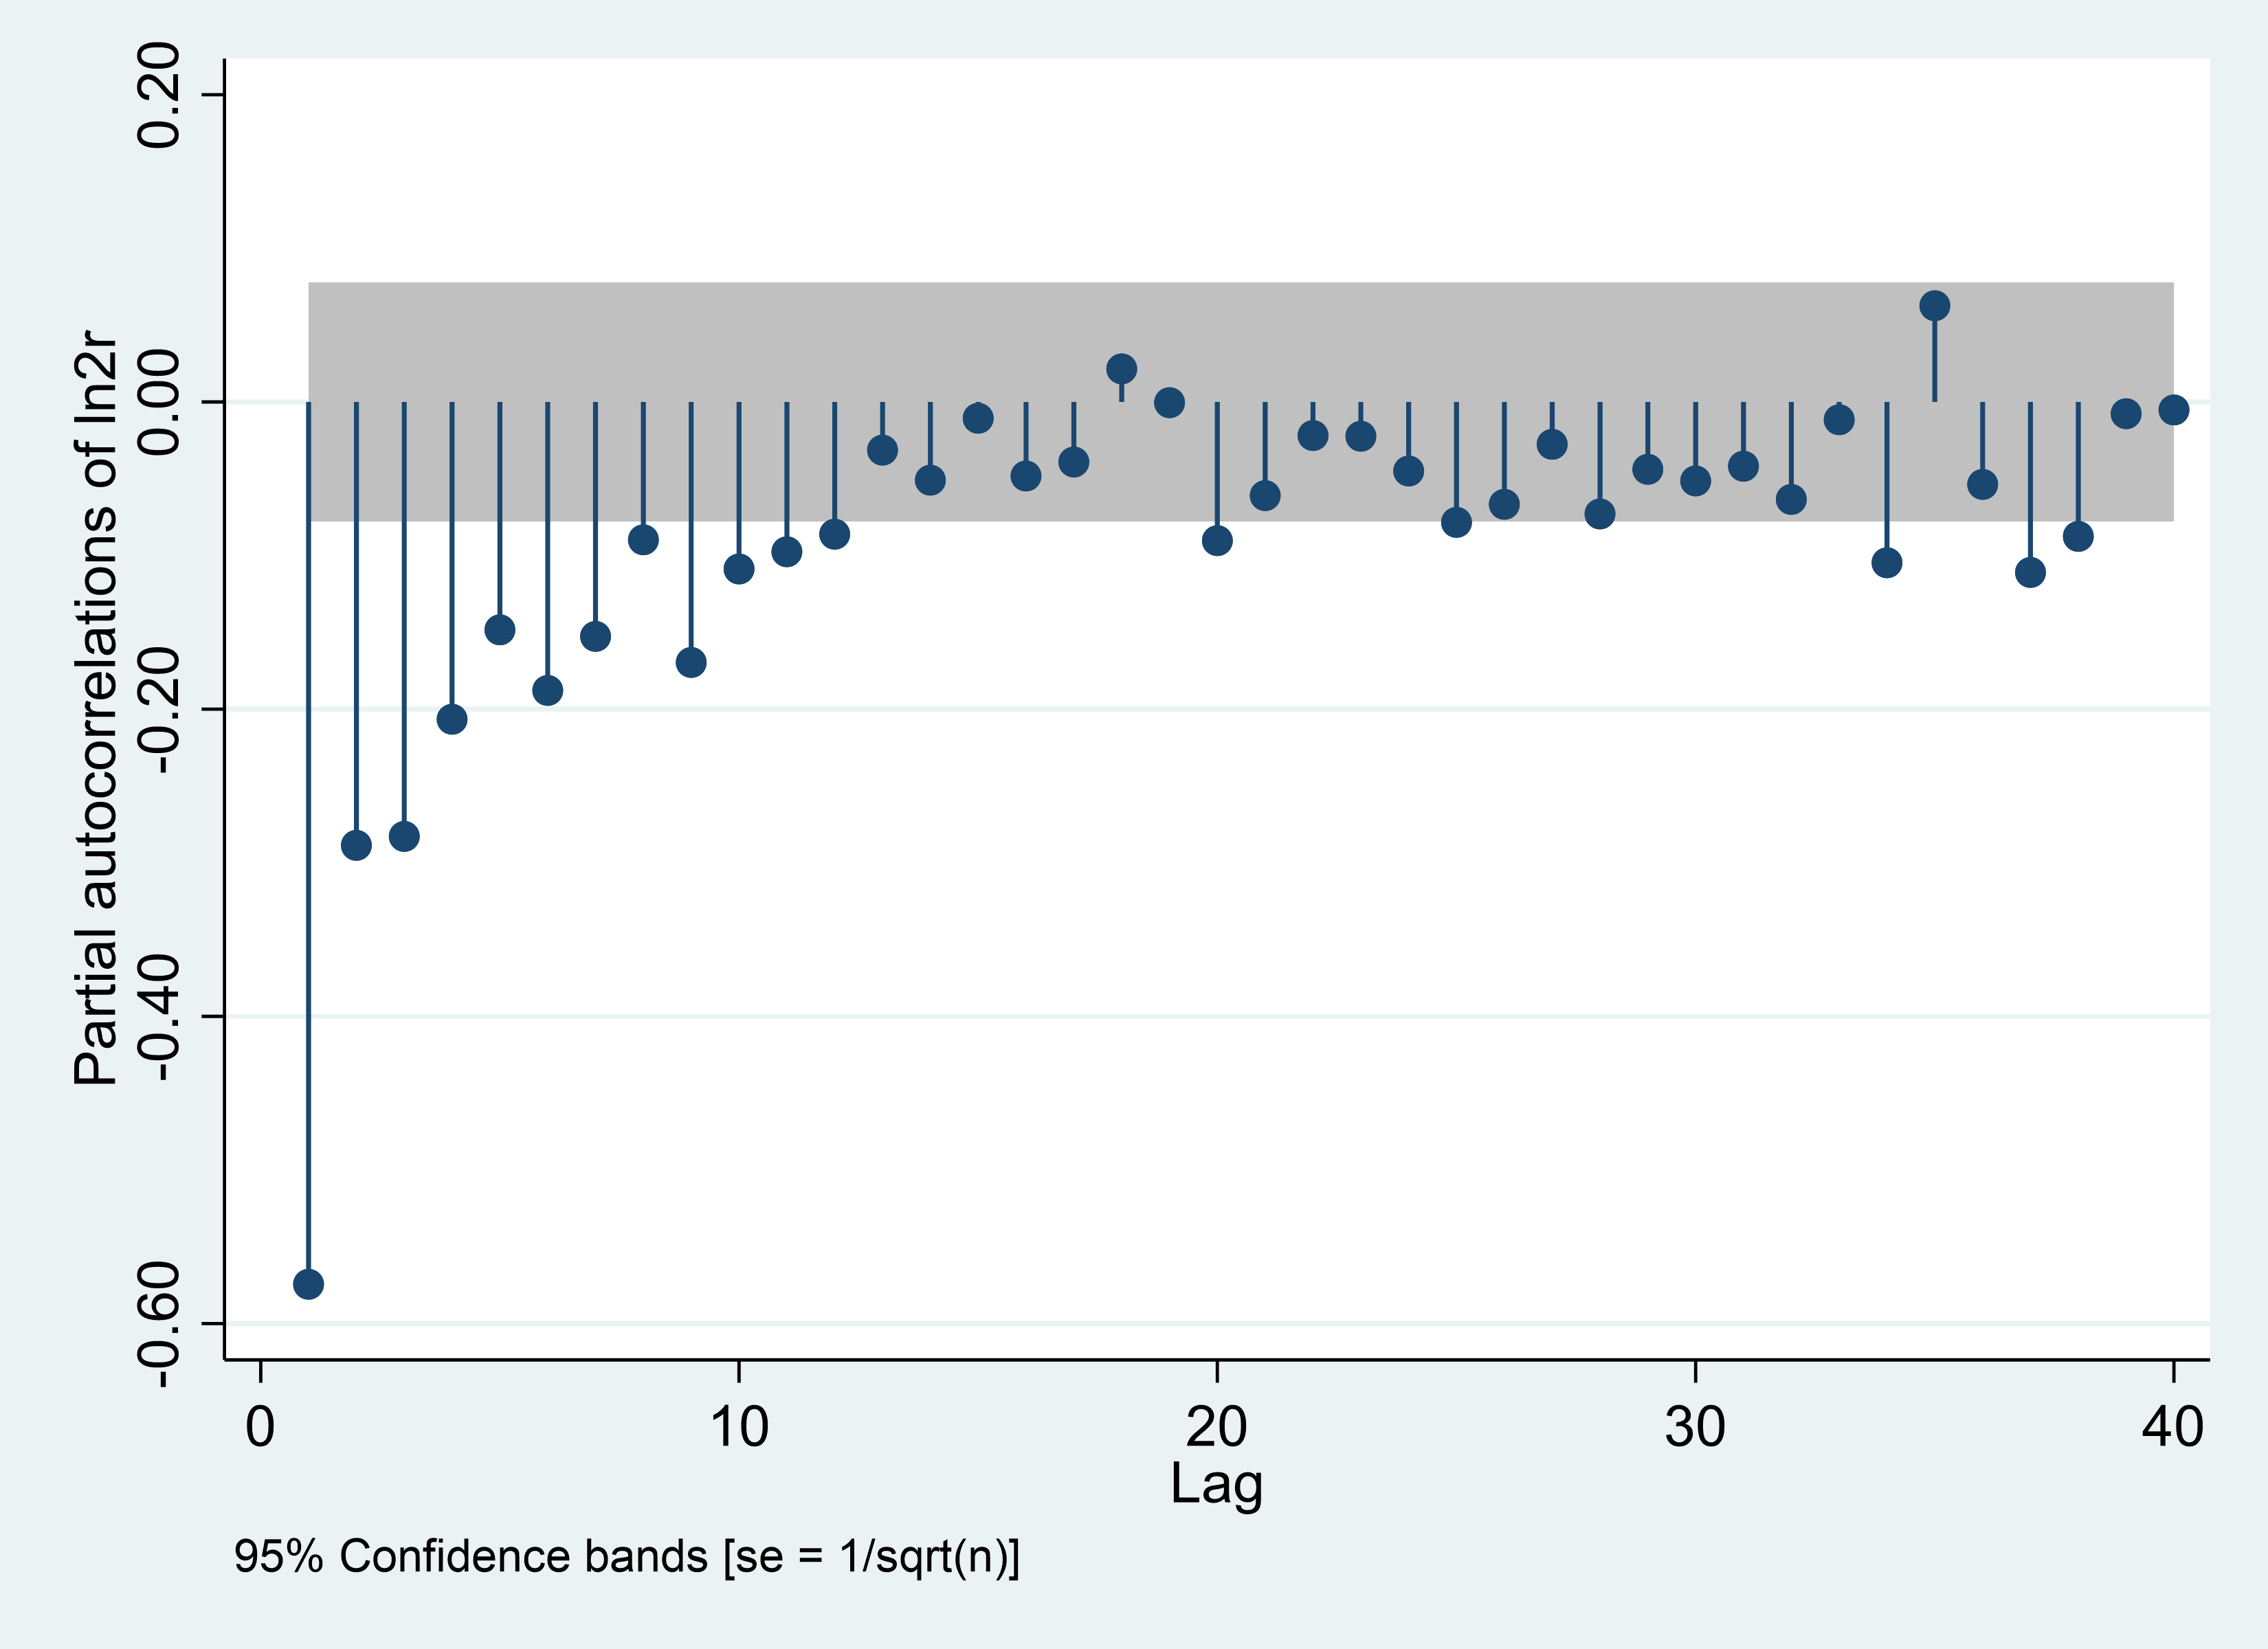
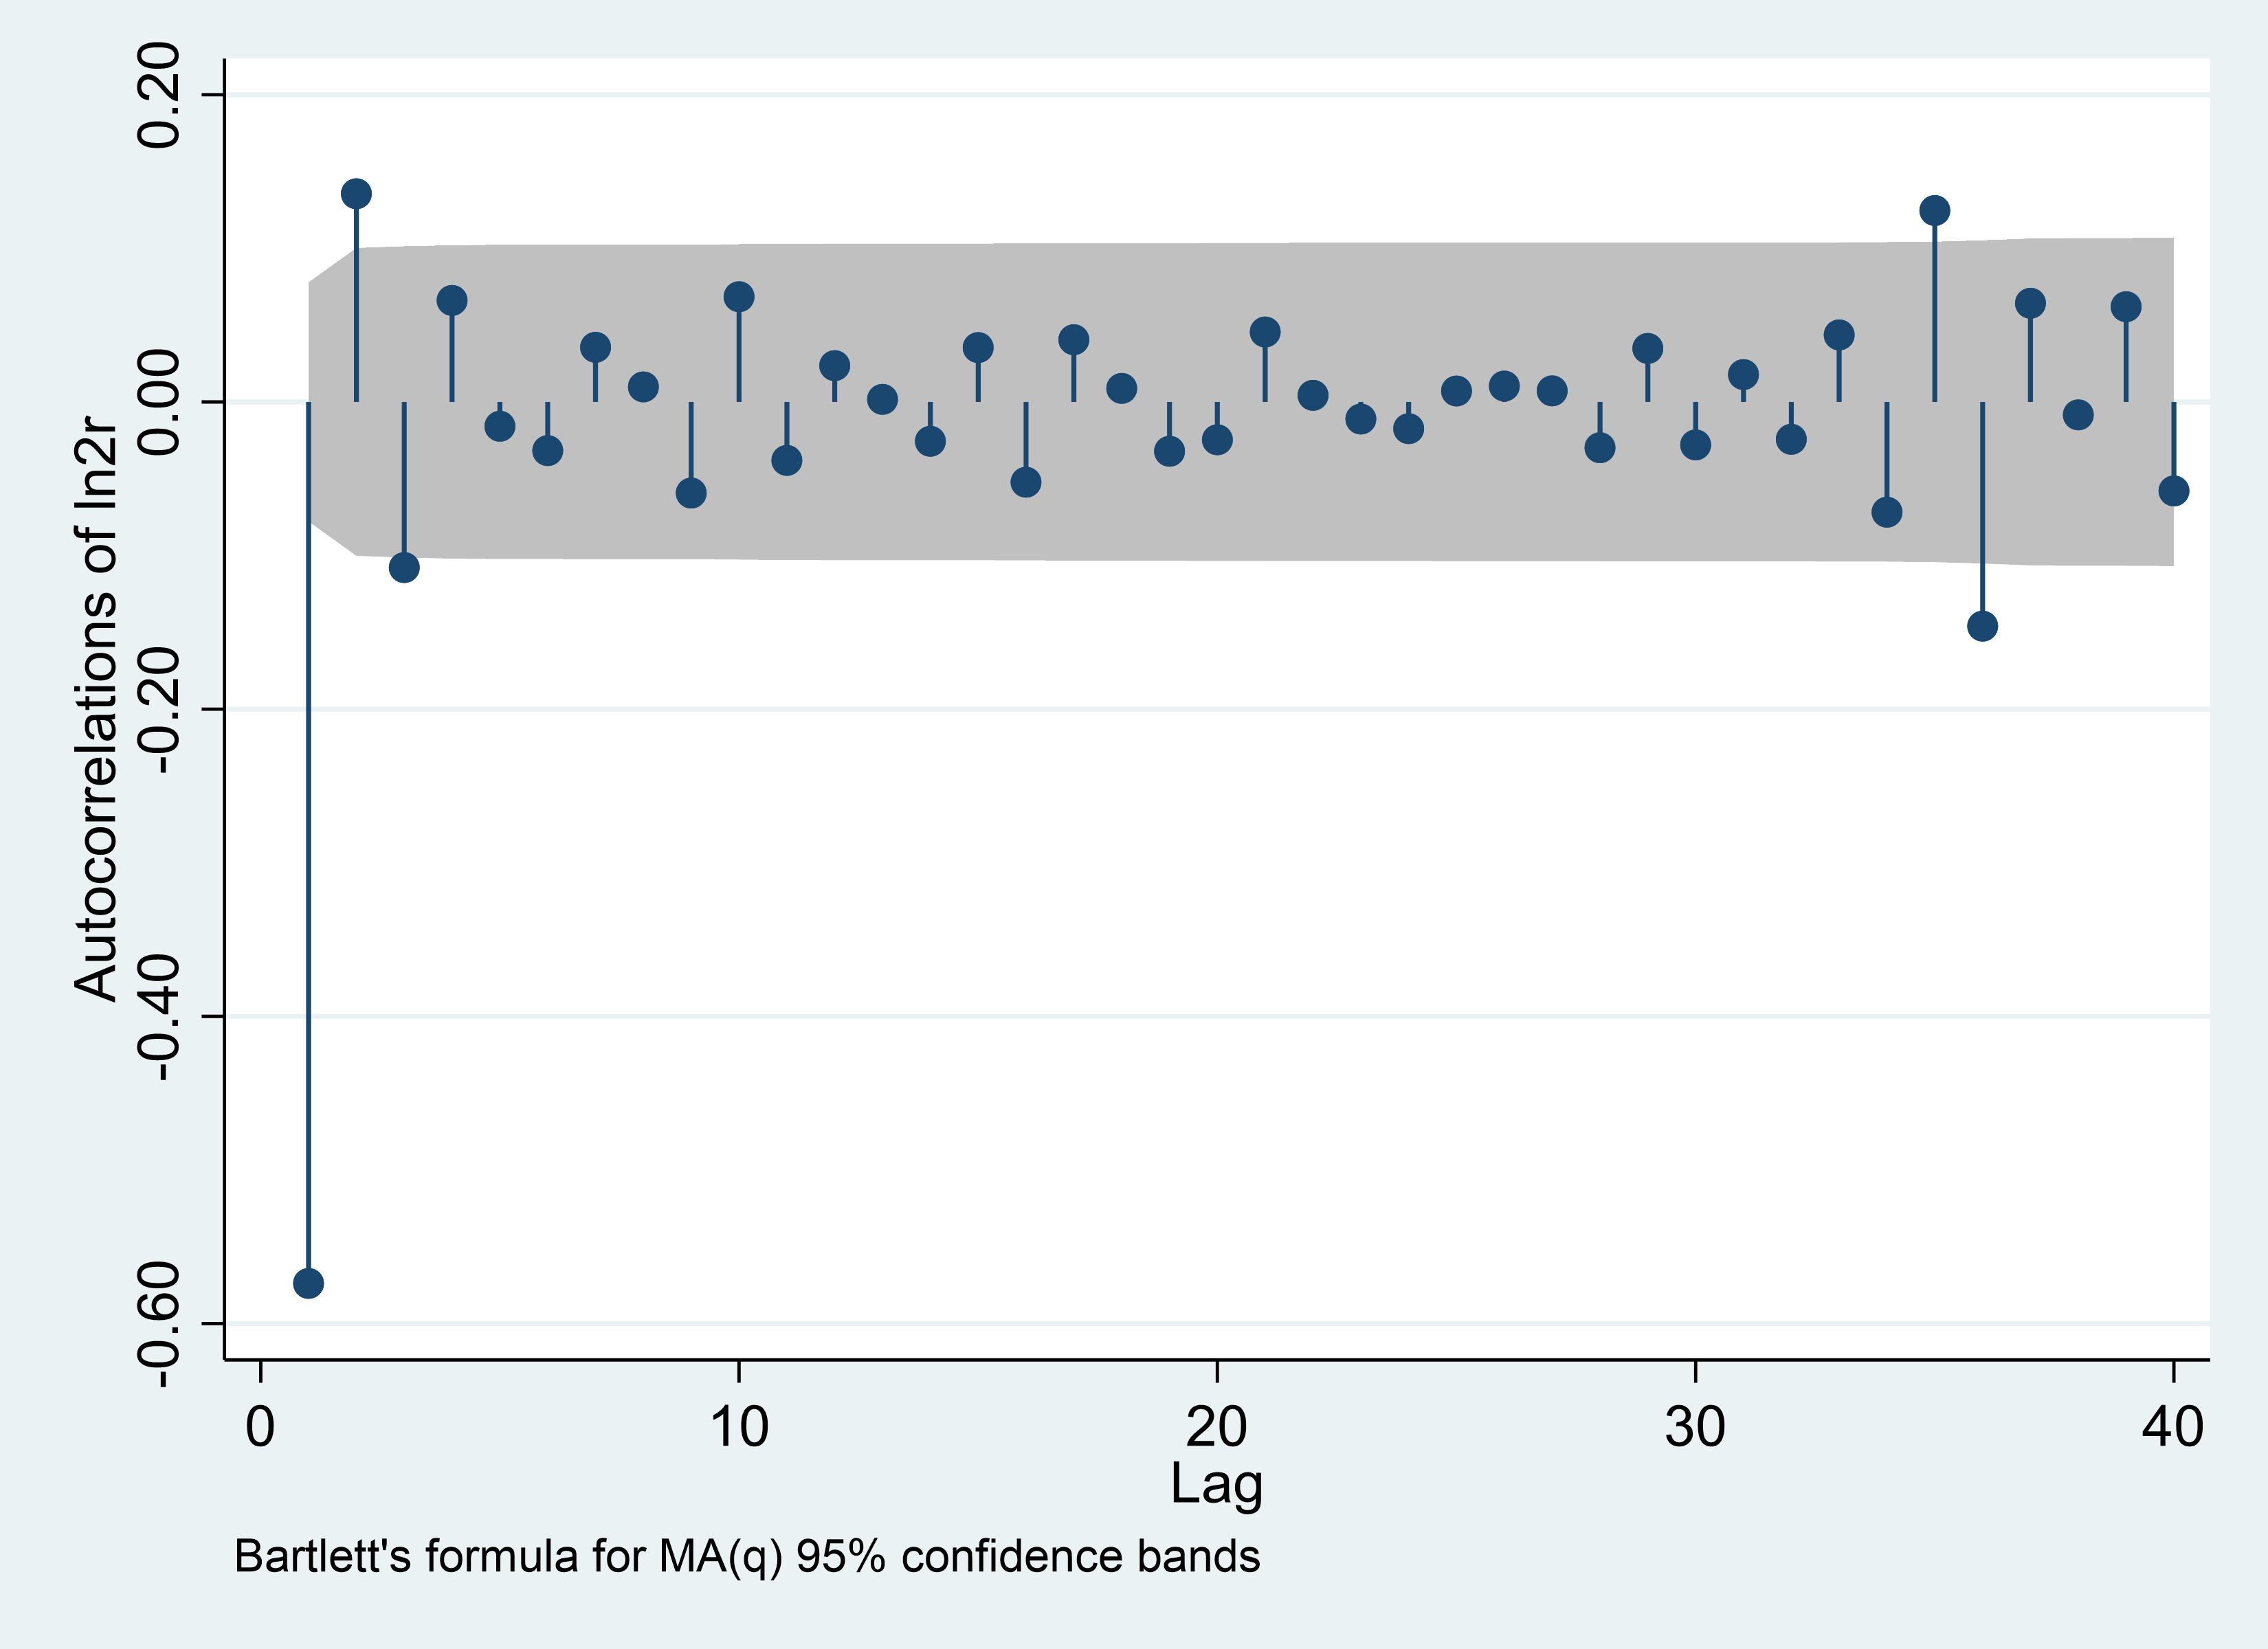
Note: The weekly data have been taken a second order difference. The reason for taking a second order difference will be shown:
Weekly | |
|
|
Figure 2: ARMA (p, q) identification-Weekly. | |
Photo credit: Original | |
The lag orders for weekly data with a first order difference are 1, which are too small for a reasonable predicting period, hence a second order difference should be taken.
4.2. ARIMA Estimation Results and Analysis
Figure 3 depict the predicted prices (Fitted value) by ARIMA models and the actual prices, which are influenced by increasing the interest rates in daily and weekly forms.
Figure 3: Actual value and fitted value, daily. |
Photo credit: Original |
Table 3 lists the Actual value, Fitted value and the difference in detail. Besides, the average value of aberrance, which is calculated by dividing the average difference by the average fitted value.
According to the figure 3 and table 3 (Panel A), the impact of the federal rate hike could analyzed. The ARIMA (9,1,9) model provides a 9-day ultrashort-term forecast for WMT prices. The data show that since the Federal Reserve's announcement of the rate hike on 17 March, the actual price was slightly lower than the model's prediction for each day until 28 March, and on average, the actual price was -0.9% lower than the fitted price. As a result, the model successfully captures a slightly negative impact on WMT prices in the ultrashort-term.
Table 3: Fitted and Actual Value in Detail.
Panel A: Daily-ARIMA (9,1,9) | |||||
Actual value | Fitted value | Difference | ATE | ||
2022-03-04 | 142.82 | ||||
2022-03-07 | 141.67 | ||||
2022-03-08 | 138.74 | ||||
2022-03-09 | 139.46 | ||||
2022-03-10 | 142.63 | ||||
2022-03-11 | 142.07 | ||||
2022-03-14 | 144.05 | ||||
2022-03-15 | 145.78 | ||||
2022-03-16 | 145.35 | ||||
2022-03-17 | 145.01 | 145.56932 | -0.56 | ||
2022-03-18 | 145.44 | 145.48896 | -0.05 | ||
2022-03-21 | 144.23 | 145.5111 | -1.28 | ||
2022-03-22 | 143.80 | 145.42733 | -1.63 | ||
2022-03-23 | 141.95 | 145.85703 | -3.91 | ||
2022-03-24 | 142.83 | 145.68232 | -2.85 | ||
2022-03-25 | 143.45 | 145.96235 | -2.51 | ||
2022-03-28 | 146.00 | 146.09302 | -0.09 | ||
2022-03-29 | 147.23 | 146.20606 | 1.02 | -0.90% | |
Panel B: Weekly-ARIMA (10,2,2) | |||||
Actual value | Fitted value | Difference | ATE | ||
2022-01-09 | 145.06 | ||||
2022-01-16 | 140.19 | ||||
2022-01-23 | 137.52 | ||||
2022-01-30 | 139.33 | ||||
2022-02-06 | 135.33 | ||||
2022-02-13 | 137.99 | ||||
2022-02-20 | 136.38 | ||||
2022-02-27 | 142.82 | ||||
2022-03-06 | 142.07 | ||||
2022-03-13 | 145.44 | 142.7876 | 2.65 | ||
2022-03-20 | 143.45 | 142.811 | 0.64 | ||
2022-03-27 | 151.01 | 142.7915 | 8.22 | ||
2022-04-03 | 157.41 | 142.6899 | 14.72 | ||
2022-04-10 | 157.08 | 142.8457 | 14.23 | ||
2022-04-17 | 156.86 | 143.02 | 13.84 | ||
2022-04-24 | 152.99 | 143.5185 | 9.47 | ||
2022-05-01 | 149.56 | 143.5623 | 6.00 | ||
2022-05-08 | 148.05 | 144.3483 | 3.70 | ||
2022-05-15 | 119.20 | 144.6575 | -25.46 | 3.35% | |
However, no negative effect of the federal rate hike could be captured in a short term represented by a 10-week estimation provided by the ARIMA (10,2,2) model. First of all, it is necessary to clarify that the weekly closing price is the daily closing price of next Friday; for instance, the weekly closing price of 2022-03-06 is the daily closing price of 2022-03-11. Between late March and the end of March, actual prices were slightly higher than predicted; however, throughout April and early May, actual prices were much higher than predicted, and on 7 May, when the Federal Reserve raised interest rates for the second time, actual prices fell back to relatively near fitted prices over the same period. By mid-May, actual prices had fallen sharply to well below expected prices. Overall, the average actual price was 3.35% higher than the expected price.
Figure 4: Actual value and fitted value, weekly. |
Photo credit: Original |
The actual price was well above the expected price throughout April, which deviates from the assumption that the federal rate hike tends to decline the stock price. It may have received a boost from other shocks that have not been eliminated by the model, such as the $0.56 dividend paid by Wal-Mart on 4 April, a value that was higher than the previous value of $0.55. The slight price pullback in the week of 2022-05-01 & 2022-05-08 is consistent with the analysis described that interest rate hikes have a slight negative impact on prices in the ultra-short term, and thus, the sharp price decline in mid-May cannot be attributed to the effect of the interest rate hike. To provide an alternative explanation, Walmart released its quarterly report for the first quarter of FY 2023(actual year 2022) on 17 May [11], which showed a 24.8% decline in net income in the first quarter compared to FY 2022 and the sharp decline in prices was concentrated in the period from 16 May to 19 May, so the price decline in mid-May may have been received as a result of this factor.
5. Discussion & Limitations
Based on the analyses, this paper concludes that raising interest rates has a slight negative impact on WMT prices in the ultra-short term, but not in the short term. In contrast to the previous conclusions listed in the literature review, this paper is characterized by pinpointing the direction of the study to a single stock in the short run and provides a different conclusion from the majority of those that argue that there is a significant negative correlation between interest rates and share prices. The limitation of this paper is that the ARIMA model is unable to include the effects of other factors on stock prices, specifically the relatively significant increase in WMT price above the projected price in April 2022 and the burst in stock price after May 17, 2022, both of which are dominated by shocks that cannot be eliminated by the model, thus making the model imperfectly responsive to the effects of changes in interest rates on the stock price This is an inherent drawback of the ARIMA model, although it remains a relatively simple and effective model for predicting short-end returns. This paper investigates the short-run returns of interest rate hikes by means of a simple model, which provides a new direction for future research, and in particular can assist firms in their stock selection strategies. For investors, this paper provides the advice that when the Fed carries out an interest rate hike, it is profitable to go short in the ultra-short term within a week, but for investors with an investment period longer than 9 days, it is better to wait and see first, as other factors are more likely to dominate the change in stock prices than interest rates.
6. Conclusion
The purpose of this paper is to construct a model for price prediction by using the historical stock prices before the interest rate hike and measure the impact of the interest rate change on the price of WMT by comparing with the actual price. In this paper, the unit root test is firstly conducted by ADF tests, and the first order difference of daily data, and the first and second order differences of weekly data are passed. The PACF test is used to order the AR model and the ACF test is used to order the MA model, and then the ARIMA (9,1,9) model is constructed for daily data and the (10,2,2) model is constructed for weekly data. The residual test was performed after constructing the models, and the residuals of both models were white noise. Finally, the models were used to make stock price predictions and compared with the actual prices. The study concludes that interest rate hike has a negative impact on WMT prices in the ultra-short term and no significant impact in the short-term horizon. The findings of this paper can provide a direction for future related research and provide reference suggestions for investors to make trading decisions.
References
[1]. Eldomiaty, T. I., Saeed, Y., Hammam, R., & AboulSoud, S. (2020). The associations between stock prices, inflation rates, interest rates are still persistent: Empirical evidence from stock duration model. Journal of Economics, Finance and Administrative Science, 25(49),
[2]. Elsendiony, M. A. (2000). An empirical study of stock price sensitivity to interest rate. Thesis (Ph.D.)--Fordham University, 2000.
[3]. Akbar, M., Iqbal, F., & Noor, F. (2019). Bayesian analysis of dynamic linkages among gold price, stock prices, exchange rate and interest rate in Pakistan. Resources Policy, 62, 154–164.
[4]. Suhadak, S., & Suciany, A. (2020). Brief Technical Note: The Influence of Exchange Rates on Inflation, Interest Rates and the Composite Stock Price Index: Indonesia 2015 - 2018. Australasian Accounting, Business & Finance Journal, 14(1), 105–120.
[5]. Nur’ Adilla, Ubud Salim, & Djumahir Djumahir. (2022). Effect of Exchange Rates, Interest rates, Profitability, and Solvency on Stock Prices Mediated by Dividend Policy. Jurnal Aplikasi Manajemen, 20(2).
[6]. Udegbunam, R. I., & Oaikhenan, H. E. (2012). Interest Rate Risk of Stock Prices in Nigeria: Empirical Test of the Duration and Convexity Model. Journal of Emerging Market Finance, 11(1), 93–113.
[7]. Jia, P. (2008). What Happens When Wal-Mart Comes to Town: An Empirical Analysis of the Discount Retailing Industry. Econometrica, 76(6), 1263–1316.
[8]. Monetary policy report. (2022). Board of Governors of the Federal Reserve System. https://www.federalreserve.gov/monetarypolicy/files/20220617_mprfullreport.pdf
[9]. Tepper. (2023). Federal Funds Rate History 1990 to 2023. Forbes. https://www.forbes.com/advisor/investing/fed-funds-rate-history/
[10]. Yin, H., Yang, J., Park, Y. S., & Handorf, W. (2007). The effect of changes in Federal funds rate target on bank stock returns in the U.S.A. Thesis (Ph.D.)--The George Washington University, 2007.
[11]. Walmart. (2022). Walmart Releases Q1 FY23 Earnings. https://corporate.walmart.com/press-center/walmart-releases-q1-fy23-earnings
Cite this article
Liu,Y. (2024). The Impact of the Federal Funds Rate Hike on Walmart Stock Price: A Short-term and Dynamic Perspective. Advances in Economics, Management and Political Sciences,59,162-169.
Data availability
The datasets used and/or analyzed during the current study will be available from the authors upon reasonable request.
Disclaimer/Publisher's Note
The statements, opinions and data contained in all publications are solely those of the individual author(s) and contributor(s) and not of EWA Publishing and/or the editor(s). EWA Publishing and/or the editor(s) disclaim responsibility for any injury to people or property resulting from any ideas, methods, instructions or products referred to in the content.
About volume
Volume title: Proceedings of the 2nd International Conference on Financial Technology and Business Analysis
© 2024 by the author(s). Licensee EWA Publishing, Oxford, UK. This article is an open access article distributed under the terms and
conditions of the Creative Commons Attribution (CC BY) license. Authors who
publish this series agree to the following terms:
1. Authors retain copyright and grant the series right of first publication with the work simultaneously licensed under a Creative Commons
Attribution License that allows others to share the work with an acknowledgment of the work's authorship and initial publication in this
series.
2. Authors are able to enter into separate, additional contractual arrangements for the non-exclusive distribution of the series's published
version of the work (e.g., post it to an institutional repository or publish it in a book), with an acknowledgment of its initial
publication in this series.
3. Authors are permitted and encouraged to post their work online (e.g., in institutional repositories or on their website) prior to and
during the submission process, as it can lead to productive exchanges, as well as earlier and greater citation of published work (See
Open access policy for details).
References
[1]. Eldomiaty, T. I., Saeed, Y., Hammam, R., & AboulSoud, S. (2020). The associations between stock prices, inflation rates, interest rates are still persistent: Empirical evidence from stock duration model. Journal of Economics, Finance and Administrative Science, 25(49),
[2]. Elsendiony, M. A. (2000). An empirical study of stock price sensitivity to interest rate. Thesis (Ph.D.)--Fordham University, 2000.
[3]. Akbar, M., Iqbal, F., & Noor, F. (2019). Bayesian analysis of dynamic linkages among gold price, stock prices, exchange rate and interest rate in Pakistan. Resources Policy, 62, 154–164.
[4]. Suhadak, S., & Suciany, A. (2020). Brief Technical Note: The Influence of Exchange Rates on Inflation, Interest Rates and the Composite Stock Price Index: Indonesia 2015 - 2018. Australasian Accounting, Business & Finance Journal, 14(1), 105–120.
[5]. Nur’ Adilla, Ubud Salim, & Djumahir Djumahir. (2022). Effect of Exchange Rates, Interest rates, Profitability, and Solvency on Stock Prices Mediated by Dividend Policy. Jurnal Aplikasi Manajemen, 20(2).
[6]. Udegbunam, R. I., & Oaikhenan, H. E. (2012). Interest Rate Risk of Stock Prices in Nigeria: Empirical Test of the Duration and Convexity Model. Journal of Emerging Market Finance, 11(1), 93–113.
[7]. Jia, P. (2008). What Happens When Wal-Mart Comes to Town: An Empirical Analysis of the Discount Retailing Industry. Econometrica, 76(6), 1263–1316.
[8]. Monetary policy report. (2022). Board of Governors of the Federal Reserve System. https://www.federalreserve.gov/monetarypolicy/files/20220617_mprfullreport.pdf
[9]. Tepper. (2023). Federal Funds Rate History 1990 to 2023. Forbes. https://www.forbes.com/advisor/investing/fed-funds-rate-history/
[10]. Yin, H., Yang, J., Park, Y. S., & Handorf, W. (2007). The effect of changes in Federal funds rate target on bank stock returns in the U.S.A. Thesis (Ph.D.)--The George Washington University, 2007.
[11]. Walmart. (2022). Walmart Releases Q1 FY23 Earnings. https://corporate.walmart.com/press-center/walmart-releases-q1-fy23-earnings