


1. Introduction
Over the recent decades, an increasing emphasis has been placed on income inequality as a pivotal aspect of both societal and economic advancement. On a worldwide scale, income disparity has garnered recognition as a notable gauge of societal inequity and unpredictability. The measurement of income inequality frequently employs the Gini coefficient, a scale spanning from 0 to 1 where elevated value signify heightened inequality. Hence, it is imperative to grasp the determinants that impact the Gini coefficient, as this comprehension is essential for shaping just economic strategies and fostering parity and steadiness within society.
Academics have extensively delved into the investigation of elements that shape the Gini coefficient. Certain inquiries have centered around the effects of macroeconomic indicators on the Gini coefficient, encompassing aspects like economic advancement [1], distribution of wealth [2], and policy formulation [3]. Conversely, additional research has scrutinized micro-level determinants, for instance, education [4], health statuses [5], and the impacts of family arrangements [4] on the Gini coefficient. Despite the multitude of studies dissecting the factors that mold the Gini coefficient, gaining a more profound comprehension of its fluctuations within an economy akin to that of the United States necessitates a more comprehensive inquiry.
Studies have revealed that the Gini coefficient is influenced by a pair of crucial elements: economic advancement and governmental regulations. Take, for example, the renowned hypothesis known as the "Kuznets curve," put forth by Kuznets in 1955 [6]. According to this proposition, as a nation's economy flourishes, the degree of inequality initially rises before subsiding. This concept illustrates a multifaceted, nonlinear connection between economic growth and income disparity. Furthermore, the distribution of income is profoundly shaped by government policies. Through tools such as taxation and benefit disbursements, administrations can fine-tune the income allocation outcomes stemming from the market, consequently exerting an impact on the Gini coefficient [5].
Apart from considering economic expansion and governmental strategies, contemporary investigations have directed their attention towards alternative variables that might affect the Gini coefficient. To illustrate, the work of Bourguignon and Morrison in 2002 unveiled that both globalization and technological advancement wield substantial influence over income inequality [3]. Furthermore, certain inquiries have delved into the impact of social and cultural components on the Gini coefficient. A prime example is the findings of Alesina and Rodrik back in 1994, when they unearthed a noteworthy correlation between the diversity in societal racial and religious aspects and alterations in the Gini coefficient [3].
Academic research extensively investigates the factors shaping the Gini coefficient, encompassing macroeconomic indicators like economic development, wealth distribution, and policies, as well as micro-level determinants such as education, health, and family arrangements [7]. Despite numerous studies, comprehending Gini fluctuations in economies like the US necessitates further investigation. Research underscores two primary influences on the Gini coefficient: economic development and government policies [8]. Economic growth can initially escalate and then mitigate inequality—a concept depicted by the "Kuznets curve." Governments wield influence through taxation and benefits [9]. Beyond economic and policy realms, contemporary studies also examine additional factors. Globalization, technology, and social/cultural diversity significantly impact income inequality and the Gini coefficient.
This study aims to delve into the Gini coefficient's dynamics, utilizing publicly accessible data spanning four decades in the United States. Beyond economic expansion and governmental measures, this research will probe novel factors like urban development, global trade, and their impacts on the Gini coefficient. Employing regression analysis, a comprehensive endeavor will be undertaken to attain a profound comprehension of the determinants influencing the Gini coefficient within the context of the United States.
2. Research Design
2.1. Data Source
The information utilized in this research is derived from openly accessible records that cover an extensive 40-year period within the borders of the United States. These compilations of data are acquired from the official online portal of the United Nations, covering a wide array of economic, societal, and regulatory parameters. Each state in the United States contributes yearly data to this collection, furnishing our study with a wealth of substantial information. It is of significance to highlight that the Gini coefficient statistics employed in this investigation are garnered via household surveys, thereby offering insights into individual and familial income circumstances.
2.2. Descriptive Statistics
Utilizing the chosen dataset, the initial step involved the creation of a time series chart that visualizes the evolving trends of the Gini coefficient within the United States throughout the last four decades. The graphical representation distinctly reveals a steady upward trajectory of the Gini coefficient. This serves as an indicator that the augmentation of income inequality in the United States has been steadily amplifying over the recent few decades.
Figure 1: Gini index in US (Photo credit: Original)
Later on, our focus shifted towards investigating the ways in which certain pivotal factors are dispersed. To begin with, our attention was directed towards the trajectories of GDP. It is clear that GDP follows a general upward path (see Figure 1). Nevertheless, in contrast to the consistent rise observed in the Gini coefficient, fluctuations are apparent in GDP growth throughout various time spans. Moreover, an exploration was conducted into the dispersion patterns of alternate variables, including levels of urbanization, standards of living, and global trade. These variables showcase diverse trends over distinct temporal intervals.
2.3. Model Specification
This paper will employ a multiple linear regression model to investigate the factors influencing the Gini coefficient. The model is specified as follows:
\( {Gini_{t}}={β_{0}}+{β_{1}}{GDP_{t}}+{β_{2}}{GDP_{{sq_{t}}}}+{β_{3}}{NetMigration_{t}}+{β_{4}}{UrbanPopulation_{t}}+{β_{5}}{RuralPopulation_{t}}+{β_{6}}{LifeExpectancy_{t}}+{β_{7}}{Trade_{t}}+{β_{8}}{TaxRevenue_{t}}+{β_{9}}{CPI_{t}}+{β_{10}}{DependencyRatio_{t}}+{β_{11}}{Patent_{t}}+{ϵ_{t}} \) | (1) |
Where:
\( {Gini_{t}} \) represents the Gini coefficient in year
\( {GDP_{t}} \) and \( {GDP_{{sq_{t}}}} \) denote the GDP and the squared GDP in year t respectively.
\( {NetMigration_{t}} \) stands for the net migration in year t.
\( {UrbanPopulation_{t}} \) and \( {RuralPopulation_{t}} \) represent the urban and rural populations in year
t respectively.
\( {LifeExpectancy_{t}} \) corresponds to the life expectancy in year t.
\( {Trade_{t}} \) is the proportion of international trade to GDP in year t.
\( {TaxRevenue_{t}} \) is the proportion of tax revenue to GDP in year t.
\( {CPI_{t}} \) represents the Consumer Price Index in year t.
\( {DependencyRatio_{t}} \) denotes the dependency ratio in year t.
\( {Patent_{t}} \) stands for the number of patent applications in year t.
\( {ϵ_{t}} \) is the random error term.
The objective of the model is to grasp the connections existing between the Gini coefficient and a multitude of economic, societal, and policy-related factors. By attributing coefficients to each respective variable, this paper can gain a deeper understanding of the ways in which these elements contribute to fluctuations in income inequality as time progresses. The introduction of the error term serves to recognize the existence of latent elements that could potentially impact the Gini coefficient, although they have not been expressly incorporated into the model's framework. Through the utilization of the multiple linear regression methodology, this paper are empowered to gauge the effect of each individual variable, all the while maintaining control over the potential influence stemming from other variables.
3. Empirical Results and Analysis
In this research, a multiple linear regression approach was employed to delve into the determinants impacting the Gini coefficient within the confines of the United States. This inquiry made use of publicly accessible data that spans a duration of nearly four decades. The ensuing outcomes, derived through the process of regression analysis, are as shown in Table 1:
Table 1: Regression.
(1) | (2) | (3) | (4) | (5) | |
OLS | OLS | OLS | OLS | OLS | |
VARIABLES | Gini | Gini | Gini | Gini | Gini |
GDP | 3.3039*** | 33.7423*** | 48.9573*** | 63.9624** | 63.1133 |
(0.2215) | (7.0003) | (10.9552) | (28.6575) | (46.1042) | |
GDP-sq | -1.4814*** | -2.2701*** | -3.1452** | -3.1169 | |
(0.3402) | (0.5230) | (1.4824) | (2.3749) | ||
Net migration | -0.0032 | -0.9823 | -1.2272 | ||
(0.4019) | (0.8016) | (0.8614) | |||
Urban population | 4.7080 | -8.7185 | -1.7920 | ||
(12.7476) | (12.5268) | (19.1442) | |||
Rural population | -15.6526 | -20.2279 | -14.6899 | ||
(18.4240) | (25.5170) | (33.3054) | |||
Life expectancy | -0.2524 | 0.1049 | 0.0181 | ||
(0.5190) | (0.4794) | (0.5567) | |||
Trade, % of GDP | -0.0730 | -0.0542 | |||
(0.0486) | (0.0488) | ||||
Tax revenue, % of GDP | 0.0642 | 0.0849 | |||
(0.0869) | (0.0949) | ||||
CPI | 0.1727** | 0.1697* | |||
(0.0692) | (0.0965) | ||||
Dependency ratio | 0.5589 | 0.6050 | |||
(0.4089) | (0.4591) | ||||
Patent | -1.0880 | ||||
(1.3530) | |||||
Constant | 5.2972** | -150.6930*** | -14.1613 | 220.4443 | 15.2100 |
(2.3423) | (35.9191) | (479.4696) | (521.9243) | (725.2280) | |
Observations | 41 | 41 | 41 | 41 | 40 |
R-squared | 0.8754 | 0.9117 | 0.9216 | 0.9356 | 0.9253 |
Association between GDP and Gini Coefficient (see Figure 2): The outcomes of the regression unveil a noteworthy and positive connection between the Gini coefficient and GDP. Furthermore, the inclusion of the squared GDP variable (GDP-sq) into the analysis showcases an important and inverse association with the Gini coefficient. These conclusions put forth the notion that as GDP experiences growth, the Gini coefficient initially ascends and subsequently descends, mirroring a nonlinear pattern reminiscent of the Kuznets curve.
Figure 2: Scatter Plot of Gini vs. GDP with Polynomial Fit. |
Photo credit: Original |
Connection between Net Migration and Gini Coefficient (see Figure 3): The findings of the regression reveal insignificance in the link between net migration and the Gini coefficient. This implies that alterations in the Gini coefficient within the United States are not notably influenced by net migration.
Figure 3: Line Chart of Gini vs. Net Migration.
Photo credit: Original
Urban Population, Rural Population, and Gini Coefficient Interplay: The findings from regression analysis reveal that alterations in urban and rural populations do not exert noteworthy influence over the Gini coefficient. This signifies that shifts in urbanization and rural populace do not distinctly sway changes in the Gini coefficient within the context of the United States.
Interrelation of Life Expectancy and Gini Coefficient: Analyzing the regression outcomes, it becomes apparent that the connection between life expectancy and the Gini coefficient lacks statistical significance. This underscores that variations in life expectancy do not wield a substantial effect on fluctuations in the Gini coefficient in the United States.
Correlation between Trade (% of GDP) and Gini Coefficient: The regression findings demonstrate that the link between the proportion of international trade relative to GDP and the Gini coefficient is not statistically meaningful. This insinuates that alterations in international trade do not carry a notable impact on changes in the Gini coefficient in the United States.
Link between Tax Revenue (% of GDP) and Gini Coefficient: The results of the regression analysis point to the fact that the association between the proportion of tax revenue in relation to GDP and the Gini coefficient lacks statistical significance. This implies that changes in tax revenue do not hold a substantial sway over fluctuations in the Gini coefficient within the United States.
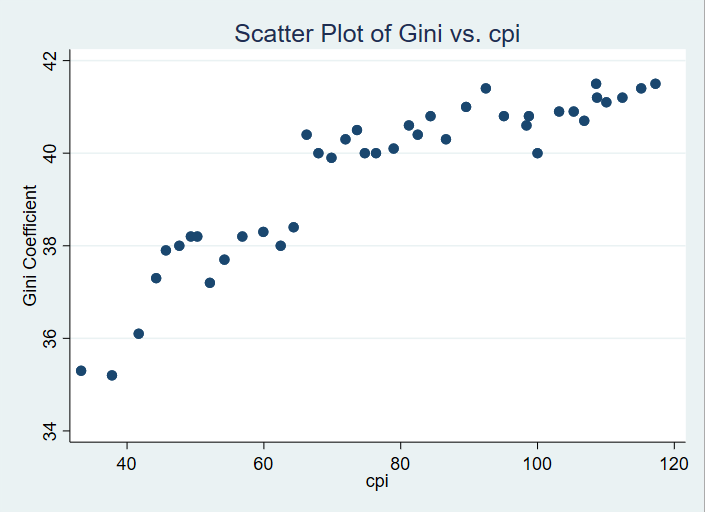
CPI and Gini Coefficient Nexus (see Figure 4): The regression findings unveil a noteworthy and positive correlation between the Consumer Price Index (CPI) and the Gini coefficient. This underscores that an escalation in price levels might potentially exacerbate income inequality.
|
Figure 4: Scatter Plot of Gini vs. CPI. |
Photo credit: Original |
Dependency Ratio and Gini Coefficient Interplay: The findings of the regression analysis indicate an insignificance in the connection between the dependency ratio and the Gini coefficient. This points to the notion that alterations in the Gini coefficient within the United States are not notably influenced by changes in the dependency ratio.
Correlation between Patent Applications and Gini Coefficient: The outcomes of the regression analysis demonstrate a lack of substantial correlation between the quantity of patent applications and the Gini coefficient. This suggests that fluctuations in the Gini coefficient within the United States are not notably impacted by variations in patent application numbers.
The regression outcomes unveil that within the United States, the Gini coefficient is notably influenced by two crucial factors: GDP and CPI. The relationship between GDP and the Gini coefficient takes on a nonlinear character, whereas CPI exhibits a notably positive correlation with the Gini coefficient. Remaining variables do not exert a significant impact on the Gini coefficient.
4. Discussion
GDP and Gini Coefficient Nexus Demonstrates Kuznets Curve Pattern: The connection between GDP and the Gini coefficient adheres to the trajectory of a Kuznets Curve: with the rise in GDP, the Gini coefficient initially ascends and subsequently descends [10]. This pattern concurs with the classical theory of the Kuznets curve, implying that as economic development takes off, income inequality intensifies during the early phases, but as the economy advances, income inequality gradually wanes [11]. This trend can be attributed to the amalgamated impacts of technological progress [12], improved accessibility to education, and bolstered social safety nets fostered by economic expansion [13].
Direct Link between Consumer Price Index (CPI) and Gini Coefficient: Escalating price levels could potentially exacerbate income inequality [14]. The root cause for this phenomenon lies in inflation eroding the purchasing power of individuals with fixed incomes, consequently intensifying income inequality [9].
Inconsequential Association between Other Factors and Gini Coefficient: The connections between net migration, urban population [15], rural population, life expectancy, the proportion of international trade relative to GDP [16], the ratio of tax revenue to GDP, dependency ratio, the count of patent applications, and the Gini coefficient all exhibit insignificance [9]. This implies that these variables insignificantly impact fluctuations in the Gini coefficient within the United States.
5. Conclusion
In conclusion, this study has delved into the factors influencing the Gini coefficient, using a dataset spanning nearly four decades in the United States. The primary objective was to identify the key determinants impacting the Gini coefficient within this context. The analysis revealed two crucial findings that shed light on income inequality dynamics.
Firstly, the relationship between GDP and the Gini coefficient follows a curvilinear pattern. This suggests that economic growth initially exacerbates income inequality before eventually leading to its reduction. This finding aligns with the well-known "Kuznets curve" hypothesis, where economic development's impact on inequality is complex and evolves over time.
Secondly, the study demonstrated a significant positive correlation between the Consumer Price Index (CPI) and the Gini coefficient. This indicates that inflation and price fluctuations can contribute to increased income inequality, likely due to their differential effects on various income groups.
Based on these findings, several policy implications can be drawn. Policymakers should consider adopting measures that target both economic growth and inflation stabilization. Efforts to enhance economic growth need to be complemented with policies that ensure the benefits are broadly distributed to prevent exacerbating inequality. Moreover, effective inflation management becomes crucial to prevent inflation-induced inequality spikes.
In conclusion, this study not only contributes to a deeper understanding of the factors influencing income inequality as measured by the Gini coefficient but also provides insights that can guide policymakers in crafting effective strategies to address these disparities.
References
[1]. Tahsin E. An approach to Inequalities beyond Gini Coefficients in Case of Turkey. INTERNATIONAL INTERDISCIPLINARY BUSINESS-ECONOMICS ADVANCEMENT CONFERENCE, 2014. 523.
[2]. Corneo G, Jeanne O. Status, the distribution of wealth, and growth. Scandinavian Journal of Economics, 2001, 103(2): 283-293.
[3]. Khalatur S, Trokhymets O, Karamushka O. Conceptual basis of tax policy formation in the globalization conditions. Baltic Journal of Economic Studies, 2020, 6(2): 81-92.
[4]. Ziesemer T. Gini coefficients of education for 146 countries, 1950-2010. Bulletin of Applied Economics, 2016, 3(2): 1-8.
[5]. Ellison G T. Letting the Gini out of the bottle? Challenges facing the relative income hypothesis. Social science & medicine, 2002, 54(4): 561-576.
[6]. Nishitateno S, Burke P J. Kuznets curve. Ssrn Electronic Journal, 2014.
[7]. Yue H Y. Income inequality, economic growth and inflation: A study on Korea. International Journal of Economics and Research, 2011, 2(5): 14-21.
[8]. Ali S, Chaudhry I S, Farooq F. Human capital formation and economic growth in Pakistan. Pakistan Journal of Social Sciences, 2012, 32(1): 229-240.
[9]. Huang C J. Corruption and income inequality in Asian countries: Bootstrap panel granger causality test. Romanian Journal of Economic Forecasting, 2013, 16(4): 161-170.
[10]. Alessina A, Rodrik D. Distributive politics and economic growth. The quarterly journal of economics, 1994, 109(2): 465-490.
[11]. Pessino C, Fenochietto R. Determining countries' tax effort. Hacienda Pública Española/Revista de Economía Pública, 2010: 65-87.
[12]. Aronson J R, Lambert P J. Decomposing the Gini coefficient to reveal the vertical, horizontal, and reranking effects of income taxation. National Tax Journal, 1994, 47(2): 273-294.
[13]. Kuznets S. Economic growth and inequality income[J]. American Economic Review, 1955, 45(1): 1-28.
[14]. Malik Z, Zaman K. Macroeconomic consequences of terrorism in Pakistan. Journal of Policy Modeling, 2013, 35(6): 1103-1123.
[15]. Bjarnason T, Bendtsen P, Arnarsson A M, Borup I, Iannotti R J, Löfstedt P, Niclasen B, et al. Life satisfaction among children in different family structures: A comparative study of 36 western societies. Children & Society, 2012, 26(1): 51-62.
[16]. Bourguignon F, Morrison C. Income distribution among world citizens: 1820–1990. American Economic Review, 2002, 92(September): 1113-1132.
Cite this article
Wang,Z. (2024). The Impact Factors of Gini Coefficient: Taking the US as an Example. Advances in Economics, Management and Political Sciences,59,208-215.
Data availability
The datasets used and/or analyzed during the current study will be available from the authors upon reasonable request.
Disclaimer/Publisher's Note
The statements, opinions and data contained in all publications are solely those of the individual author(s) and contributor(s) and not of EWA Publishing and/or the editor(s). EWA Publishing and/or the editor(s) disclaim responsibility for any injury to people or property resulting from any ideas, methods, instructions or products referred to in the content.
About volume
Volume title: Proceedings of the 2nd International Conference on Financial Technology and Business Analysis
© 2024 by the author(s). Licensee EWA Publishing, Oxford, UK. This article is an open access article distributed under the terms and
conditions of the Creative Commons Attribution (CC BY) license. Authors who
publish this series agree to the following terms:
1. Authors retain copyright and grant the series right of first publication with the work simultaneously licensed under a Creative Commons
Attribution License that allows others to share the work with an acknowledgment of the work's authorship and initial publication in this
series.
2. Authors are able to enter into separate, additional contractual arrangements for the non-exclusive distribution of the series's published
version of the work (e.g., post it to an institutional repository or publish it in a book), with an acknowledgment of its initial
publication in this series.
3. Authors are permitted and encouraged to post their work online (e.g., in institutional repositories or on their website) prior to and
during the submission process, as it can lead to productive exchanges, as well as earlier and greater citation of published work (See
Open access policy for details).
References
[1]. Tahsin E. An approach to Inequalities beyond Gini Coefficients in Case of Turkey. INTERNATIONAL INTERDISCIPLINARY BUSINESS-ECONOMICS ADVANCEMENT CONFERENCE, 2014. 523.
[2]. Corneo G, Jeanne O. Status, the distribution of wealth, and growth. Scandinavian Journal of Economics, 2001, 103(2): 283-293.
[3]. Khalatur S, Trokhymets O, Karamushka O. Conceptual basis of tax policy formation in the globalization conditions. Baltic Journal of Economic Studies, 2020, 6(2): 81-92.
[4]. Ziesemer T. Gini coefficients of education for 146 countries, 1950-2010. Bulletin of Applied Economics, 2016, 3(2): 1-8.
[5]. Ellison G T. Letting the Gini out of the bottle? Challenges facing the relative income hypothesis. Social science & medicine, 2002, 54(4): 561-576.
[6]. Nishitateno S, Burke P J. Kuznets curve. Ssrn Electronic Journal, 2014.
[7]. Yue H Y. Income inequality, economic growth and inflation: A study on Korea. International Journal of Economics and Research, 2011, 2(5): 14-21.
[8]. Ali S, Chaudhry I S, Farooq F. Human capital formation and economic growth in Pakistan. Pakistan Journal of Social Sciences, 2012, 32(1): 229-240.
[9]. Huang C J. Corruption and income inequality in Asian countries: Bootstrap panel granger causality test. Romanian Journal of Economic Forecasting, 2013, 16(4): 161-170.
[10]. Alessina A, Rodrik D. Distributive politics and economic growth. The quarterly journal of economics, 1994, 109(2): 465-490.
[11]. Pessino C, Fenochietto R. Determining countries' tax effort. Hacienda Pública Española/Revista de Economía Pública, 2010: 65-87.
[12]. Aronson J R, Lambert P J. Decomposing the Gini coefficient to reveal the vertical, horizontal, and reranking effects of income taxation. National Tax Journal, 1994, 47(2): 273-294.
[13]. Kuznets S. Economic growth and inequality income[J]. American Economic Review, 1955, 45(1): 1-28.
[14]. Malik Z, Zaman K. Macroeconomic consequences of terrorism in Pakistan. Journal of Policy Modeling, 2013, 35(6): 1103-1123.
[15]. Bjarnason T, Bendtsen P, Arnarsson A M, Borup I, Iannotti R J, Löfstedt P, Niclasen B, et al. Life satisfaction among children in different family structures: A comparative study of 36 western societies. Children & Society, 2012, 26(1): 51-62.
[16]. Bourguignon F, Morrison C. Income distribution among world citizens: 1820–1990. American Economic Review, 2002, 92(September): 1113-1132.