


1. Introduction
In the modern financial system, portfolio management has been regarded as the core means of successful capital allocation. Over the past decade, due to the rapid development of society and the increasing uncertainty in financial market fluctuations, constructing a robust investment portfolio to maintain and enhance real assets has become a top priority for many investors. Over the past three years, the pandemic has had multifaceted impacts on the global economy. Transportation restrictions have weakened the global supply chain, causing production delays and increased costs [1]. People's movements have been limited, significantly reducing consumer demand, particularly in the tourism and catering industries [2]. Many businesses have closed or scaled down operations, resulting in decreased corporate revenues and massive layoffs [3]. Moreover, the Russo-Ukrainian war has also led to unstable energy supplies, thereby causing a surge in inflation, among other ramifications. Consequently, the research into investment portfolio allocation strategies and optimization techniques has become increasingly important.
After Harry Markowitz introduced the Modern Portfolio Theory in 1952, investors started to focus on how to effectively compose asset portfolios to balance returns and risks [4]. Markowitz's MPT theory is based on mean-variance optimization, which means it relies on two main statistical measures: the mean of expected returns and the variance of asset returns. The concept of the efficient frontier, or the collection of several different portfolios that may generate the maximum predicted return at a particular degree of risk, is also introduced in MPT. Through this method, investors can assess the trade-offs between risk and return for different portfolios while also finding the optimal weights for the best investment portfolio [5]. Given the speed at which science and technology are developing, many tech stocks have brought significant returns to investors over the past decade [6]. When constructing a portfolio, what weight should these high-growth tech stocks have? Is there a need to combine them with defensive stocks to adjust risk? These are questions that still need to be explored.
Therefore, this paper selects ten US stocks for portfolio research, namely "Apple Inc.", Amazon.com Inc., Johnson & Johnson, JPMorgan Chase & Co., The Coca-Cola Company, Meta Platforms, Inc., Microsoft Corporation, Netflix, Inc., NVIDIA Corporation, and Tesla, Inc. Monte Carlo simulation was used to simulate 10 million different investment portfolios of the 10 stocks and derive the weights under the GMVP and the Maximum Sharpe Ratio portfolios. These weights were used to calculate the cumulative returns of these two types of portfolios and the 1/N portfolio using the actual data from 2022-2023. Then, the returns of the three portfolios were compared with the S&P 500 index. The outcome demonstrate that the 1/N and the maximum Sharpe ratio portfolio outperformed the benchmark index, while the return of the GMVP was far below the benchmark index. To verify the effectiveness of the model and the rationality of the method and conclusions, this paper conducted a robustness check. In the robustness check, this study chose to eliminate stocks with an extremely low proportion of weight and re-established the model for calculations. According to the results of the robustness check, the performance of the three investment portfolios is very similar to the performance of the original model, indicating that the methods and conclusions in this study are valid.
2. Data
The data in this study was sourced from Yahoo Finance (https://finance.yahoo.com), and the ten stock symbols are "AAPL", "AMZN", "JNJ", "JPM", "KO", "META", "MSFT", "NFLX", "NVDA", and "TSLA" (See Table 1). The network effect, which occurs when a product or service's value rises as the number of users increases, may result in higher returns for investors, is a major factor in the selection of these 10 businesses. It is common for high-tech enterprises to experience this phenomenon [7]. Additionally, selecting sectors like healthcare, consumer non-durables, and finance can make investments more diversified. Diversity can reduce the volatility and downside risk of a portfolio, enhancing its stability and predictability [8]. Moreover, all of these companies are pioneers in their respective industries, which means they have higher stability, making the prediction accuracy of this research more substantial. The Adj Close from August 2012 to August 2022 was collected as the training set to calculate average returns and volatility, construct the efficient frontier, and determine the weights of the portfolio. The Adj Close data from August 2022 to August 2023 was collected as the test set to calculate the cumulative return rate and evaluate its performance compared to the S&P 500 index.
Table 1: Basic information.
Ticker symbol | Company | Annualized returns | Annualized Volatility |
AAPL | Apple Inc. | 0.192327 | 0.288007 |
AMZN | Amazon.com Inc. | 0.216250 | 0.316374 |
JNJ | Johnson & Johnson | 0.110479 | 0.175249 |
JPM | JPMorgan Chase & Co. | 0.115261 | 0.265280 |
KO | The Coca-Cola Company | 0.063070 | 0.180601 |
META | Meta Platforms, Inc. | 0.139051 | 0.380698 |
MSFT | Microsoft Corporation | 0.235573 | 0.263521 |
NFLX | Netflix, Inc. | 0.245286 | 0.479116 |
NVDA | NVIDIA Corporation | 0.373127 | 0.427800 |
TSLA | Tesla, Inc. | 0.427756 | 0.562133 |
3. Methods
3.1. Mean-Variance Model
The goal of the mean-variance model is to either reduce the portfolio’s variance for a given expected return or to maximize the expected return for a given level of risk. This model can be used to calculate the asset weights in order to balance risk and return.
\( E({R_{p}})= \sum _{x=1}^{n}{w_{x}}E({R_{x}}) \) (1)
Where \( E({R_{p}}) \) represents the expected return of the portfolio, \( {w_{x}} \) is the weight of asset x in the portfolio, \( E({R_{x}}) \) is the expected return of asset x, and n is the number of assets in the portfolio.
\( σ_{p}^{2}= \sum _{x=1}^{n}\sum _{y=1}^{n}{w_{x}}{w_{y}}{σ_{xy}} \) (2)
Where \( σ_{p}^{2} \) is the variance of the portfolio, \( {w_{x}} \) and \( {w_{y}} \) represent the weights of assets x and y in the portfolio, respectively, and \( {σ_{xy}} \) is the covariance of the returns of assets x and y.
3.2. Three Types of Portfolios
This study uses the GMVP, the 1/N portfolio and the maximum Sharpe ratio portfolio, of which only the 1/N portfolio is not on the efficient frontier. According to research, considering estimation errors, there is no model that is always superior to the equal-weighted portfolio model [9], so this study also includes the 1/N portfolio in the research. The GMVP model offers the investment portfolio with the lowest amount of risk among all conceivable investment portfolios for risk-averse investors. A frequently used and recognized indicator of an investment portfolio's risk-adjusted performance is the Sharpe ratio [10].
\( Sharpe Ratio =\frac{{R_{p}}-{R_{rf}}}{{σ_{p}}} \) (3)
where \( {R_{p}} \) is the expected return of the portfolio, \( {R_{rf}} \) is the risk-free rate, in this study, it is the yield of the 3-month US Treasury bond, and \( {σ_{p}} \) is the expected volatility of the portfolio.
4. Result
The Yahoo Finance data from August 1, 2012, to August 1, 2022, was selected as the training set (https://finance.yahoo.com). By simulating random weights, calculating their expected returns and volatilities, and repeating this process 10,000,000 times, the following scatter plot can be obtained (See Figure 1).
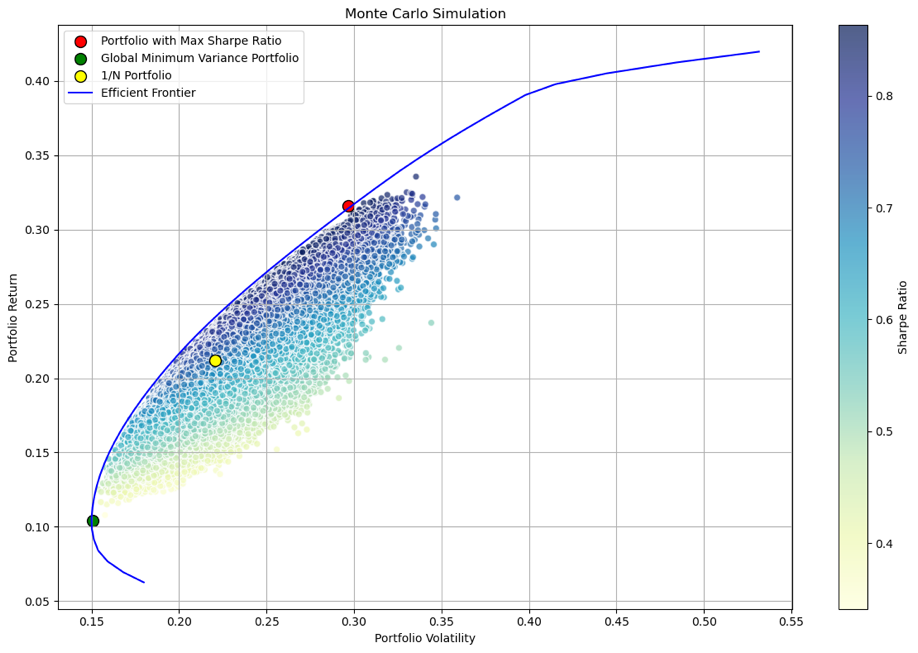
Figure 1: The results of Monte Carlo Simulation.
The blue edge in the figure is the efficient frontier, and the portfolios below the efficient frontier are all suboptimal. The points of the three portfolios are also shown in the figure. The 1/N portfolio merely assigns each asset the same weight, therefore it may not always produce the maximum predicted return for a particular risk. Therefore, it is normal for it not to be on the efficient frontier. However, as can be seen in the figure, the GMVP point marked in green, the portfolios below this point along the efficient frontier are also suboptimal because, with the same level of risk, higher returns can be achieved by changing the weights.
The below Table 2 shows the weight distribution of the two portfolios. From the chart, the weight proportions of the two portfolios are almost completely different. MSFT and NVDA have the highest proportions in the portfolio with the maximum Sharpe ratio, 34.8356% and 33.1666% respectively, while AAPL and others have a zero proportion. In the GMVP, JNJ and KO have the highest proportions, 44.2749% and 41.1604% respectively. In both portfolios, the weight proportions of JPM, META, and NFLX are very small (less than 3%). The reason for the completely different weights of the two portfolios can be fully understood. For investors who choose GMVP, they value low risk more, while for investors who choose the maximum Sharpe ratio portfolio, they value the rate of return more.
Table 2: The weights of each stock in the two portfolios (%).
Ticker symbol | Maximum Sharpe Ratio | GMVP |
AAPL | 0 | 3.7577 |
AMZN | 0 | 6.1529 |
JNJ | 8.0208 | 44.2749 |
JPM | 0 | 0.9117 |
KO | 0 | 41.1604 |
META | 0 | 1.6304 |
MSFT | 34.8356 | 0 |
NFLX | 0.5545 | 2.1121 |
NVDA | 33.1666 | 0 |
TSLA | 23.4224 | 0 |
In this study, data from August 2022 to August 2023 was used as the test set (See Figure 2 and Table 3). The returns on the two portfolios can be estimated after getting their weights. To verify the performance of different portfolios, this study chose to compare these portfolios with the S&P 500 index, which is one of the most popular indices for index funds and exchange-traded funds (ETFs) and is regarded as a reliable gauge of the state of the American economy. The index was first introduced by the financial services company Standard & Poor's in 1957. A lot of investors and financial experts use the S&P 500 as a benchmark for their investments [11].
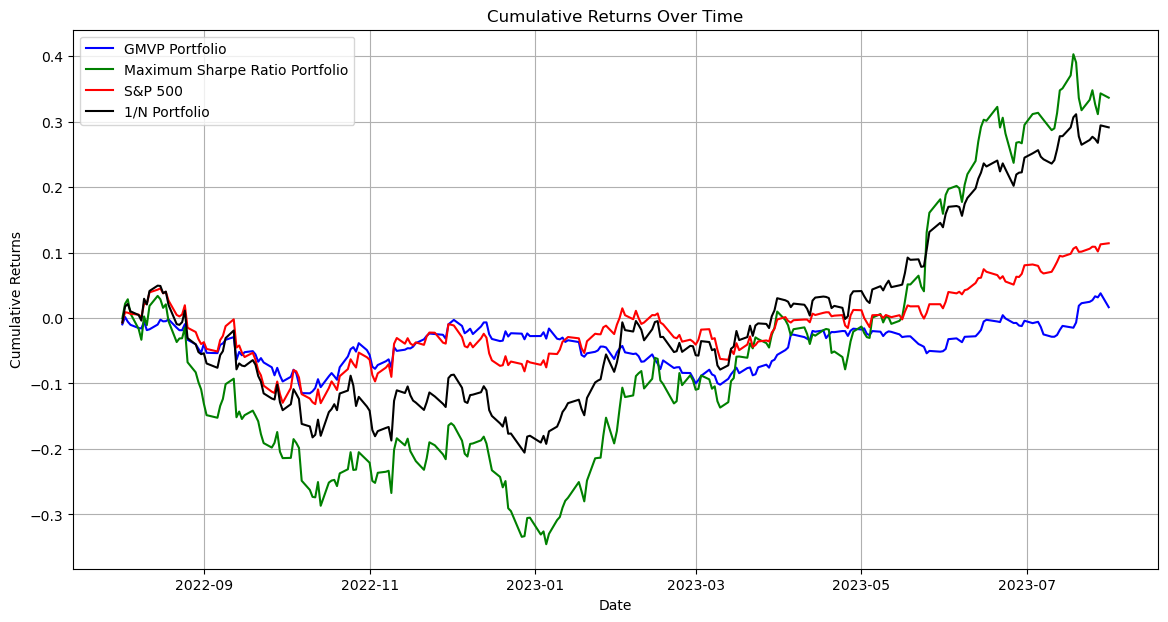
Figure 2: Cumulative return over time for portfolios.
Table 3: Financial characteristics of the portfolios.
Portfolio | Return (%) |
Maximum Sharpe Ratio | 33.6577 |
GMVP | 1.6532 |
1/N | 29.1258 |
S&P500 | 11.4196 |
According to Figure 2, the return of the GMVP from August 2022 to February 2023 was almost the same as the S&P 500, then it continuously declined, resulting in a final cumulative return much lower than the S&P 500. However, for the Maximum Sharpe Ratio and 1/N Portfolios, the S&P 500 was far ahead of these two portfolios before March 2023, but the rapid growth after March made the final returns of these two portfolios almost 2-3 times the market. Therefore, for these ten stocks, the Maximum Sharpe Ratio and the 1/N Portfolios are not only better than the market index but also superior to the GMVP.
5. Robustness
To test the effectiveness of the portfolios, this study also conducted a robustness check. First, in the stock selection, this study removed JPM, META, and NFLX because these three stocks had the smallest weight in both portfolios. Next, the Monte Carlo simulation was run repeatedly to determine the efficient frontier and the weights for the GMVP and the Maximum Sharpe Ratio Portfolio. The following Table 4 shows weights:
Table 4: The weights of each stock in the two portfolios for robustness checks (%).
Ticker symbol | Maximum Sharpe Ratio | GMVP |
AAPL | 0 | 0 |
AMZN | 0 | 0 |
JNJ | 0 | 39.0589 |
KO | 0 | 58.6782 |
MSFT | 0 | 0.5686 |
NVDA | 100 | 0 |
TSLA | 0 | 1.6943 |
In the GMVP, the highest weight is still held by JNJ and KO, at 39.0589% and 58.6782%, respectively. In the Maximum Sharpe Ratio Portfolio, the largest weight is held by NVDA, at 100%, which means investing in this company only. NVDA also has the highest weight in the original portfolio of 10 stocks.
Similarly, after obtaining the weights of the two portfolios, their cumulative returns can be calculated and compared with the S&P 500 (See Figure 3 and Table 5).
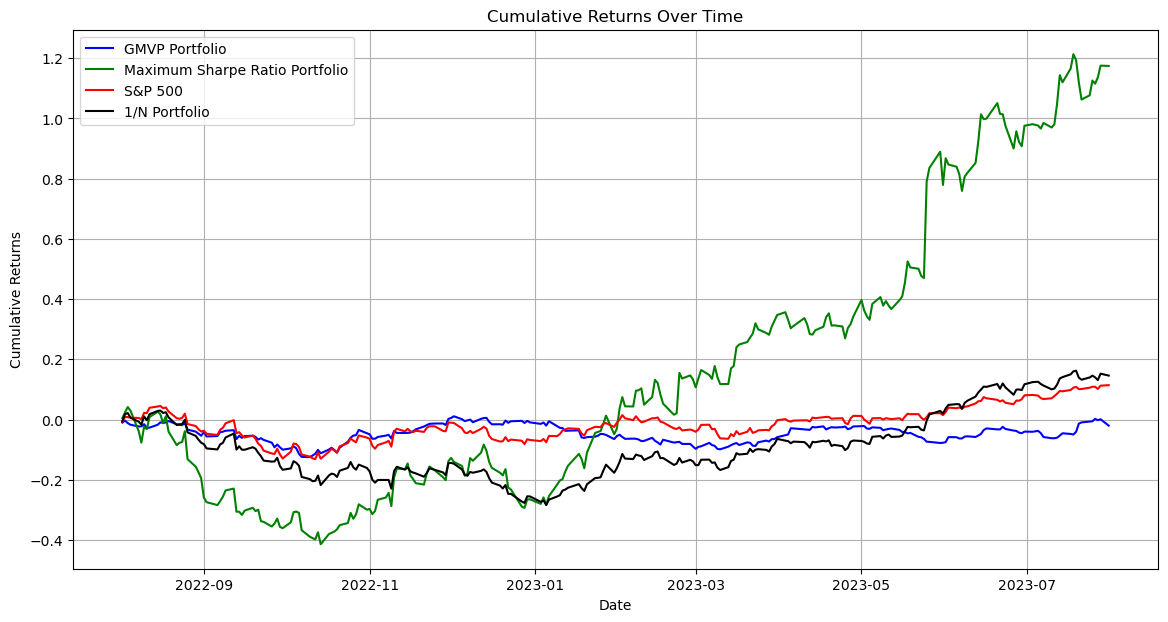
Figure 3: Cumulative return over time for portfolios for robustness checks.
Table 5: Financial characteristics of the portfolios for robustness checks.
Portfolio | Return (%) |
Maximum Sharpe Ratio | 117.4330 |
GMVP | -2.2916 |
1/N | 14.5994 |
S&P500 | 11.4196 |
According to the chart, both the maximum Sharpe ratio portfolio and the 1/N portfolio perform better than the market, while the GMVP performs below the market. This outcome is in line with the initial model predicted. In the test model, the return on the maximum Sharpe ratio portfolio even exceeds 100%. Therefore, this method and result are valid.
6. Conclusion
The importance of portfolio optimization has become increasingly significant in today's world, where economic recessions and surges in inflation impact the financial markets. This study aimed to understand the optimal portfolio construction among ten selected US stocks from diverse sectors using Monte Carlo simulation to determine the efficient frontier and construct three types of portfolios: equal-weighted(1/N), global minimum variance (GMVP), and maximum Sharpe ratio. The findings of this study revealed that the maximum Sharpe ratio and 1/N portfolios outperformed the S&P 500 index, whereas the GMVP did not. Specifically, in the maximum Sharpe ratio portfolio, Microsoft and Nvidia carried the highest weights, whereas Johnson & Johnson and Coca-Cola had the highest weights in the GMVP. Notably, the maximum Sharpe ratio and 1/N portfolios not only performed better than the S&P 500 index but also surpassed the GMVP, which is a crucial insight for investors prioritizing return over risk.
Future research should consider a broader array of stocks, different economic conditions, and alternative portfolio construction methods to further validate and expand these findings. For investors, various aspects such as the basic situation of each company, financial statements, profitability, valuation indicators, industry analysis, technical analysis, and internet reviews are all worth considering. The model is just a tool for constructing or validating a portfolio, and the mastery of information is the most important part in the portfolio.
References
[1]. Guan, D., Wang, D., and Hallegatte, S., et al. (2020). Global supply-chain effects of COVID-19 control measures. Nature human behaviour, 4(6), 577-587.
[2]. Baker, S. R., Bloom, N., Davis, S. J., Kost, K. J., Sammon, M. C., and Viratyosin, T. (2020). The unprecedented stock market impact of COVID-19 (No. w26945). national Bureau of economic research.
[3]. Barrero, J. M., Bloom, N., and Davis, S. J. (2020). COVID-19 is also a reallocation shock (No. w27137). National Bureau of Economic Research.
[4]. Markowitz, H. (1952). Portfolio selection. The Journal of Finance, 7(1), 77-91.
[5]. Elton, E. J., and Gruber, M. J. (1995). Modern portfolio theory, 1950 to date. Journal of Banking & Finance, 21(11-12), 1743-1759.
[6]. Liu, Y., and Tsai, C. L. (2014). The high growth of the high-tech industry. Journal of Business & Economic Statistics, 32(3), 423-434.
[7]. Shapiro, C., and Varian, H. R. (1999). Information rules: A strategic guide to the network economy. Harvard Business Press.
[8]. Statman, M. (1987). How many stocks make a diversified portfolio?. Journal of financial and quantitative analysis, 22(3), 353-363.
[9]. DeMiguel, V., Garlappi, L., and Uppal, R. (2009). Optimal versus naive diversification: How inefficient is the 1/N portfolio strategy?. The review of Financial studies, 22(5), 1915-1953.
[10]. Sharpe, W. F. (1964). Capital asset prices: A theory of market equilibrium under conditions of risk. The journal of finance, 19(3), 425-442.
[11]. McNeil, A. J., Frey, R., and Embrechts, P. (2015). Quantitative risk management: Concepts, techniques, and tools. Princeton university press.
Cite this article
Gao,W. (2024). Portfolio Optimization Based on U.S. Stock. Advances in Economics, Management and Political Sciences,59,258-264.
Data availability
The datasets used and/or analyzed during the current study will be available from the authors upon reasonable request.
Disclaimer/Publisher's Note
The statements, opinions and data contained in all publications are solely those of the individual author(s) and contributor(s) and not of EWA Publishing and/or the editor(s). EWA Publishing and/or the editor(s) disclaim responsibility for any injury to people or property resulting from any ideas, methods, instructions or products referred to in the content.
About volume
Volume title: Proceedings of the 2nd International Conference on Financial Technology and Business Analysis
© 2024 by the author(s). Licensee EWA Publishing, Oxford, UK. This article is an open access article distributed under the terms and
conditions of the Creative Commons Attribution (CC BY) license. Authors who
publish this series agree to the following terms:
1. Authors retain copyright and grant the series right of first publication with the work simultaneously licensed under a Creative Commons
Attribution License that allows others to share the work with an acknowledgment of the work's authorship and initial publication in this
series.
2. Authors are able to enter into separate, additional contractual arrangements for the non-exclusive distribution of the series's published
version of the work (e.g., post it to an institutional repository or publish it in a book), with an acknowledgment of its initial
publication in this series.
3. Authors are permitted and encouraged to post their work online (e.g., in institutional repositories or on their website) prior to and
during the submission process, as it can lead to productive exchanges, as well as earlier and greater citation of published work (See
Open access policy for details).
References
[1]. Guan, D., Wang, D., and Hallegatte, S., et al. (2020). Global supply-chain effects of COVID-19 control measures. Nature human behaviour, 4(6), 577-587.
[2]. Baker, S. R., Bloom, N., Davis, S. J., Kost, K. J., Sammon, M. C., and Viratyosin, T. (2020). The unprecedented stock market impact of COVID-19 (No. w26945). national Bureau of economic research.
[3]. Barrero, J. M., Bloom, N., and Davis, S. J. (2020). COVID-19 is also a reallocation shock (No. w27137). National Bureau of Economic Research.
[4]. Markowitz, H. (1952). Portfolio selection. The Journal of Finance, 7(1), 77-91.
[5]. Elton, E. J., and Gruber, M. J. (1995). Modern portfolio theory, 1950 to date. Journal of Banking & Finance, 21(11-12), 1743-1759.
[6]. Liu, Y., and Tsai, C. L. (2014). The high growth of the high-tech industry. Journal of Business & Economic Statistics, 32(3), 423-434.
[7]. Shapiro, C., and Varian, H. R. (1999). Information rules: A strategic guide to the network economy. Harvard Business Press.
[8]. Statman, M. (1987). How many stocks make a diversified portfolio?. Journal of financial and quantitative analysis, 22(3), 353-363.
[9]. DeMiguel, V., Garlappi, L., and Uppal, R. (2009). Optimal versus naive diversification: How inefficient is the 1/N portfolio strategy?. The review of Financial studies, 22(5), 1915-1953.
[10]. Sharpe, W. F. (1964). Capital asset prices: A theory of market equilibrium under conditions of risk. The journal of finance, 19(3), 425-442.
[11]. McNeil, A. J., Frey, R., and Embrechts, P. (2015). Quantitative risk management: Concepts, techniques, and tools. Princeton university press.