


1. Introduction
Over the past few years, the world has experienced an unprecedented epidemiological challenge, namely, the new coronavirus pneumonia epidemic. Since the outbreak of the epidemic, its far-reaching impacts on the global economic system cannot be ignored, one of which is the fluctuation of currency exchange rates among countries. The fluctuations in the currency markets between the US dollar and the Chinese yuan, two of the world's most important currencies, have profoundly shaped the global economic landscape.
The rapid spread of the new coronavirus pneumonia outbreak, which led to worldwide embargoes, quarantine measures, and disruption of production activities, has deeply influenced global economic stability. The economies of many countries have fallen into recession, stock markets are in turmoil, and multinational enterprises are facing difficulties such as reduced production capacity and supply chain disruptions. In this highly uncertain environment, investor sentiment fluctuated dramatically, leading to sharp fluctuations in global financial markets. The exchange rate of the United States dollar, as one of the world's leading reserve currencies, has been of particular concern.
Regarding COVID-19's impact on exchange rate volatility, Lamia stated that the epidemic did have an impact on the currency markets of the US dollar and the Chinese yuan [1]. And combined with similar crisis events in the past often have a profound effect on exchange rates. For example, the financial crisis of 2008 led to a significant appreciation of the US dollar, and many countries' currencies came under pressure. This outbreak of the Covid-19 epidemic also triggered exchange rate fluctuations globally in a relatively short period of time. The currencies of the two countries depreciated, while the currencies of some countries appreciated due to the demand for risk aversion. The exchange rate of RMB, a currency that has been advancing internationally in recent years, has also been greatly affected.
Against this backdrop, the movement of the RMB exchange rate has attracted much attention. China, as the earliest country in the outbreak of the epidemic, controlled the spread of the epidemic earlier through strict blockade and preventive and control measures. However, the Chinese economy is also under considerable pressure due to the impact of declining demand and disruption of the supply chain on a global scale. The RMB exchange rate, against this backdrop, has been affected by multiple factors from both domestic and international sources, including trade prospects, international capital flows, and international investor sentiment. Therefore, studying the influence of COVID-19 on the RMB-dollar currency markets can help people gain a deeper understanding of the operating mechanism of the global financial market.
Sudhi Sharma and Miklesh Prasad et al. analyzed the impact of the epidemic on the exchange rates of six major epidemic-hit regions (China, the United States, Italy, Spain, France, and Germany) and found that the impact of the epidemic on the exchange rate depends on factors such as the economic structure of each country, its trade relations, its policy responses, and its market expectations [2]. However, Jamal et al. found that the epidemic led to increased uncertainty in exchange rate expectations and a decline in abnormal returns. They used a model of exchange rate expectations based on survey data and an indicator of abnormal returns based on the difference between actual and expected exchange rates. The results showed that during the epidemic, exchange rate expectations of countries experienced significant volatility and deviations, reflecting market concerns and confusion about future exchange rate movements [3]. While Beckmann et al. considered the impact of Covid-19 as a special kind of news time. They used a method based on text analysis and machine learning to extract exchange rate-related information from news headlines and constructed a new index to measure the influence of media happenings on currency value changes. The results show that news events play a major role in the volatility of currency exchange rates., and different types of news events have different directions and degrees of impact [4].Aquilante et al. study the impact of the Covid-19 epidemic on the exchange rates of Emerging Market Economies (EMEs) and the local currency bond market, and find that the epidemic has a negative impact on both the exchange rates of the EMEs and the local currency bond market, but the magnitude and duration of the effect depends on the fundamentals and policy space of each country [5]. Hofmann et al. explored the impact of trade wars and the Covid-19 epidemic on the economic interplay between the U.S. and China. and found that both the trade wars and the epidemic have negative impacts on the economic interplay between the U.S. and China, but there is also the possibility and necessity of cooperation [6]. Yilmaz Uday et al. analyzed the spillover effects of the U.S. monetary policy on the exchange rates of other countries and considered the impact of the Covid-19 epidemic as an exogenous shock. The authors use a panel data regression-based approach to analyze the influence of American fiscal regulations on the currency rates of 40 nations, using the March 15, 2020, announcement by the Federal Reserve to cut interest rates to the upper and lower bounds of zero. The results show that U.S. monetary policy has a significant spillover effect on the exchange rates of other countries, and the spillover effect is related to the countries' trade links with the U.S., financial links, monetary systems, and other factors [7]. Hakan Yilmaz Uday examined how U.S. financial policy impacts the currency rates of 11 emerging and 12 developed markets by contrasting 2019's pre-pandemic era with the Covid-19 period in 2020. The results show that in the pre-Covid-19 period, U.S. monetary policy had significant spillover effects on the foreign exchange rates in a variety of countries, as opposed to during the Covid-19 era, these spillover effects were only effective for certain countries [8].
In summary, the CKP epidemic has had a significant and complex impact on national exchange rates, and the impact has varied from country to country. There may be differences in the extent of this impact and the causes of this phenomenon in each country. In this regard, the research in this paper conducts a comprehensive analysis of how the CKP epidemic has affected the USD-RMB exchange rate, offering valuable insights into understanding the dynamics of the global financial markets and providing practical recommendations for investors and policymakers.
2. Research Design
2.1. Data Sources
The first step of the study is to collect relevant exchange rate data, and this study takes access to publicly available data sources in the financial markets, such as financial news, data released by financial institutions, or databases of financial market data providers. For historical data on the U.S. exchange rate, this study accessed https://exchangerates.org.uk/ [9]. For reported cases of the Covid-19 outbreak, the European Center for Disease Prevention and Control (ECDC) was visited.
2.2. Weak Stationarity Test
Before analyzing time series data, a unit root test is often required to determine if the data is smooth. Smooth data is essential for time series analysis. In this paper, we determine whether a series has a unit root by using the ADF test.
The statistical model for the ADF test is as follows:
\( ∆{y_{t}}= α+ {β_{t}}+ γ{y_{t-1}}+ δΔ{y_{t-1}} + {ε_{t}} \) | (1) |
In this equation:
\( ∆ \) denotes the difference operation, i.e., the first order difference of the time series.
\( {y_{t}} \) denotes a time series data point.
\( α \) is an intercept term.
\( β \) is a trend term to account for the time trend.
\( γ \) is a coefficient indicating the effect of the lagged value of \( {y_{t-1}} \) in explaining \( {y_{t}} \) .
\( δ \) is a coefficient indicating the effect of the lagged value of \( ∆{y_{t-1}} \) in explaining \( ∆{y_{t}} \) .
\( {ε_{t}} \) is the error term.
2.3. ARIMA Model Setup
Once the smoothness of the data has been determined, this paper uses the ARIMA model to model the exchange rate data. The ARIMA (Autoregressive Integrated Moving Average) model is a commonly used language time series approach that combines autoregressive (AR) and sliding average (MA) components.
The ARMA (p, q) model can be represented by the following equation:
\( {Y_{t}}=c+{φ_{1}}{Y_{t-1}}+{φ_{2}}{Y_{t-2}}+…+{φ_{p}}{Y_{t-p}}+{θ_{1}}{ε_{t-1}}+{θ_{2}}{ε_{t-2}}+…+{θ_{q}}{ε_{t-q}}+{ε_{t}} \) | (2) |
In this equation:
\( {Y_{t}} \) denotes the current observation of the time series.
\( c \) is a constant that denotes the intercept term of the model.
\( p \) is the autoregressive (AR) order, which denotes the number of past observations of the time series, and is denoted by \( φ \) for the coefficients of the individual lag terms.
\( q \) is the moving average (MA) order, which denotes the number of lagged errors, with \( θ \) denoting the coefficients of the individual lagged errors.
\( {ε_{t}} \) denotes the white noise error term, which is usually assumed to be an independent and identically distributed random variable with mean 0 and constant variance.
The goal of an ARMA model is to fit time series data by estimating the parameters \( φ \) and \( θ \) for forecasting and analysis. Choosing the appropriate p and q usually requires model selection and parameter estimation, which can be accomplished using statistical software and methods.
3. Empirical Results and Analysis
Table 1 shows the results of the weak smoothness test on time series data.
Table 1: Weak stationarity test
t | p | |
Daily | ||
Raw | -1.808 | 0.7007 |
1st order difference | -35.612 | 0.0000 |
Weekly | ||
Raw | -1.905 | 0.6519 |
1st order difference | -14.287 | 0.0000 |
Monthly | ||
Raw | -2.326 | 0.4194 |
1st order difference | -6.873 | 0.0000 |
2nd order difference | -12.310 | 0.0000 |
In time series analysis, order fixing means determining the appropriate number of differences to make the data smooth. Smooth data is easier to model and forecast. According to the results in Table 1, the original data at different time intervals as well as the data with first order and second-order differencing were tested for weak smoothness. Based on the test results, the following fixed-order summary can be drawn:
1) In the daily frequency, the p-value of the weak smoothness test for the first-order difference is 0. The initial hypothesis has been disproved, suggesting that the first-order differentiation noticeably reduces data volatility.
2) In the weekly frequency, the p-value of the weak smoothness test for the first-order difference is 0. The initial hypothesis has been disproved, suggesting that the first-order differentiation noticeably reduces data volatility.
3) The p-value of the weak smoothness test for the first-order difference is 0 in the monthly frequency and the initial hypothesis has been disproved, suggesting that the first-order differentiation noticeably reduces data volatility. The p-value of the weak smoothness test for second-order differencing is 0, rejecting the original hypothesis, indicating that second-order differencing also significantly smooths the data.
In summary, based on the results of the weak smoothness test, first-order differencing significantly smoothest the data in most cases for data with different time frequencies, and second-order differencing is also an optional choice for data with monthly frequencies as it also significantly makes the data smoother.
PACF | ACF |
Daily | |
|
|
Weekly | |
|
|
Monthly | |
|
|
Figure 1: ARMA (p, q) identification | |
Photo credit: Original | |
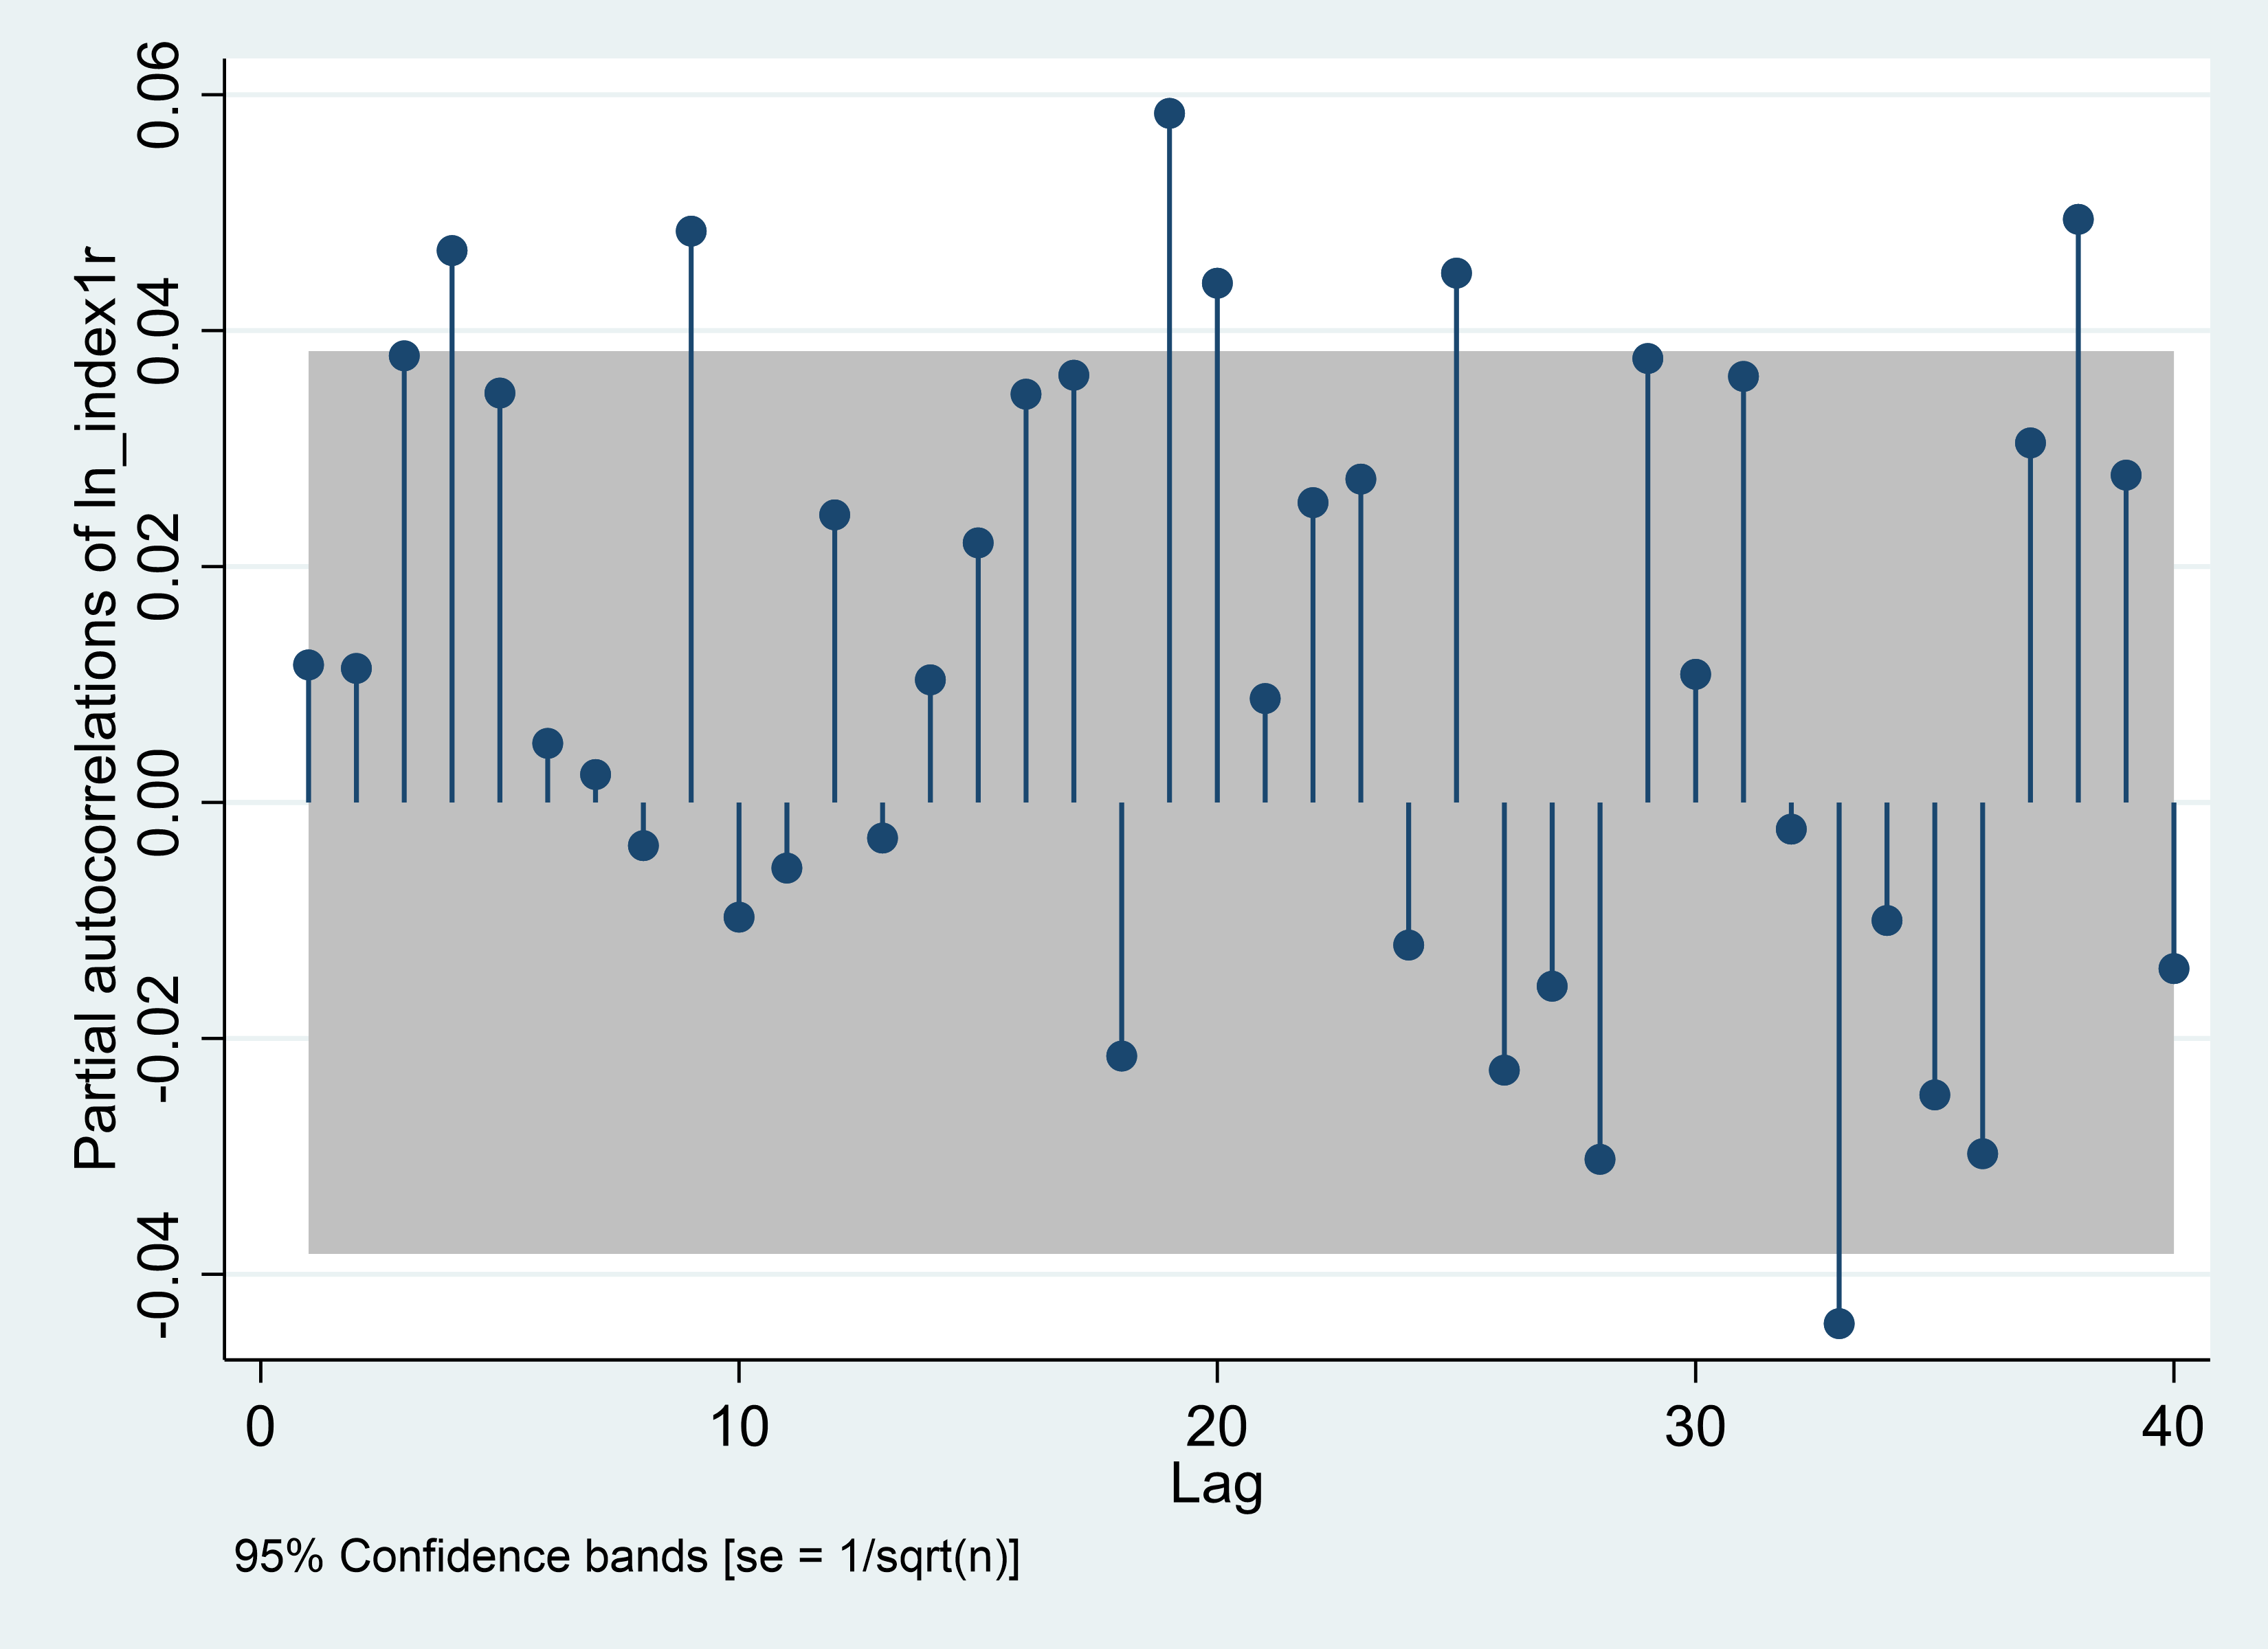
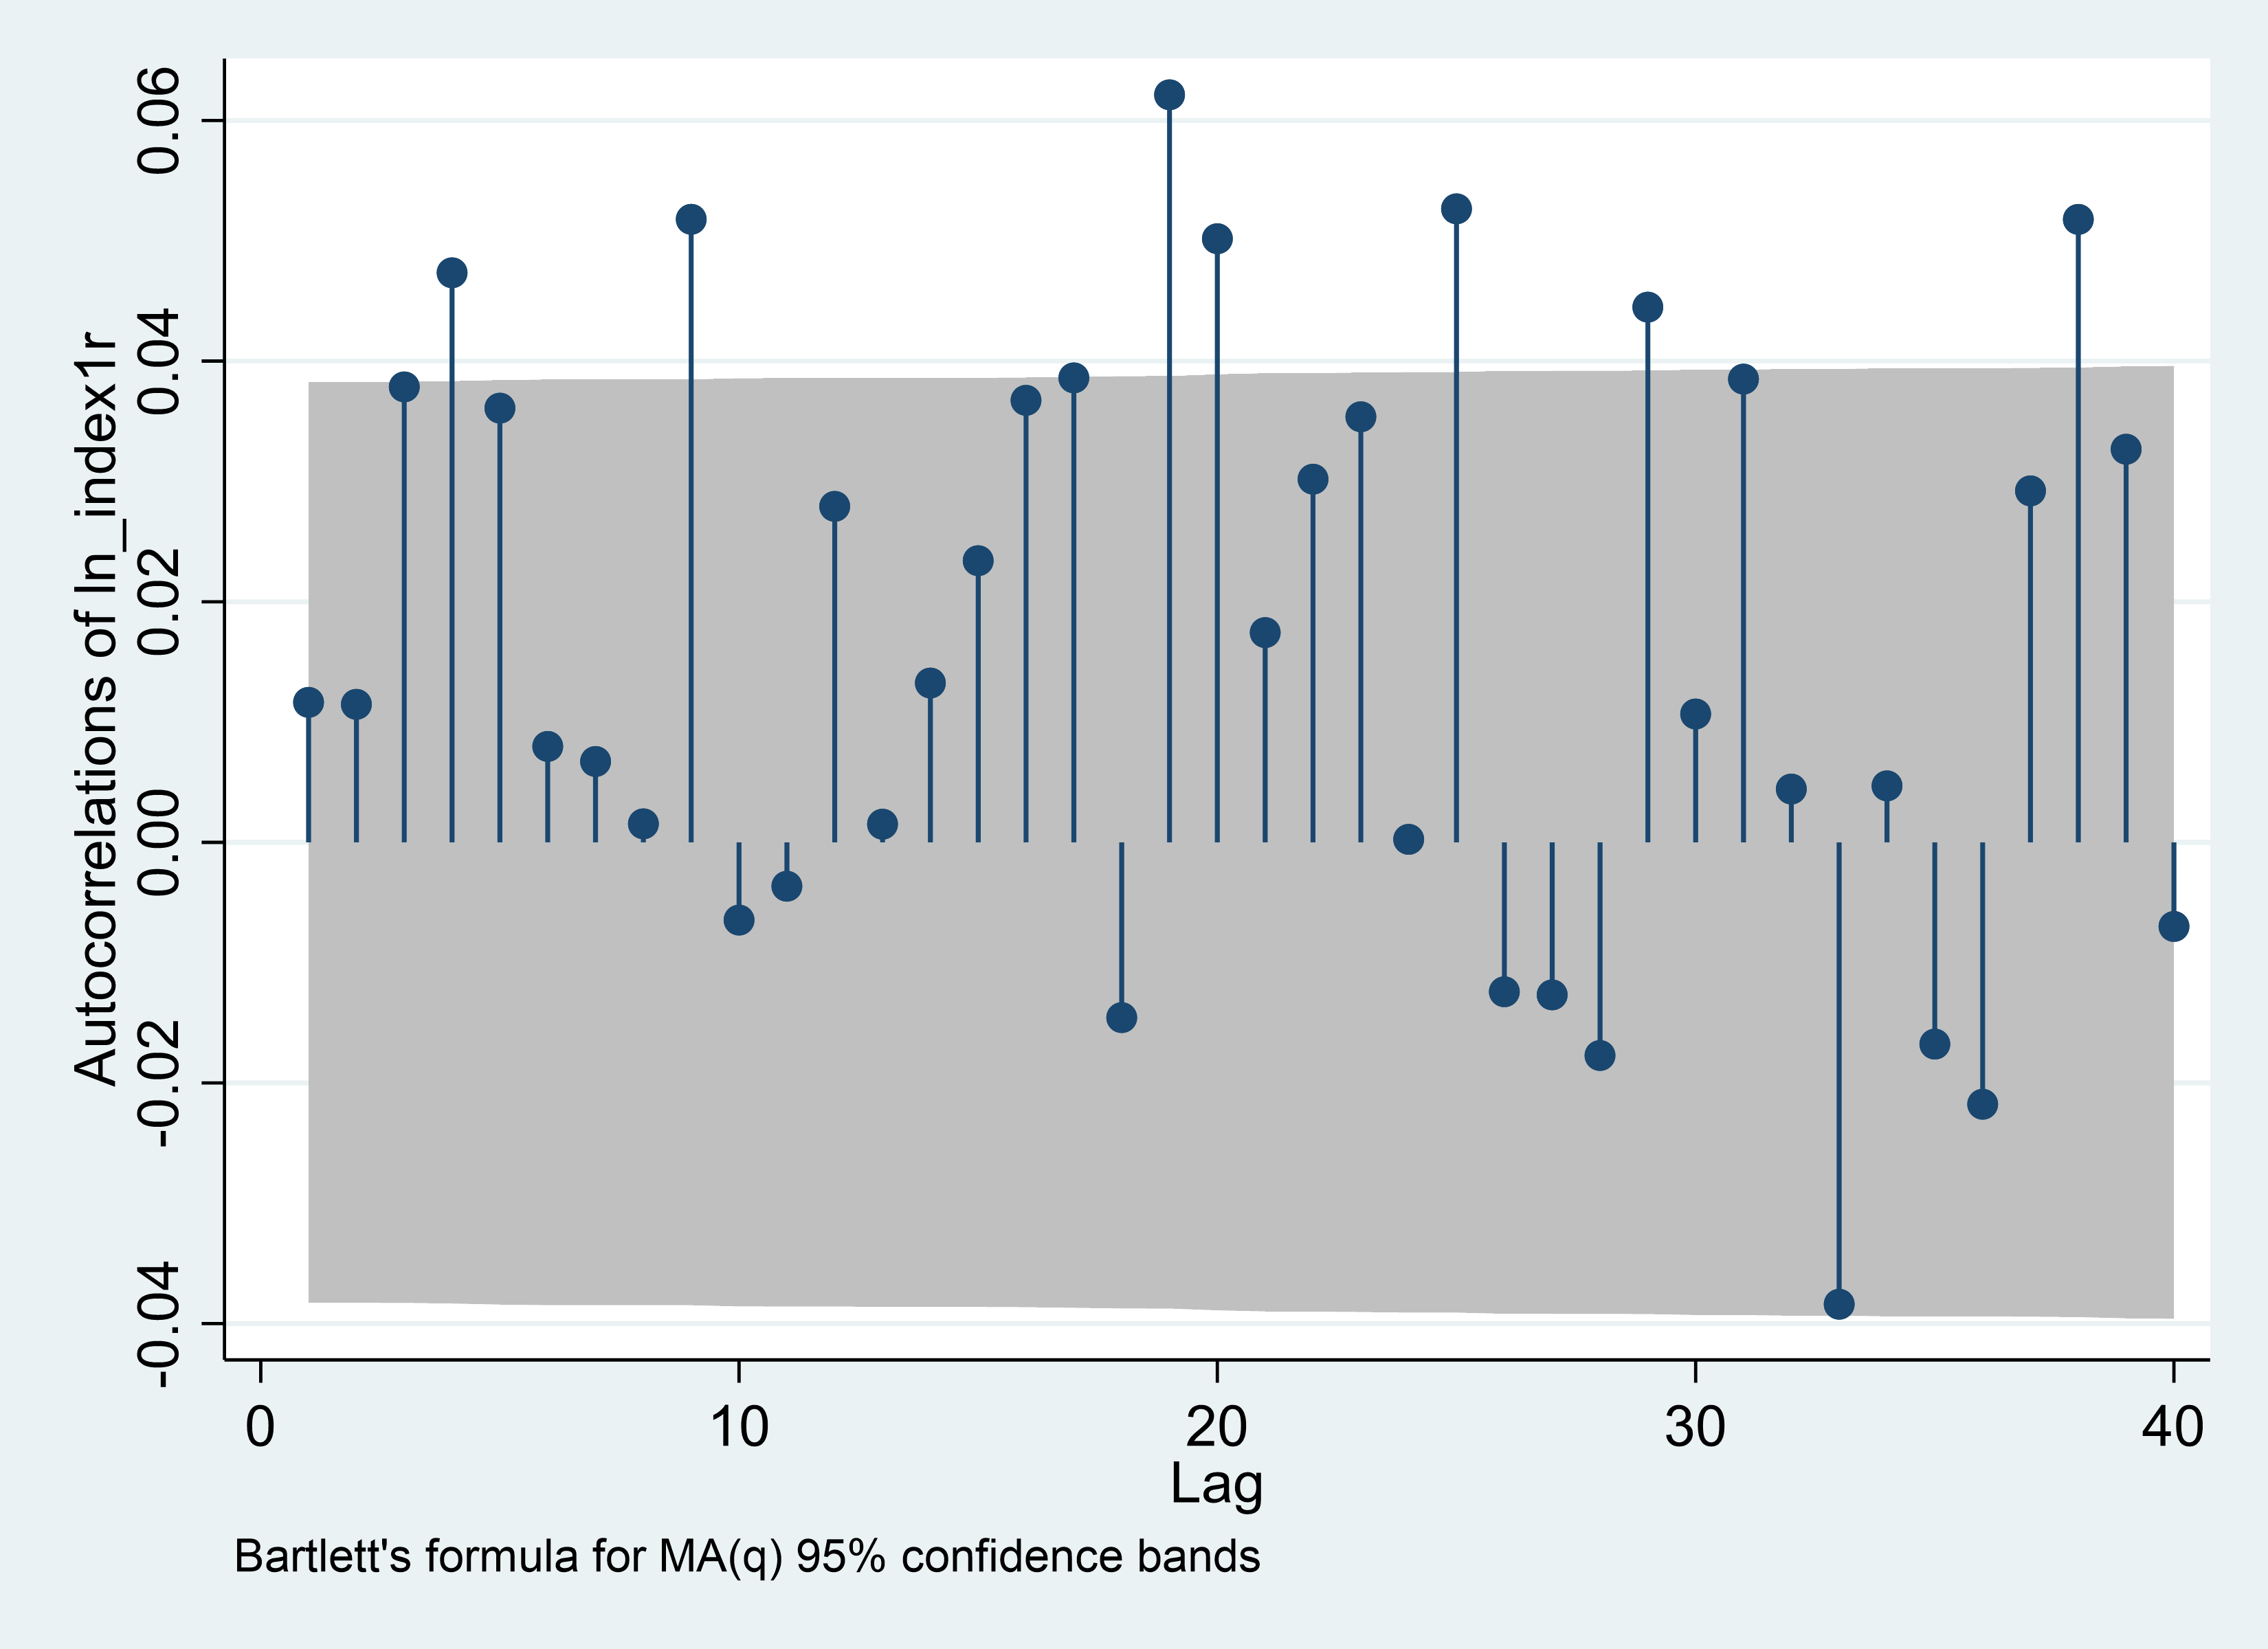
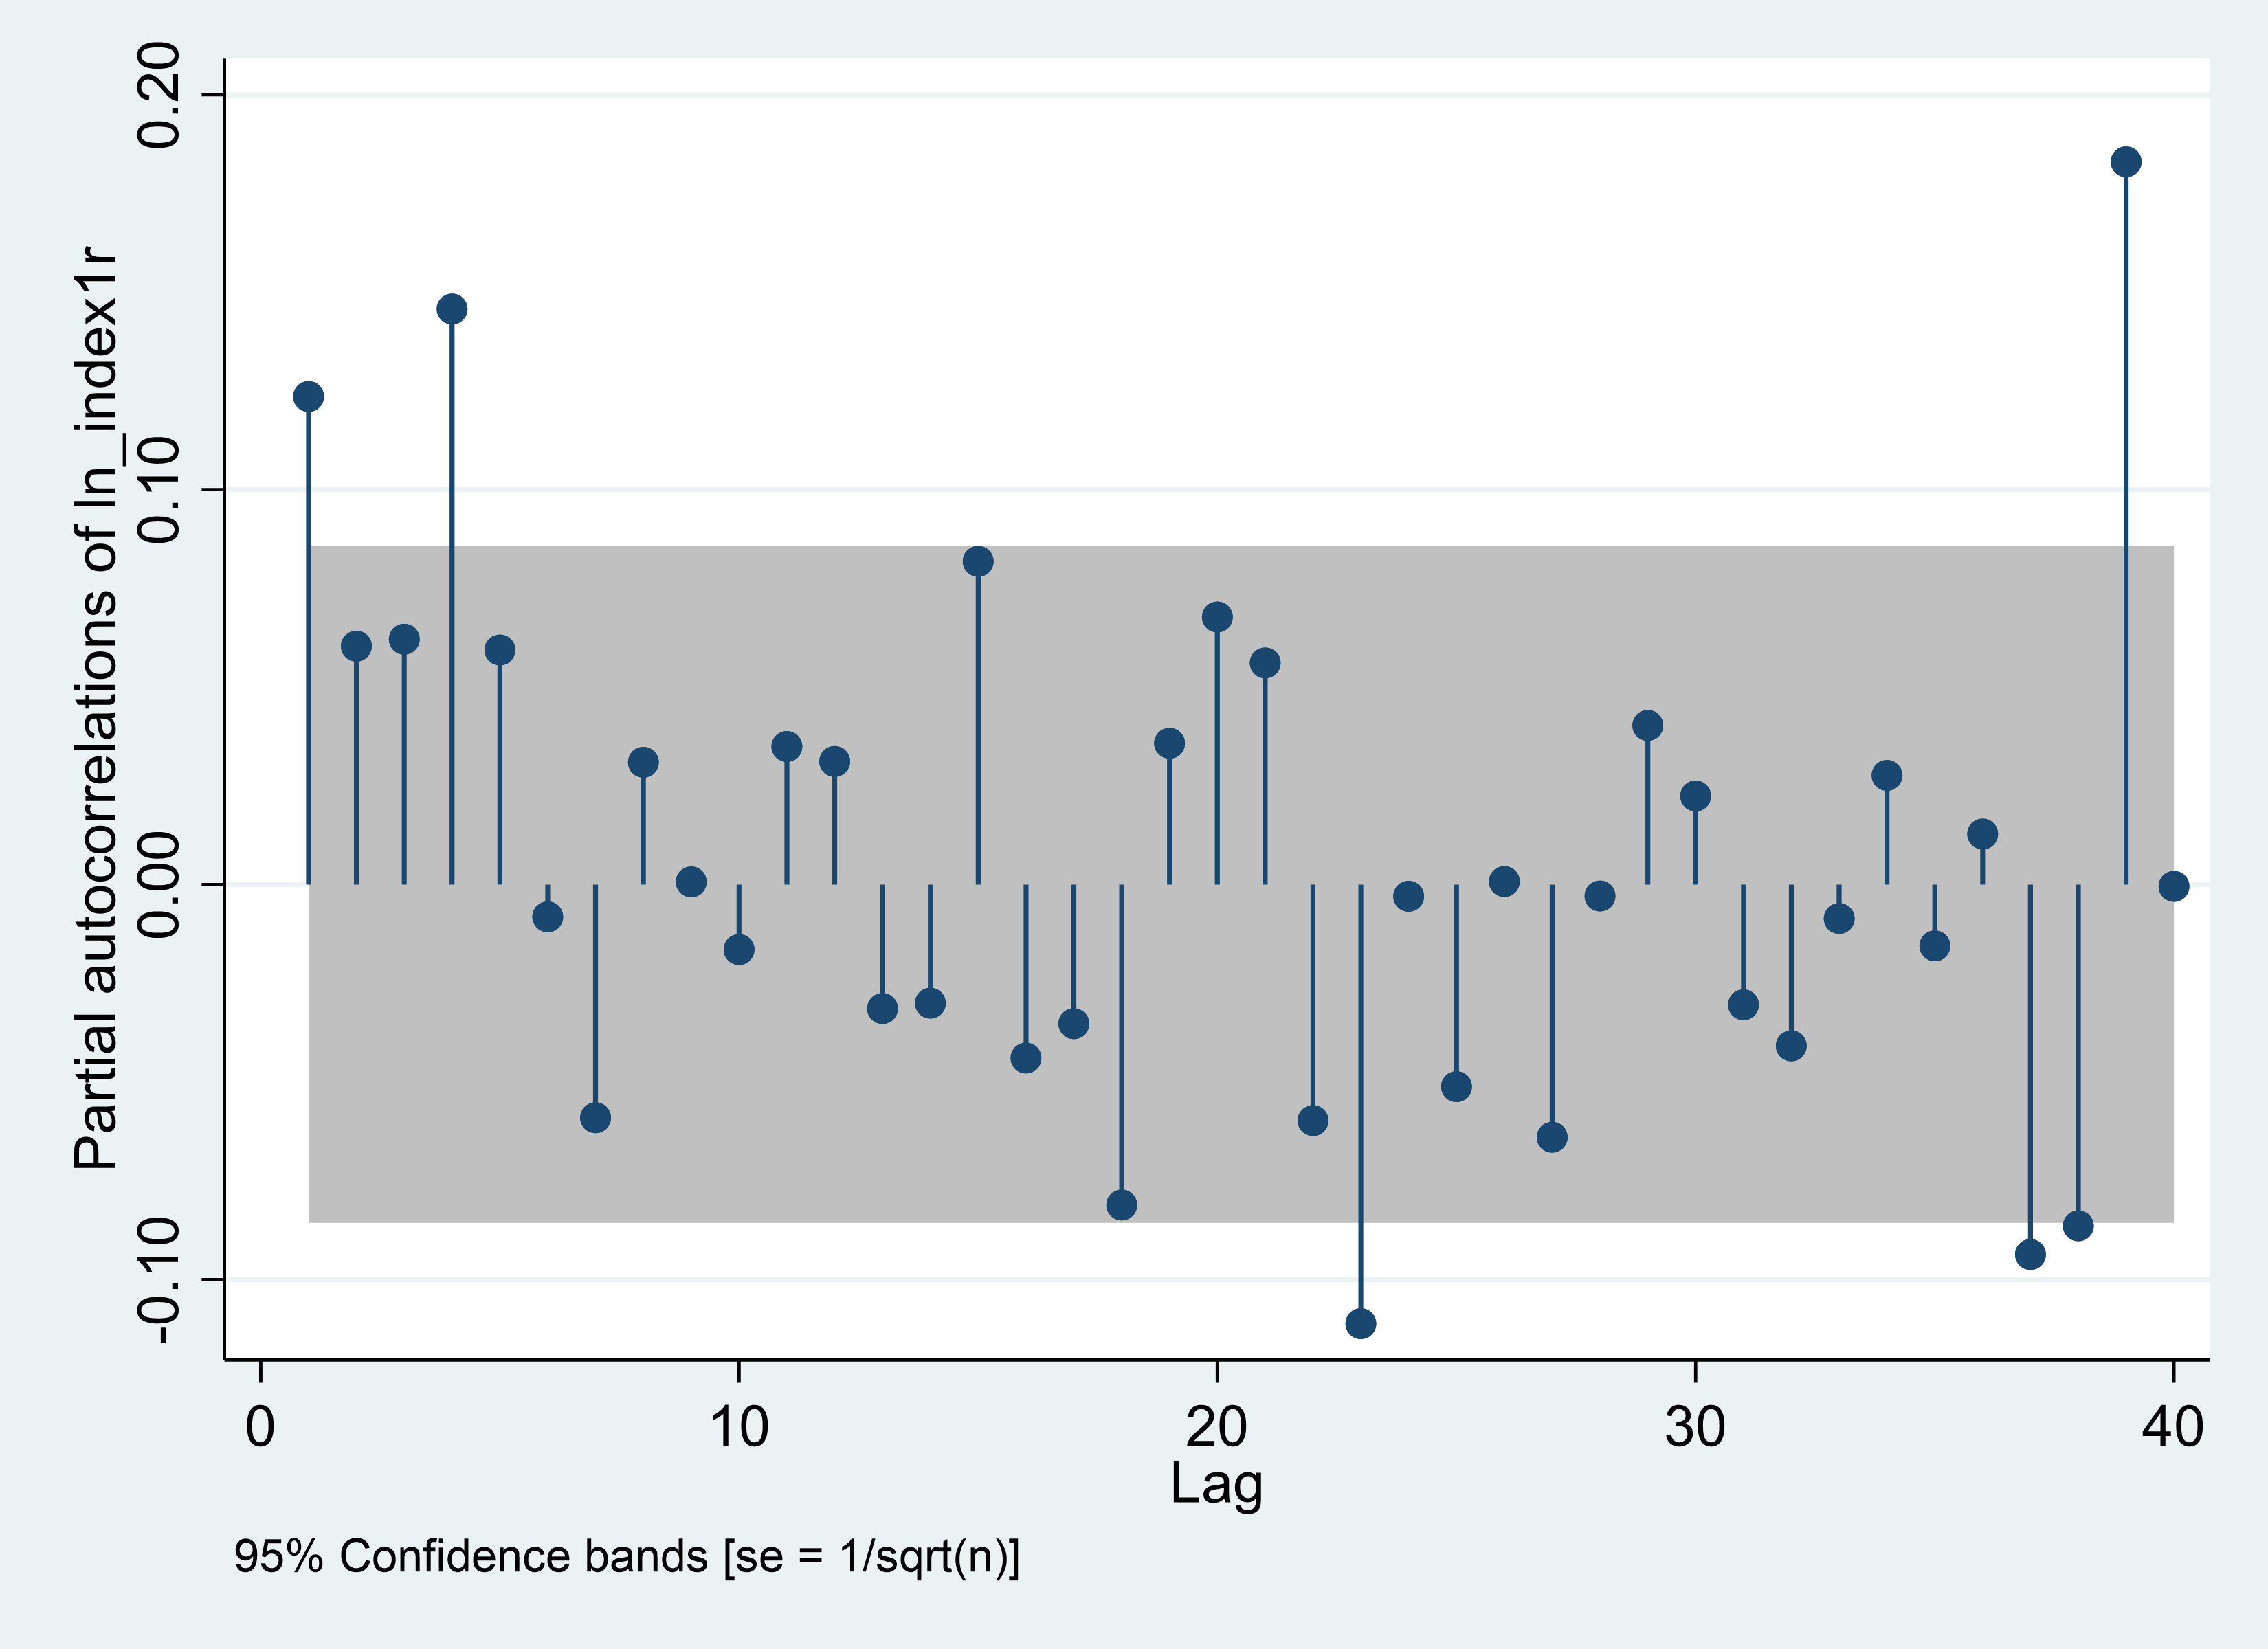
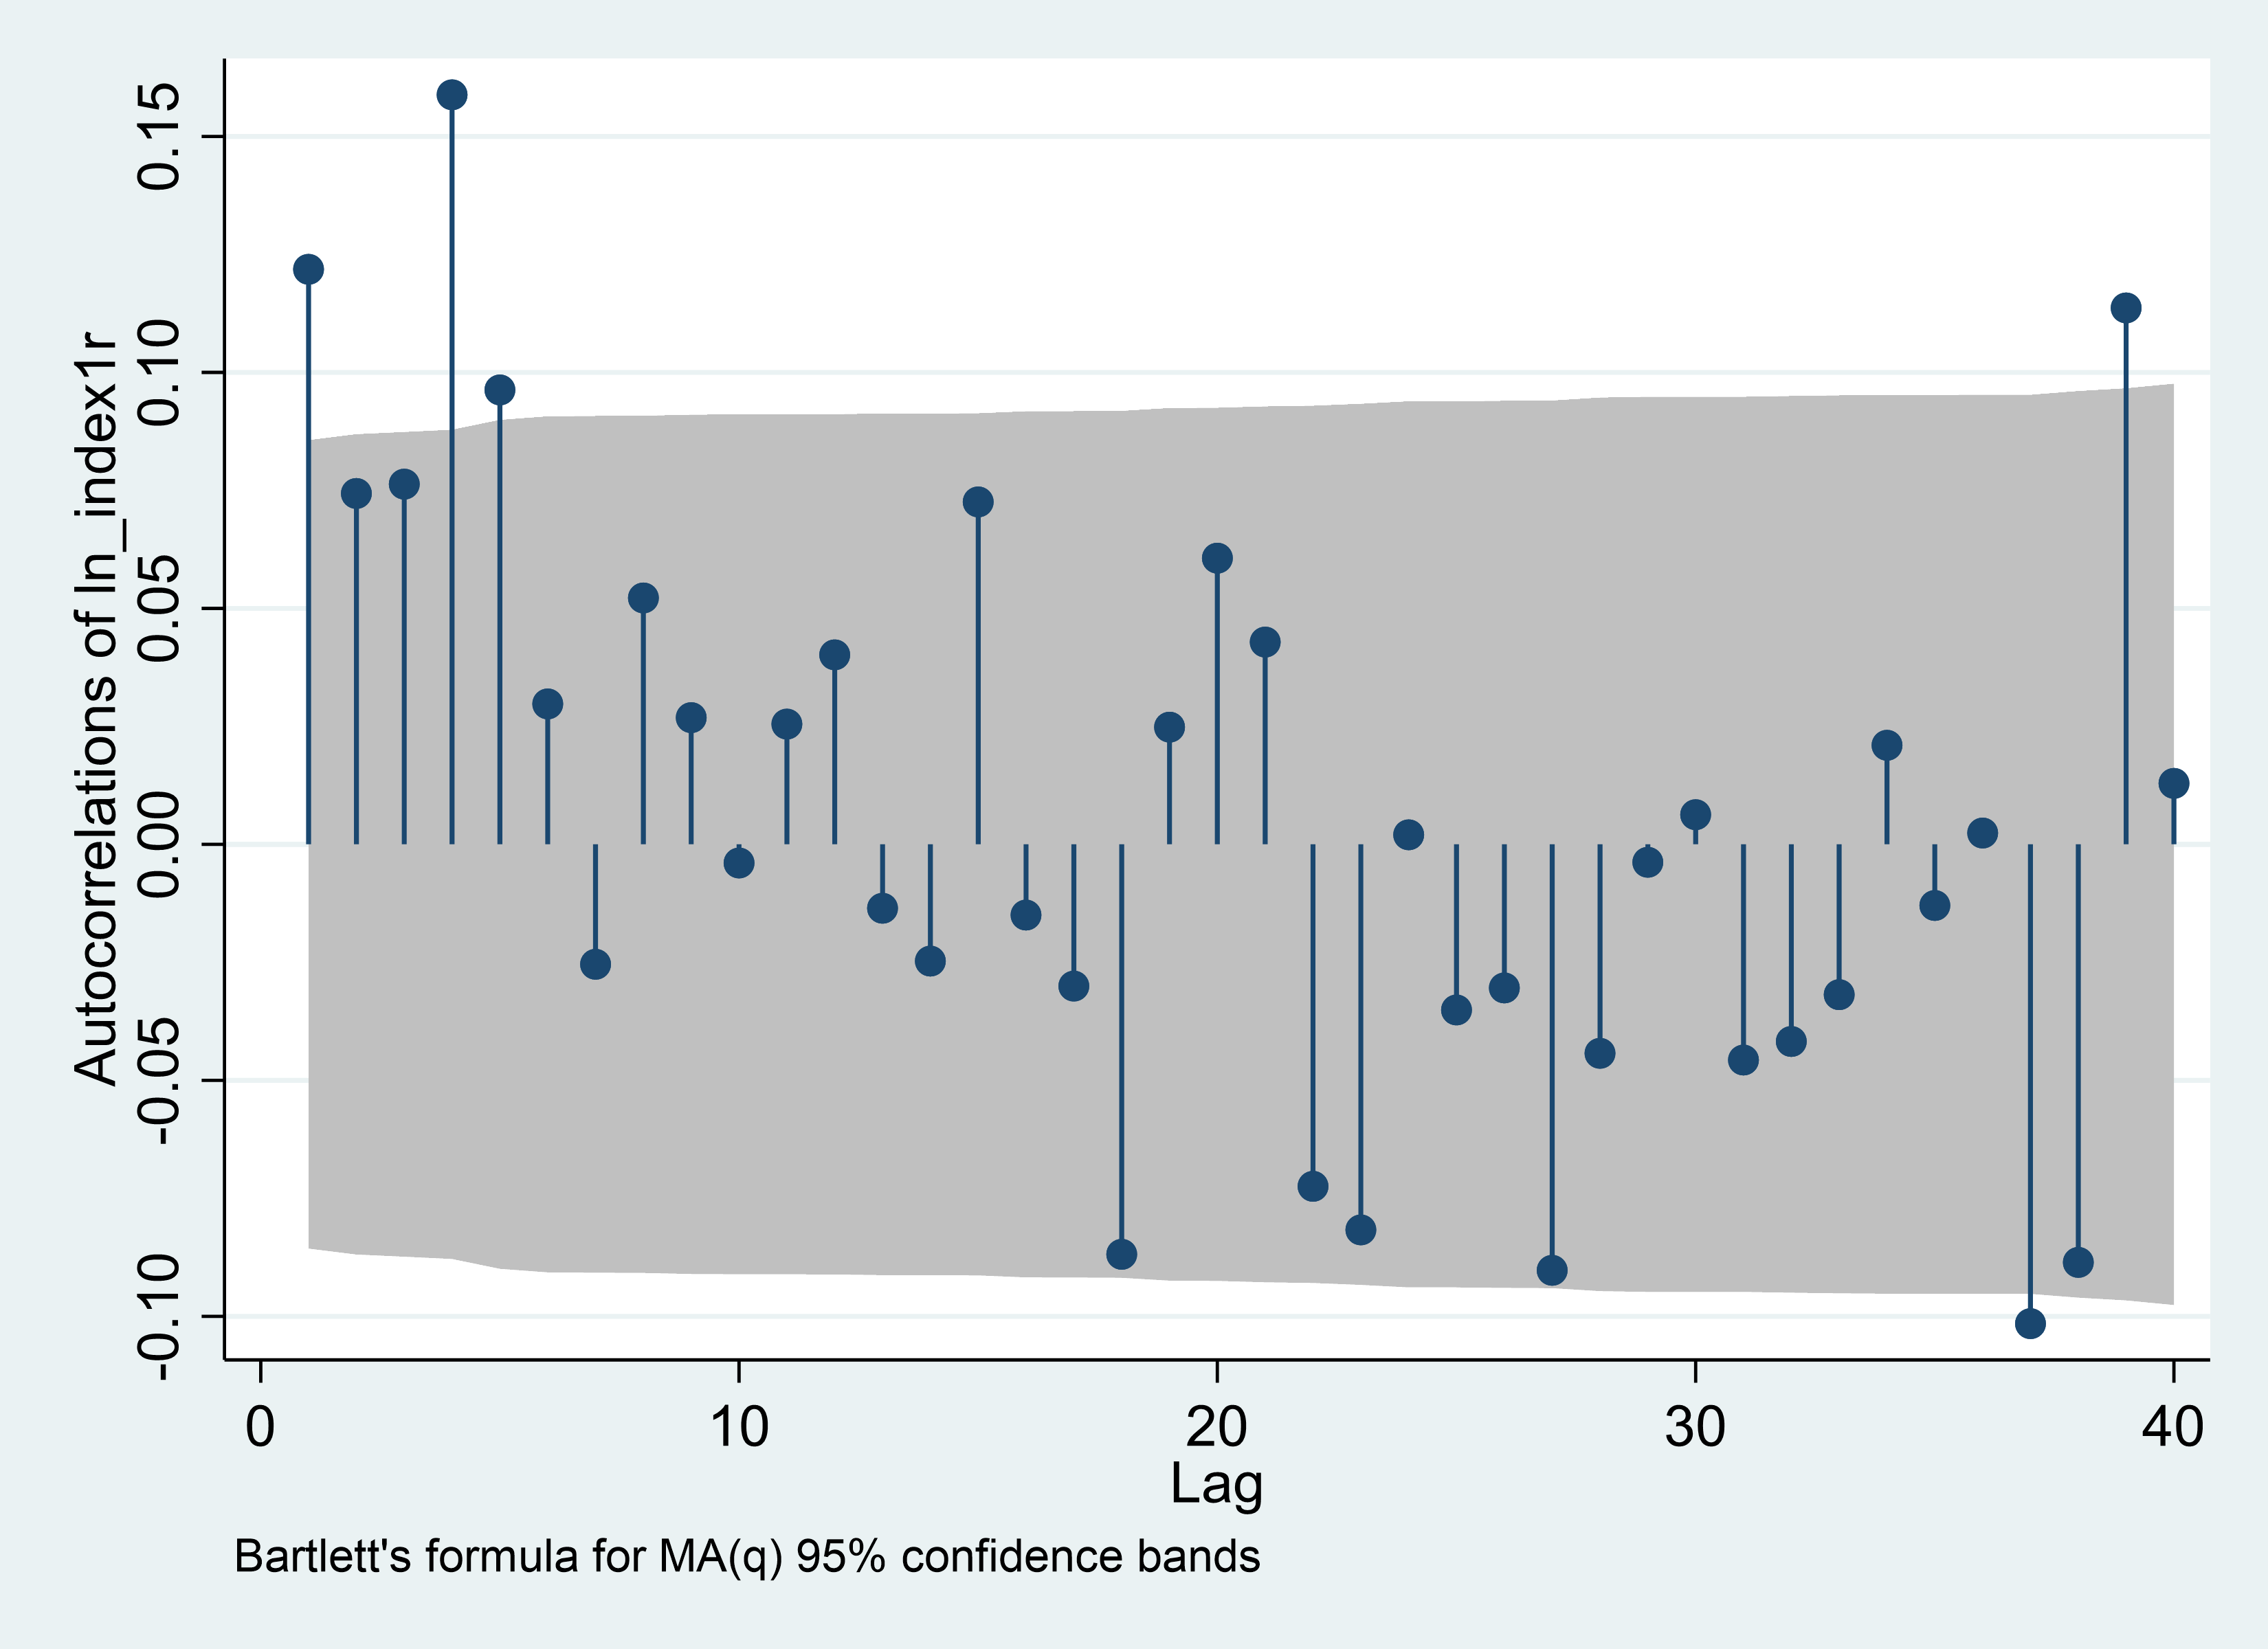
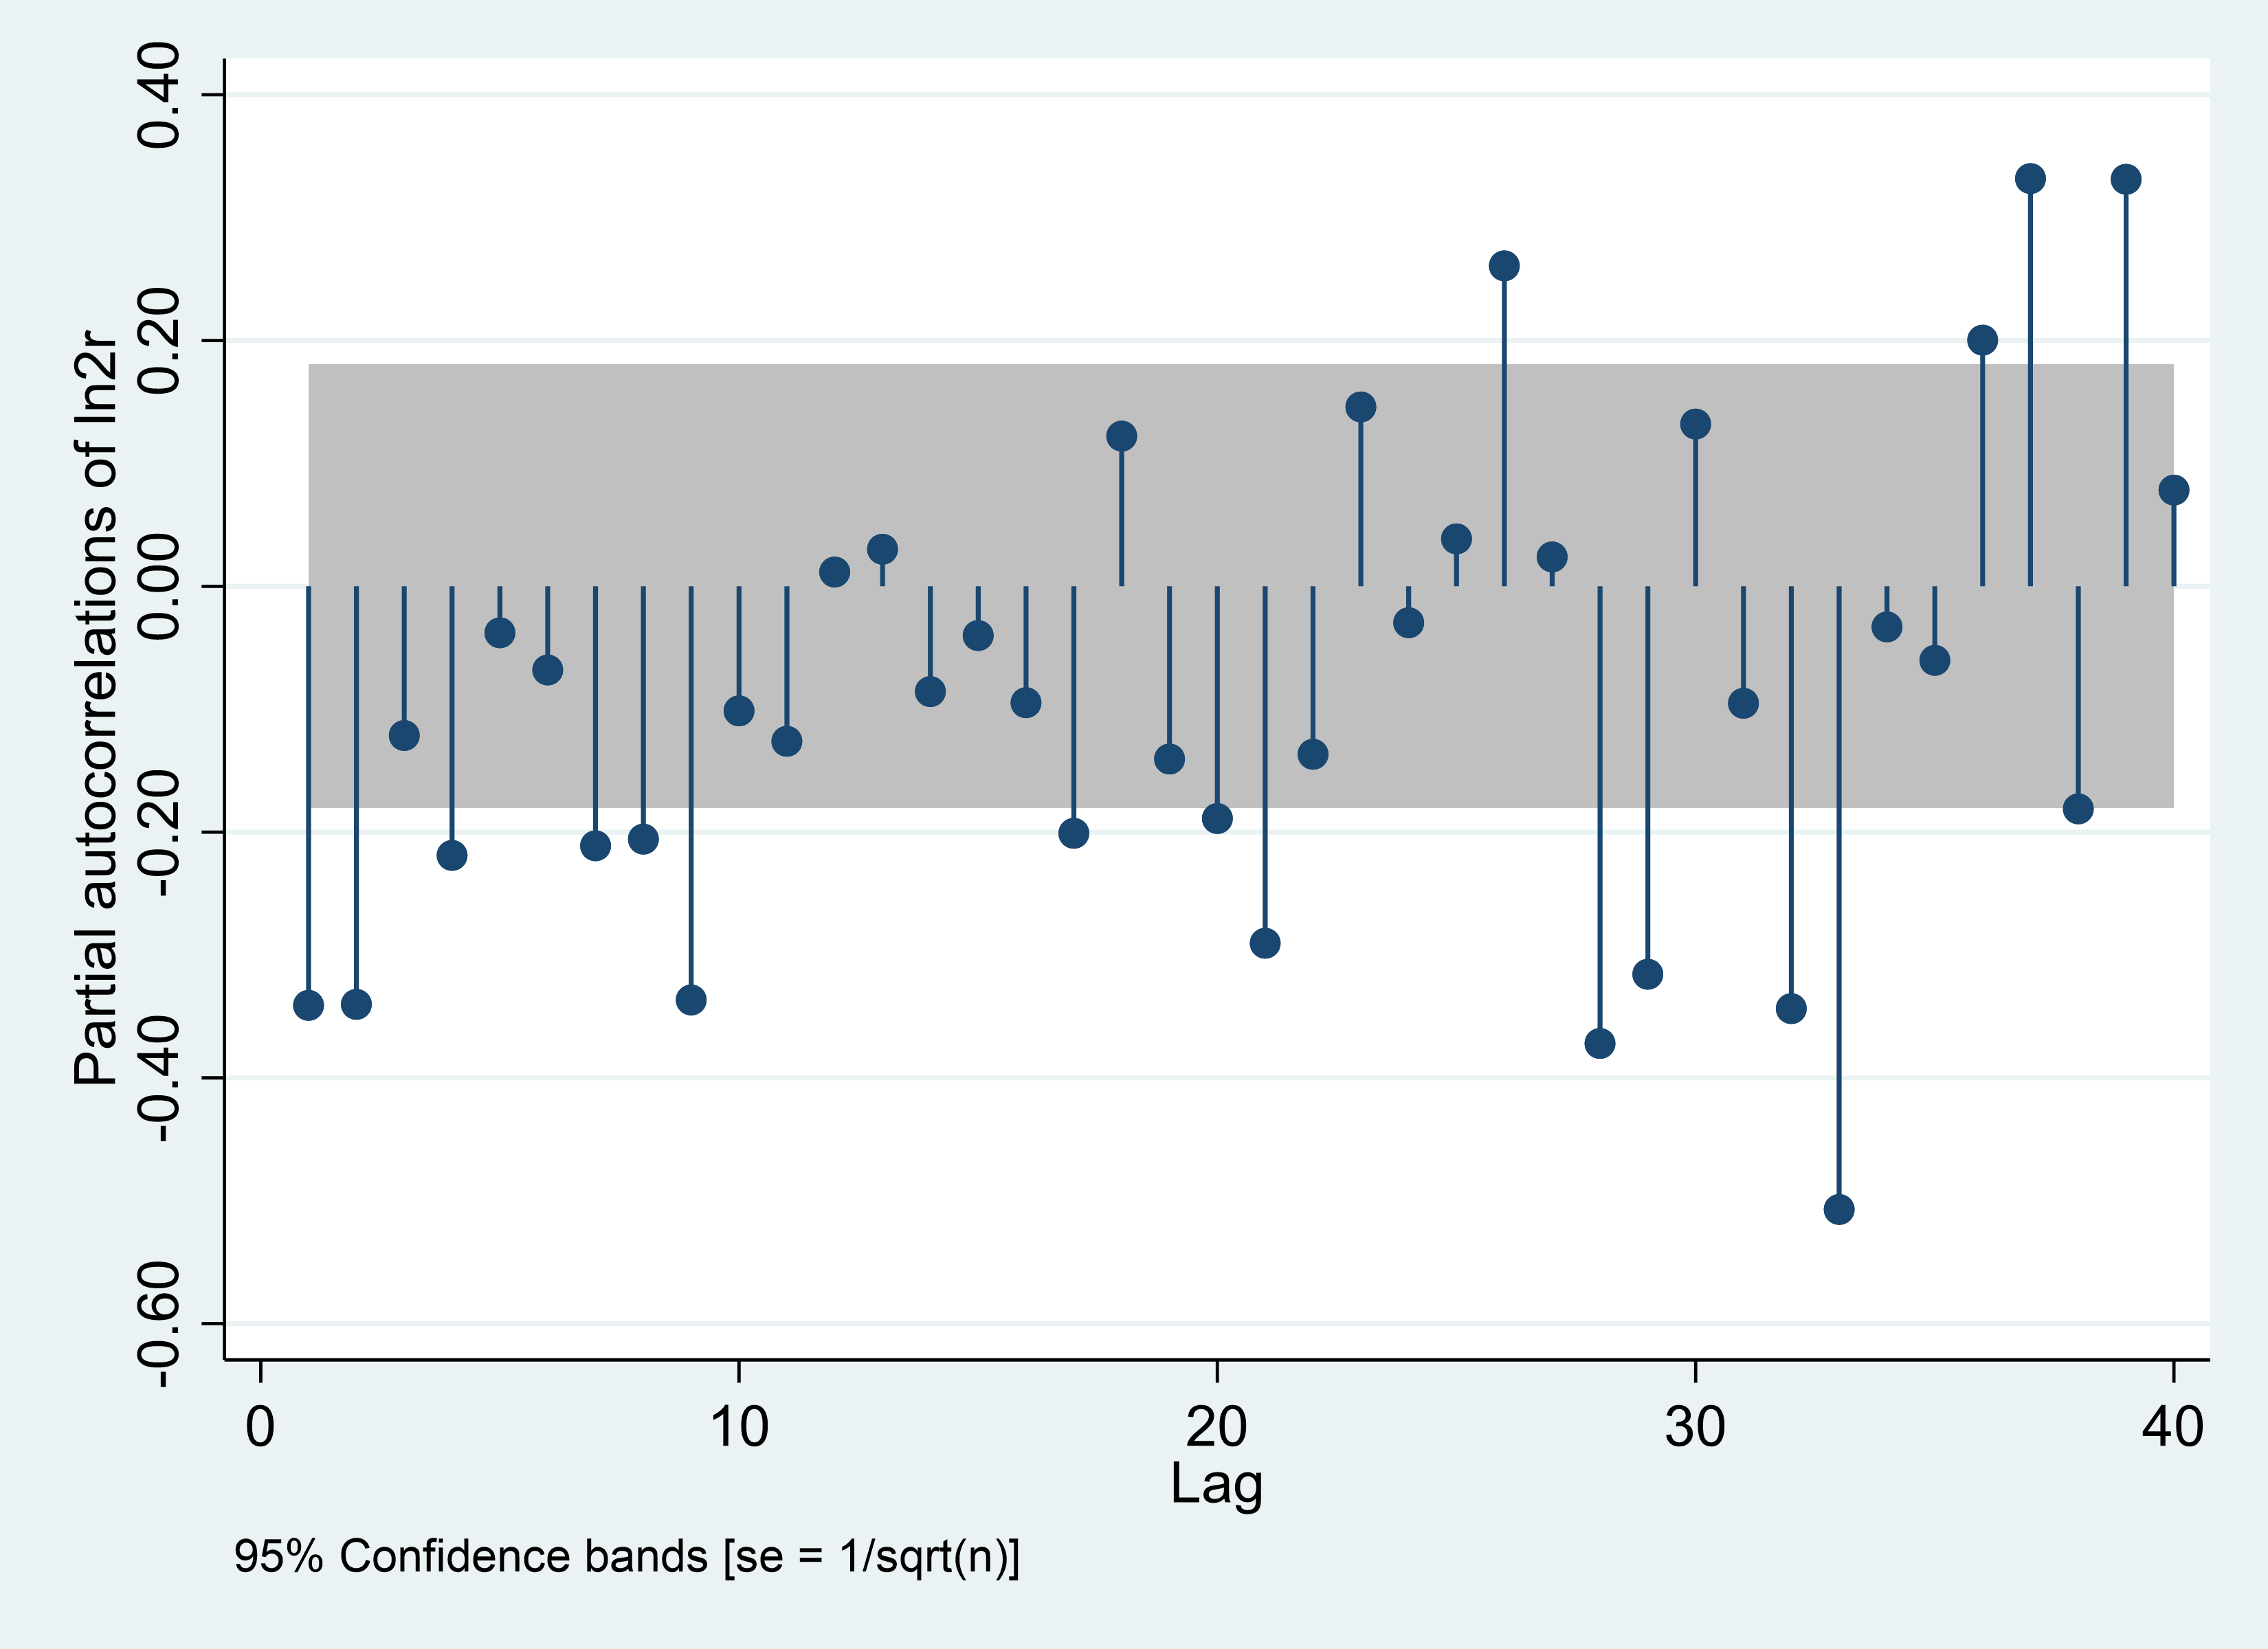
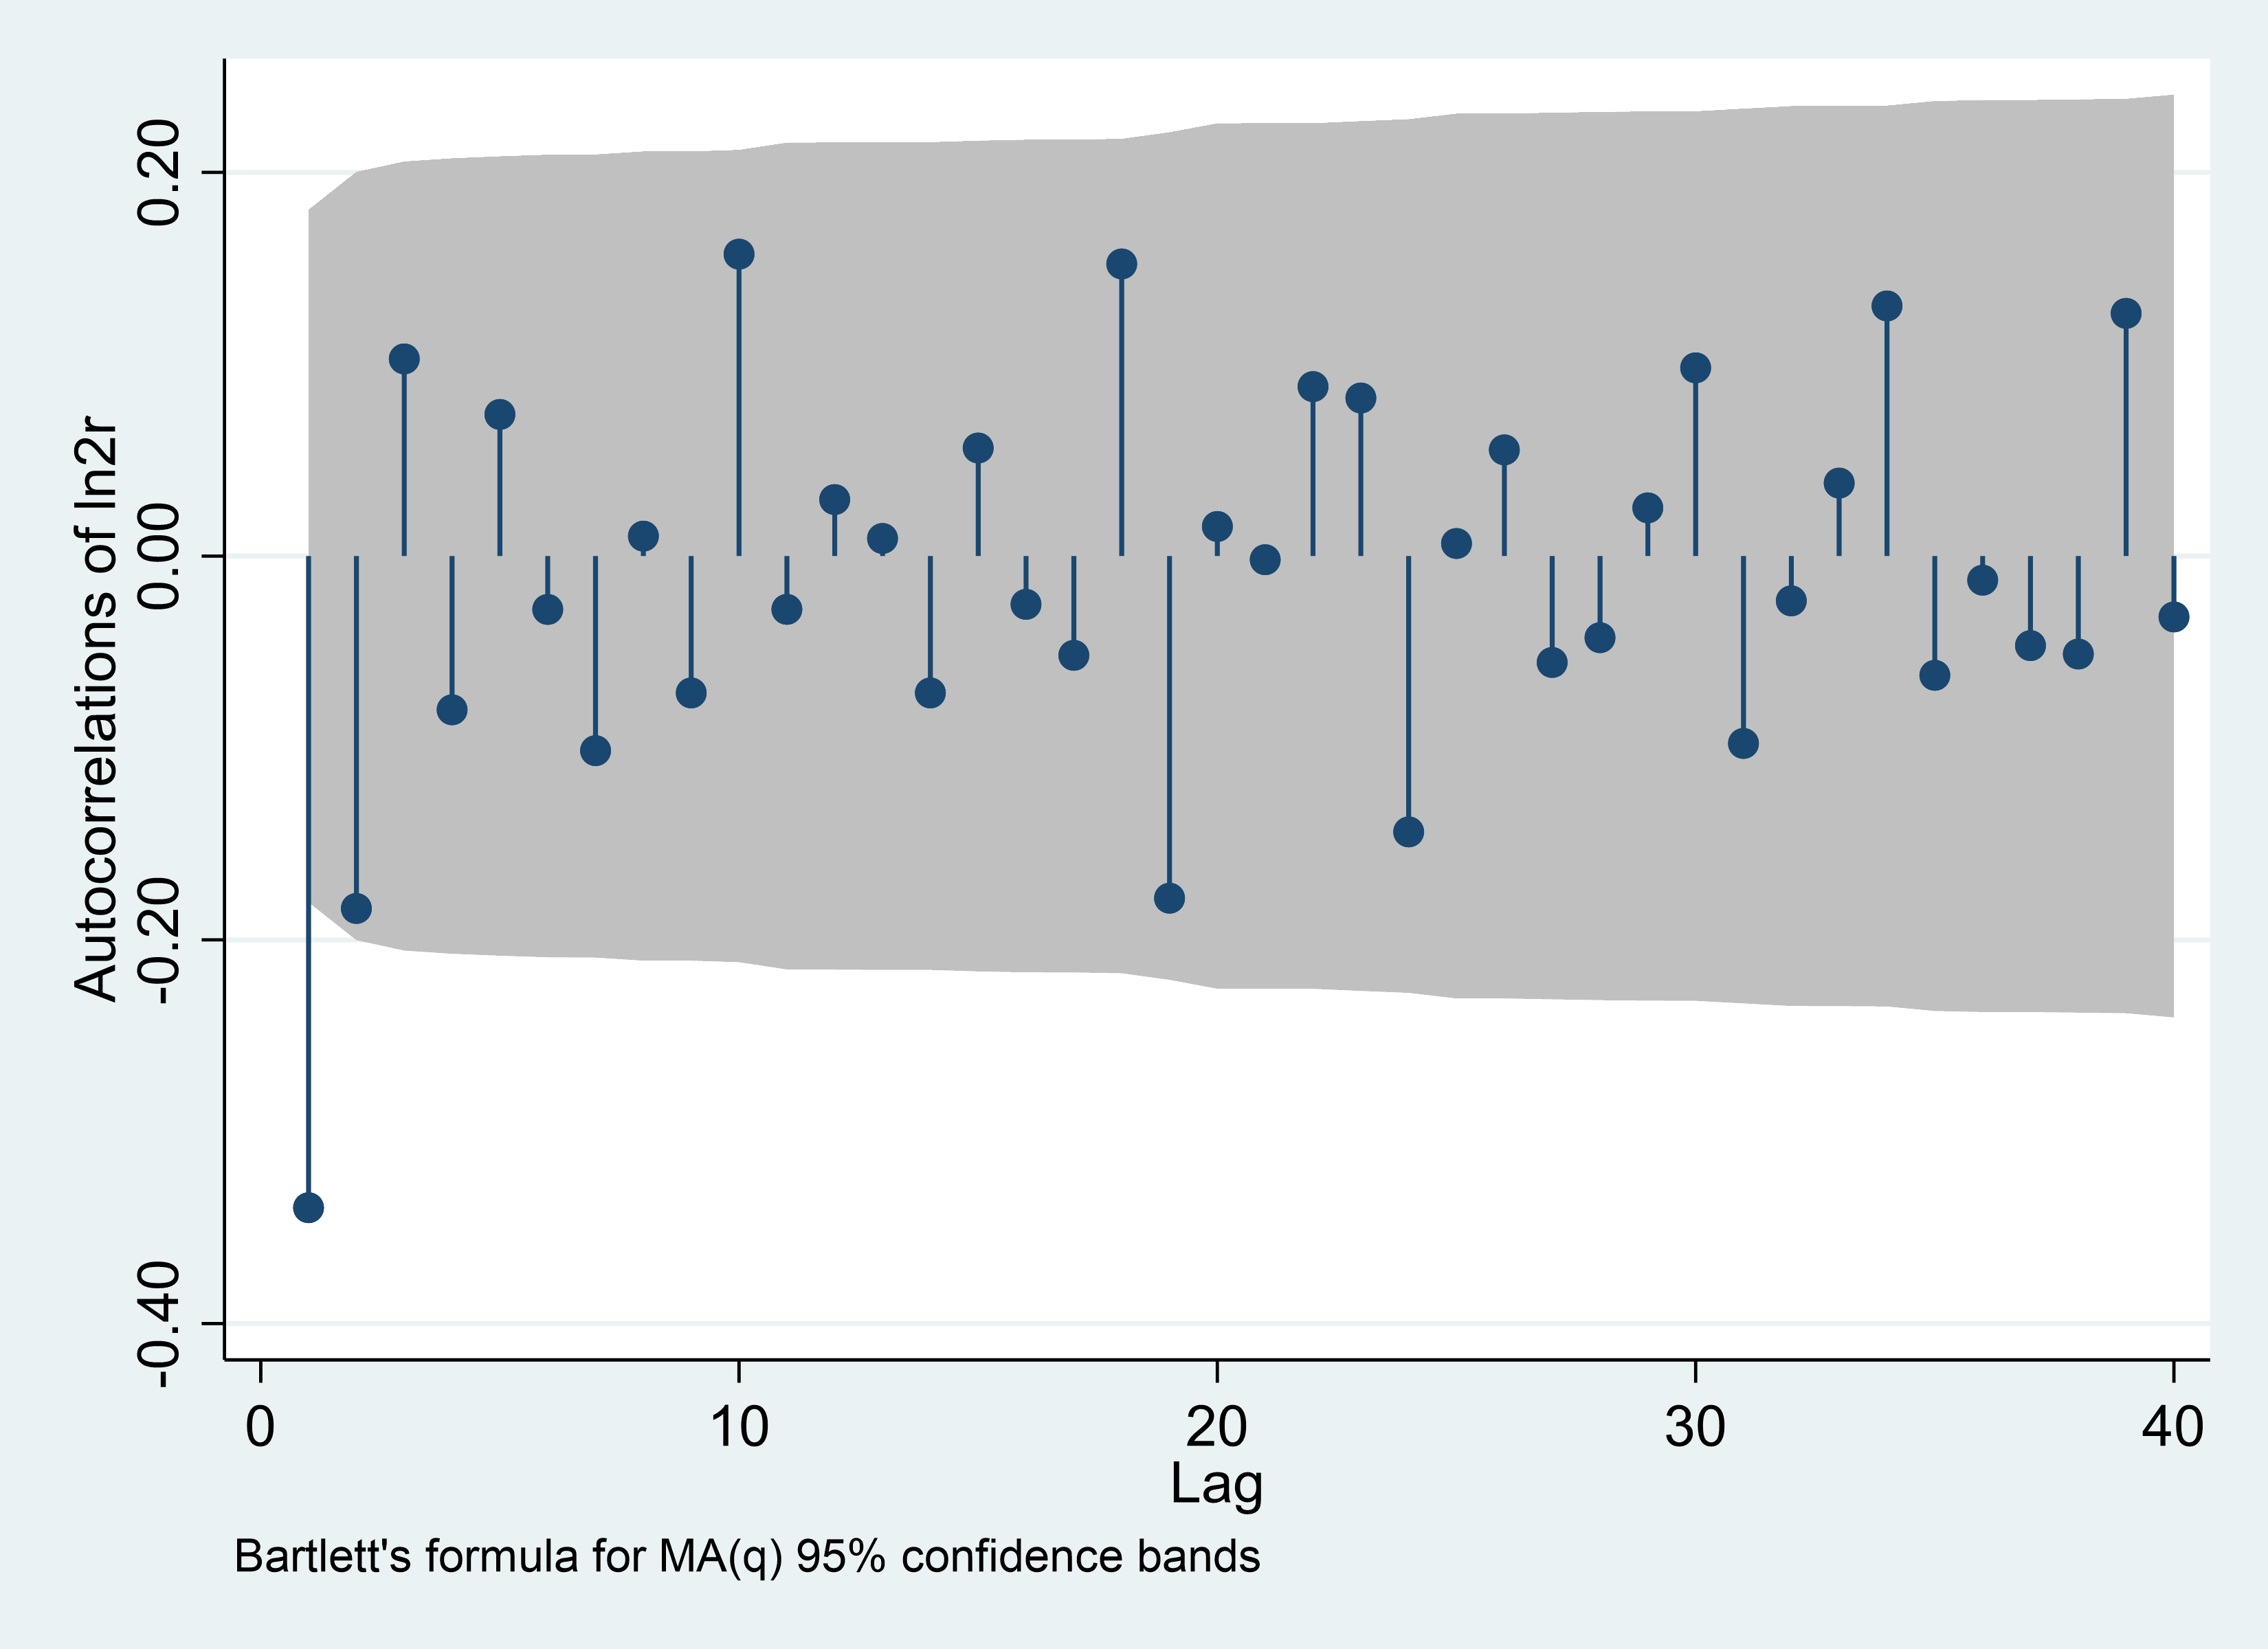
ACF is used to measure the correlation between a time series and itself at different lagged time points. In other words, it is able to measure the correlation between the current values in a time series and the values at past time points. PACF is a statistical tool used to analyze time series data. It is a variant of the Autocorrelation Function (ACF, Auto-Correlation Function), whose main role is to help determine the order of the autoregressive (AR) model in time series data.
From Figure 1, This paper can see that it shows the autocorrelation of the USD-RMB exchange rate, that is, its correlation with its own lagged value. In this paper, we use it to test whether there is any periodicity or trend in the time series exchange rate data for the RMB and US dollar. From these images, it can be seen that the autocorrelation coefficients of lag 1 and lag 2 are both significantly positive, indicating that the variables have positive persistence, i.e., higher or lower values tend to persist for a period of time. The autocorrelation coefficients of lag 3 and lag 4 are both significantly negative, indicating that the variables have inverse volatility, which reflects the fact that the dollar RMB exchange rate has cyclical changes.
Table 2: Residual test
Model | Portmanteau (Q) statistic | Prob > chi2 |
Daily-ARIMA(9,1,4) | 78.4352 | 0.0003 |
Weekly-ARIMA(4,1,5) | 52.1860 | 0.0939 |
Monthly-ARIMA(9,2,1) | 31.9069 | 0.8155 |
Table 2 shows the results of the residual test from which this study was able to draw some conclusions about the ARIMA model at different time frequencies:
1) In the early stages of a Covid-19 outbreak, the market faces great uncertainty and investors may seek safe havens, which usually leads to a rise in demand for US dollars (please see Figure 2). This may reduce short-term volatility in the USD-RMB exchange rate., causing RMB to depreciate relative to USD.
Figure 2: Actual value and fitted value, daily |
Photo credit: Original |
2) The outbreak of the epidemic has led to a slowdown in trade and business activities as economic activities around the world are restricted. This economic downturn may affect the exchange rate as a shrinking economy leads to lower demand for the currencies of exporting countries, which in turn affects the exchange rate movement (please see Figure 3).
Figure 3: Actual value and fitted value, weekly |
Photo credit: Original |
3) In the face of market turmoil, governments and central banks intervene to stabilize exchange rates and economies. Government intervention may affect the exchange rate by intervening in the foreign exchange market or implementing monetary policy.
Figure 4: Actual value and fitted value, monthly |
Photo credit: Original |
4) During an epidemic, the international flow of capital is also affected, which leads to investors becoming more cautious, resulting in a decrease in cross-border financial flows, which also affects the exchange rate trend, as inflows and outflows of capital usually affect the value of a country's currency (please See Figure 4).
4. Discussion
A comparison with the existing literature shows that: both this paper and some of the existing literature suggest that the XKP outbreak has had an impact on the US dollar-RMB exchange rate, but that this impact usually fluctuates back and forth within a range. In addition, this study also notes that the outbreak triggered economic uncertainty on a global scale, leading to fluctuations in investor sentiment and changes in capital flows, which in turn affected exchange rate volatility.
Hakan in his study used a structural vector self-review model that utilizes annual rates of change to measure weekly economic activity, exchange rates, and policy rates [8]. Alqaralleh and Caneoa in their study used an underlying wavelet-Copula-GARCH approach to investigate the contagion effect among global stock markets during the Covid-19 epidemic [10]. Whereas Shari et al. used a wavelet-based approach to study the relationship between the uncertainties caused by the epidemic and the oil price and stock market [11].
And compared to the existing literature, there are some differences in the research approach taken in this paper. This paper discusses the exchange rate data in more depth and at different time frequencies, thereby comprehensively capturing the epidemic's impact on the exchange rate.
This paper emphasizes that exchange rate volatility is influenced by multiple factors, including economic activity, investor sentiment, and government policy intervention. This serves as a reminder of the need to synthesize different factors when studying exchange rate volatility to obtain more accurate conclusions. The analysis of exchange rate volatility in this paper reveals that while exchange rates may fluctuate in the short term due to market sentiment and capital flows, exchange rate volatility in the long term may be influenced by a wider range of economic factors. This has important implications for investors, who need to make trade-offs between the short and long term.
For policymakers, governments should be prepared to plan for market uncertainty, including intervening in the foreign exchange market, stabilizing the financial system, and formulating targeted monetary policies. Policymakers could consider encouraging rational international flows of capital and avoiding excessive intervention to maintain a stable investment environment.
Investors may consider diversifying their investment portfolios to minimize the influence of fluctuations in a single currency market on their portfolios. In addition, investors should consider the impact of currency markets fluctuations over immediate and extended periods to develop strategies that accommodate different investment objectives.
5. Conclusion
The paper's objective is to inspect how the Covid-19 epidemic has changed the U.S. dollar and RMB exchange rates, using time-series analysis to uncover both short-term and long-term impacts. By analyzing and processing the data, the following conclusions were drawn:
1) The global economic uncertainty triggered by the Covid-19 epidemic, including the downturn in economic activity, fluctuations in investor sentiment, and changes in government policy, has had an impact on the exchange rate. This paper highlights that exchange rate volatility is a complex outcome that requires a combination of factors to be considered.
2) In the early stages of COVID-19, the market faced great uncertainty, and investors' search for risk aversion led to a rise in demand for the U.S. dollar. This may lead to immediate periods fluctuations in the RMB-USD exchange rate, making the RMB depreciate relatively.
3) The Epidemic has led to a slowdown in economic activities globally, limiting trade and business activities. The economic downturn may reduce demand for the currencies of exporting countries, which in turn may affect exchange rate movements.
The research methodology of this paper provides an in-depth analysis of currency markets data at different time frequencies to capture the influence of the epidemic on the exchange rate. The study sheds light on the need to consider a variety of factors when analyzing exchange rate volatility and provides valuable guidance for policymakers and investors.
References
[1]. Benzid, L., & Chebbi, K. (2020). The impact of COVID-19 on exchange rate volatility: Evidence through GARCH model. Available at SSRN 3612141.
[2]. Sharma, S., Yadav, M. P., & Jha, B. (2022). Impact of the COVID-19 outbreak on the currency exchanges of selected countries. International Journal of Sociotechnology and Knowledge Development (IJSKD), 14(2), 73-91.
[3]. Jamal, A., & Bhat, M. A. (2022). COVID-19 pandemic and the exchange rate movements: evidence from six major COVID-19 hot spots. Future Business Journal, 8(1), 17.
[4]. Beckmann, J., & Czudaj, R. L. (2022). Exchange rate expectation, abnormal returns, and the COVID-19 pandemic. Journal of Economic Behavior & Organization, 196, 1-25.
[5]. Aquilante, T., Di Pace, F., & Masolo, R. M. (2022). Exchange-rate and news: Evidence from the COVID pandemic. Economics letters, 213, 110390.
[6]. Hofmann, B., Shim, I., & Shin, H. S. (2021). Emerging market economy exchange rates and local currency bond markets amid the Covid-19 pandemic. Available at SSRN 3761875.
[7]. Lau, L. J. (2020). The Impacts of the Trade War and the COVID-19 Epidemic on China-US Economic Relations. China Review, 20(4), 1-38.
[8]. Yilmazkuday, H. (2022). COVID-19 and exchange rates: Spillover effects of us monetary policy. Atlantic Economic Journal, 50(1-2), 67-84.
[9]. Exchange Rates, https://exchangerates.org.uk.
[10]. Alqaralleh, H., & Canepa, A. (2021). Evidence of stock market contagion during the COVID-19 pandemic: A Wavelet-Copula-GARCH approach. Journal of Risk and Financial Management, 14(7),329.
[11]. Sharif, A., Aloui, C., & Yarovaya, L. (2020). COVID-19 pandemic, oil prices, stock market, geopolitical risk and policy uncertainty nexus in the US economy: Fresh evidence from the wavelet-based approach. International review of financial analysis, 70, 101496.
Cite this article
Li,H. (2023). Consequences of COVID-19 for Currency Markets of US Dollar and RMB. Advances in Economics, Management and Political Sciences,61,156-164.
Data availability
The datasets used and/or analyzed during the current study will be available from the authors upon reasonable request.
Disclaimer/Publisher's Note
The statements, opinions and data contained in all publications are solely those of the individual author(s) and contributor(s) and not of EWA Publishing and/or the editor(s). EWA Publishing and/or the editor(s) disclaim responsibility for any injury to people or property resulting from any ideas, methods, instructions or products referred to in the content.
About volume
Volume title: Proceedings of the 2nd International Conference on Financial Technology and Business Analysis
© 2024 by the author(s). Licensee EWA Publishing, Oxford, UK. This article is an open access article distributed under the terms and
conditions of the Creative Commons Attribution (CC BY) license. Authors who
publish this series agree to the following terms:
1. Authors retain copyright and grant the series right of first publication with the work simultaneously licensed under a Creative Commons
Attribution License that allows others to share the work with an acknowledgment of the work's authorship and initial publication in this
series.
2. Authors are able to enter into separate, additional contractual arrangements for the non-exclusive distribution of the series's published
version of the work (e.g., post it to an institutional repository or publish it in a book), with an acknowledgment of its initial
publication in this series.
3. Authors are permitted and encouraged to post their work online (e.g., in institutional repositories or on their website) prior to and
during the submission process, as it can lead to productive exchanges, as well as earlier and greater citation of published work (See
Open access policy for details).
References
[1]. Benzid, L., & Chebbi, K. (2020). The impact of COVID-19 on exchange rate volatility: Evidence through GARCH model. Available at SSRN 3612141.
[2]. Sharma, S., Yadav, M. P., & Jha, B. (2022). Impact of the COVID-19 outbreak on the currency exchanges of selected countries. International Journal of Sociotechnology and Knowledge Development (IJSKD), 14(2), 73-91.
[3]. Jamal, A., & Bhat, M. A. (2022). COVID-19 pandemic and the exchange rate movements: evidence from six major COVID-19 hot spots. Future Business Journal, 8(1), 17.
[4]. Beckmann, J., & Czudaj, R. L. (2022). Exchange rate expectation, abnormal returns, and the COVID-19 pandemic. Journal of Economic Behavior & Organization, 196, 1-25.
[5]. Aquilante, T., Di Pace, F., & Masolo, R. M. (2022). Exchange-rate and news: Evidence from the COVID pandemic. Economics letters, 213, 110390.
[6]. Hofmann, B., Shim, I., & Shin, H. S. (2021). Emerging market economy exchange rates and local currency bond markets amid the Covid-19 pandemic. Available at SSRN 3761875.
[7]. Lau, L. J. (2020). The Impacts of the Trade War and the COVID-19 Epidemic on China-US Economic Relations. China Review, 20(4), 1-38.
[8]. Yilmazkuday, H. (2022). COVID-19 and exchange rates: Spillover effects of us monetary policy. Atlantic Economic Journal, 50(1-2), 67-84.
[9]. Exchange Rates, https://exchangerates.org.uk.
[10]. Alqaralleh, H., & Canepa, A. (2021). Evidence of stock market contagion during the COVID-19 pandemic: A Wavelet-Copula-GARCH approach. Journal of Risk and Financial Management, 14(7),329.
[11]. Sharif, A., Aloui, C., & Yarovaya, L. (2020). COVID-19 pandemic, oil prices, stock market, geopolitical risk and policy uncertainty nexus in the US economy: Fresh evidence from the wavelet-based approach. International review of financial analysis, 70, 101496.