


1. Introduction
Efficiency plays an important role, in the success of logistics companies in todays paced and competitive business world. United Parcel Service (UPS), being one of the logistics providers has consistently worked towards improving its efficiency by applying the principles and methodologies of operations research. In this report, we will explore how UPS using operations research to improve the. This report will focus on four key aspects: route optimization, resource allocation, inventory management, and customer service. This report aims to gain insights into the strategies that have enabled UPS to streamline its operations and deliver prime service to its customers through analyzing UPS's use of operations research.
Established in 1907, UPS has grown to become one of the biggest logistics companies in the world through development and diversification [1]. From a humble courier service to the pioneer in air, sea, ground freight and electronic services, UPS also understand the importance of developing new business strategies [2]. UPS know the benefit of efficiency in maintaining its competitive edge with its extensive global network and large-scale operations. Therefore, it is using operations research to improve the efficiency and reduce costs [3].
The first aspect where operations research has benefited UPS is route optimization. UPS's business covers the United States, with a vast network of delivery routes, UPS faces the challenge of efficiently delivering packages while considering factors such as distance, traffic patterns, and delivery time windows [4, 5]. UPS could identify the most effective routes with the aid of operations research, which could result in less fuel consumption and quicker deliveries. Use less cost to make more benefit.
The second aspect where operations research has benefited UPS is resource allocation [6, 7]. Under the premise of limited resources, how to maximize the efficiency of resource utilization has become a problem that UPS needs to solve [6]. UPS needs to allocate its resources, such as vehicles, drivers, and facilities, optimally to meet customer demands while minimizing costs. Operations research could assist UPS to determine best allocation strategies, resulting in improved utilization of resources and enhanced operational efficiency.
The third aspect where operations research has benefited UPS is inventory management [6, 8]. By using operations research models, UPS could optimize inventory levels, reorder points, and replenishment strategies to align them with customer demand. Through keeping a balance with customer demand, UPS could reduce their own inventory backlog, reduce storage costs, improve profitability and meet customers’ needs promptly. Through operations research, UPS could improve the efficiency of inventory management.
The fourth aspect where operations research has benefited UPS is customer service. Efficiency is a key driver of customer satisfaction in the logistics industry. As customers increasingly expect faster delivery times and reliable service, UPS face immense pressure to optimize their operation [5, 9]. Operations research helps UPS to analyze customer satisfaction metrics, identify areas for improvement. Based on above data, UPS could develop strategies to enhance customer service. By understanding customer needs and preferences, UPS could adjust its operations to deliver a prime customer experience, which could lead to increased loyalty and business growth. Besides that, through operation research, UPS could also gain a competitive advantage in the business world [10].
This report will start from part of operations research and efficiency enhancement. In this part, this report will introduce the definition and principles of operations research, role of operations research in logistics optimization and contributions of operations research to efficiency enhancement in logistics companies. After that, this report will clarify the origin of the data used in this report, and how it was analyzed, processed, and verified. This report will also model the data and formulate evaluation metrics. Operations research can play a positive role in UPS in the four aspects of Route Optimization, Resource Allocation, Inventory Management, and Customer Service and Satisfaction. This report will introduce and analyze how operations research works in these four aspects. At the end, this report will recap of the report's key findings, summary of UPS's efficiency enhancement through operations research, provide recommendations for further efficiency improvements at UPS and identify limitations of the study and propose future research directions to address them.
By analyzing the effectiveness of operations research in UPS, this report could also provide practical recommendations for other logistics companies looking forward to enhancing their efficiency. Logistics companies could streamline their operations, cut costs, boost customer satisfaction, and gain a competitive advantage in today's fast-paced and cutthroat business environment by implementing ideas and techniques comparable to UPS [9].
In summary, this report will focus on how UPS continuously improve its efficiency using method of operations research and find future method to improve the efficiency of logistics furthermore.
2. Methods
2.1. Data Source
This data for this report is coming from Statista, which is published by Martin Placek and updated in 2022 and 2023 [11]. Table 1 data is coming from UPS 2021 Annual Report. Table 1 data’s survey time is from 2009 to 2021. Figure 1 data is also from UPS 2021 Annual Report. Figure 1 data’s survey time is from 2013 to 2021. Figure 2 data is coming from ACSI Retail and Consumer Shipping Study 2022-2023. The survey time is from 2017 to 2023.
2.2. Variable Selection
The content of table 1’s data is United Parcel Service of America’s revenue and income from 2009 to 2021. The data contains 13 variables (2009, 2010, 2011, 2012, 2013, 2014, 2015, 2016, 2017, 2018, 2019, 2020, 2021). The content of figure 1 data is number of United Parcel Service employees from 2013 to 2021. The data contains 9 variables (2013, 2014, 2015, 2016, 2017, 2018, 2019, 2020, 2021). The content of figure 2 data is American Consumer Shipping Companies Customer Satisfaction Index scores from 2017 to 2023. Figure 2 data contains three companies and an overall rate, totally seven variables (2017, 2018, 2019, 2020, 2021, 2022, 2023).
Table 1: United Parcel Service of America 's Revenue and Net Income from 2009 to 2021
Year | Revenue | Net Income |
2009 | 45297 | 1968 |
2010 | 49545 | 3338 |
2011 | 53105 | 3804 |
2012 | 54127 | 807 |
2013 | 55438 | 4372 |
2014 | 59178 | 3034 |
2015 | 59186 | 4840 |
2016 | 61610 | 3422 |
2017 | 66585 | 4905 |
2018 | 71861 | 4791 |
2019 | 74094 | 4440 |
2020 | 84628 | 1343 |
2021 | 97287 | 12890 |
*Amount in million U.S. dollars. **Fiscal year ends December 31.
Table 1 shows United Parcel Service of America 's revenue and net income from 2009 to 2021. Table 1 shows a definite rise in revenue.
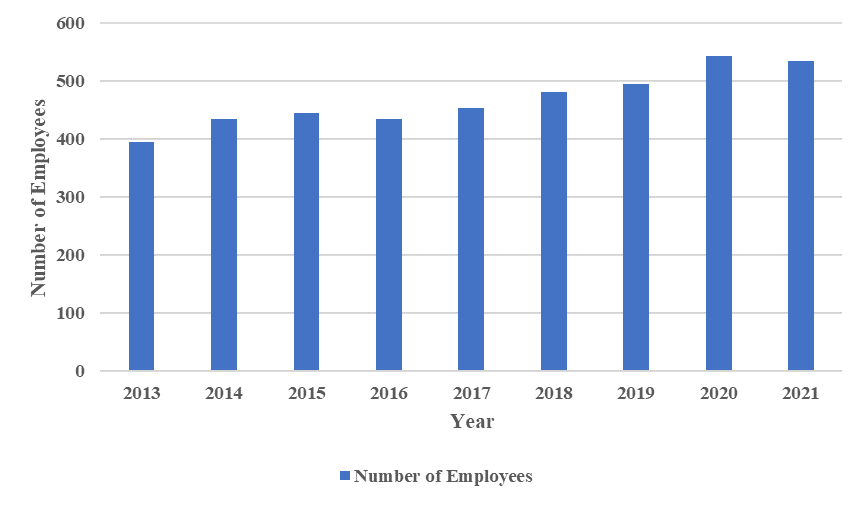
Figure 1: Number of United Parcel Service Employees from 2013 to 2021.
Figure 1 shows the number of UPS employees from 2013 to 2021. The number of employees shows a relatively stable growth trend.
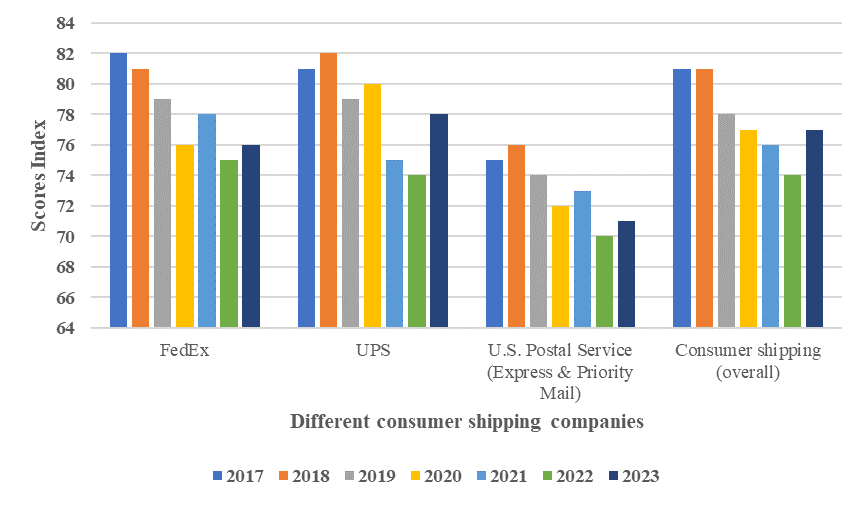
Figure 2: American Consumer Shipping Companies Customer Satisfaction Index scores from 2017 to 2023.
Figure 2 shows American Consumer Shipping Companies Customer Satisfaction Index scores from 2017 to 2023. UPS's Customer Satisfaction Index scores are generally above average.
2.3. Research Protocol
This report uses the Linear Regression model, Revenue is the dependent variable(Y), and the 13 factors are the independent variables(X). Next, this report will use linear regression analysis to analyze the relationship between the effect of X on Y, i.e., the relationship between the 13 factors on Revenue. Besides that, this report will also analyze the using of operations research in UPS, which allowing UPS to expand business scale without large-scale recruitment of employees. Operations research can also improve the customers satisfaction index scores [12]. Figure 2 shows this feature.
3. Results and Discussion
Table 1 shows United Parcel Service of America 's revenue and net income from 2009 to 2021. As the year increases, revenue also increases. In order to build the linear regression model, this report will create a scatterplot from the data in the table 1.
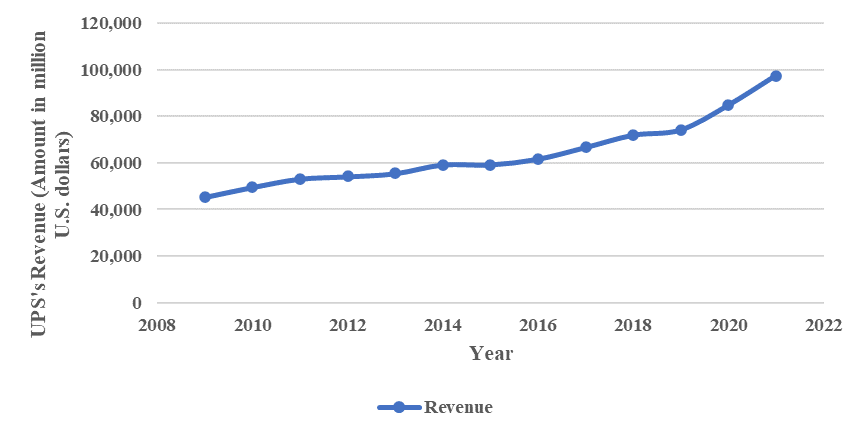
Figure 3: UPS’ revenue from 2009 to 2021.
Through this figure 3, a positive linear regression relationship has emerged. Next, this report will use analysis tools to build linear regression models using sum-squared error.
\( {s_{xx}}=\sum _{i=1}^{n}x_{i}^{2}-n{\bar{x}^{2}} \) (1)
\( {s_{xy}}= \sum _{i=1}^{n}{x_{i}}{y_{ⅈ}}-n\bar{x}\bar{y} \) (2)
\( {\hat{β}_{1}}=\frac{{s_{xy}}}{{s_{xx}}} \) (3)
\( {\hat{β}_{2}}= \bar{y}-{\hat{β}_{1}}\bar{x} \) (4)
Through calculation, this report can get the result of this linear regression model.
\( \hat{y}=-7124007.7527+3567.2473x \) (5)
After having this model, we can predict the UPS’s revenue based on the year. If someone want to predict UPS's revenue in 2023, this report can use the model.
\( \hat{y}=-7124007.7527+ 3567.2473×2023 = 92533.5352 \) (6)
In other words, according to the prediction of this model, UPS's revenue in 2023 will be 92533.5352 million US dollars. But before this model is officially put into use, this model needed to be tested. This report will use coefficient of determination to test is this a good model.
\( {R^{2}}= \frac{SSR}{SST} \) (7)
\( SST= ∑{(y-\bar{y})^{2}} \) (8)
\( SSR= ∑{({y^{ \prime }}-\bar{{y^{ \prime }}})^{2}} \) (9)
Through calculation, this report finds that the coefficient of determination is 0.8893, which very close to 1. It means this model has a good fit. UPS's ability to achieve revenue growth year by year is inseparable from the use of operations research. Whether it is route optimization, resource allocation or inventory management, operations research has helped UPS achieve efficiency improvements.
After building a simple linear regression between year and revenue of UPS. Figure 1 shows the number of United Parcel Service employees from 2013 to 2021. This report wants to analyze the growth of revenue and number of employees in the period from FY2013 to FY2021. The first method used in this report to determine the relationship between revenue and employee count is correlation coefficient.
\( {r_{xy}}=\frac{∑{x_{i}}{y_{i}}-n\bar{x}\bar{y}}{(n-1){s_{x}}{s_{y}}} \) (10)
According to calculations, there is an extremely significant positive relationship between revenue and the number of employees, with the correlation coefficient between the two being 0.9374. However, the growth rate of revenue and number of employees is different. In order to find that difference, this report will firstly use figure 4 to show the difference and calculate the growth rate then.
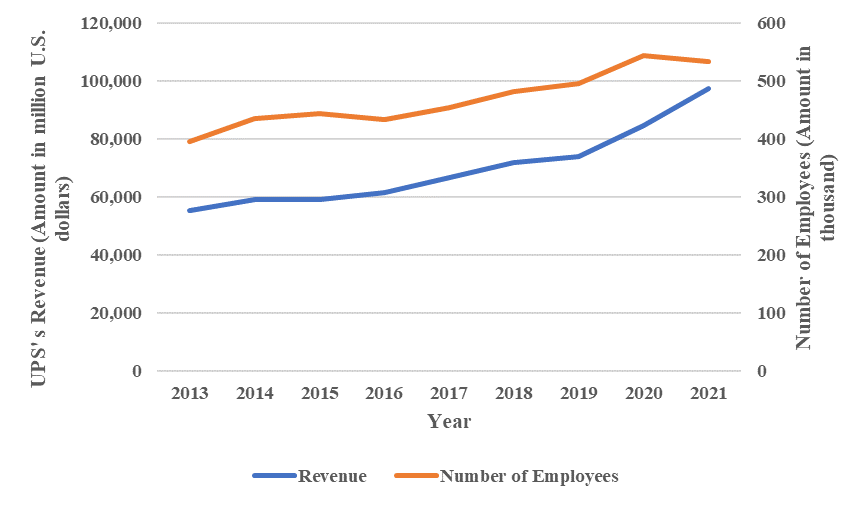
Figure 4: Comparison of revenue and employee growth trends.
\( Growth rate(\%)=\frac{Ending value}{Beginning value}-1 \) (11)
This report's calculations reveal that the revenue growth rate is 75.49%. The number of employees is increasing at a pace of 35.19%. By comparison, this report can find that although revenue and the number of employees is rising, revenue has grown faster. This is due to the increase in UPS's revenue capability. Through operations research, UPS can more optimally allocate its resources, improve resource utilization efficiency, and increase revenue on the basis of reducing operating costs. There are three aspects that can explain operations research play important role in UPS efficiency improvement. The first aspect where operations research has benefited UPS is route optimization, operations research could help UPS to determine the most effective routes, which results in less fuel use and faster delivery. The second aspect where operations research has benefited UPS is resource allocation, operations research could assist UPS to determine best allocation strategies, resulting in improved utilization of resources and enhanced operational efficiency. The third aspect where operations research has benefited UPS is inventory management. Through keeping a balance with customer demand, UPS could reduce their own inventory backlog, reduce storage costs, improve profitability, and meet customers’ needs promptly.
In addition to operations research’s help in route optimization, resource allocation and inventory management. Operations research also helps UPS in the field of customers satisfaction. Figure 2 shows the American Consumer Shipping Companies Customer Satisfaction Index scores from 2017 to 2023. In order to compare UPS with other consumer shipping companies, this report will calculate the average index scores.
\( Average index scores= \frac{\sum Score got during the year}{How many years during the survey period} \) (12)
Through calculation, the average scores can be obtained. UPS gets 78.429 points, which is the highest scores between three consumer shipping companies. FedEx also gets 78.143 points, which is the second highest scores. U.S. Postal Service (Express & Priority Mail) gets the lowest scores, only 73.000 points. This means that UPS has a high level of satisfaction among consumers. Having a good user image and user experience is a major competitive advantage for UPS. These are inseparable from UPS's efforts in operations research. Because customers expect faster delivery times and reliable service increasingly nowadays, UPS uses operations research to optimize their operation. Through analyzing customer needs and preferences, UPS could adjust its operations to deliver a prime customer experience, which could lead to increased customers loyalty and business growth.
4. Conclusion
The current study selects diverse data and focuses on the influence of operations research to the logistics companies. It was concluded that logistics Companies need to optimize their own operational methods in light of the current market's more ruthless competition if they hope to succeed and be advanced. And it goes without saying that companies need the assistance of operations research if they want to survive in the ruthless competition. It cannot be denied that due to the limited amount of data, the linear regression model may have errors in addition to the factors, which may also affect the accuracy of the results. However, this report still has its value. First, it shows that operations research could help UPS with its route optimization, resource allocation, inventory management, and customer service. These are all aspects that are critical to logistics companies’ development. It also provides the reason why UPS can achieve year-over-year revenue growth. Second, it provides an advanced model for other logistics companies. Other logistics companies can refer to the development process of UPS to review and supplement their own strengths and weaknesses. It can help achieve great progress in the logistics industry and demonstrate the importance and significance of operations research in today's market.
References
[1]. Hess, E., (2023). United Parcel Service of America, Inc. Darden Case No. UVA-S-0143. SSRN.
[2]. Bruner, R. F. and Carr, S. (2004). The Battle for Value, 2004: FedEx Corp. vs. United Parcel Service. Inc.
[3]. Kohli, R. (2007). Innovating to create IT-based new business opportunities at United Parcel service. MIS Quarterly Executive, 6(4).
[4]. Ross, J. W. (2001). United Parcel Services: Delivering Packages and E-Commerce Solutions. SSRN.
[5]. Gerald, R. V. (2014). United Parcel Service Financial Challenges in a Developed or Developing Nations. Strategic Management Quarterly, 2(1), 1-10.
[6]. Lekoudis, G. S., Richardson, D. R., and Roark, C. R. (2005). United Parcel Service optimization of vehicle balance. In 2005 IEEE Design Symposium, Systems and Information Engineering, 302-307.
[7]. Schuler, R. S., and Jackson, S. E. (1987). Linking competitive strategies with human resource management practices. Academy of Management Perspectives, 1(3), 207-219.
[8]. Martin, C. R. (2003). The 1997 United Parcel Service strike: Framing the story for popular consumption. Journal of Communication Inquiry, 27(2), 190-210.
[9]. Soupata, L. (2001). Managing culture for competitive advantage at united parcel service. Journal of Organizational Excellence, 20(3), 19-26.
[10]. UPS. (2022). United Parcel Service of America, Inc.'s revenue and net income from FY 2009 to FY 2021 (in million U.S. dollars). Statista.
[11]. UPS. (2022). Number of United Parcel Service employees from FY 2013 to FY 2021. Statista.
[12]. Martin, P. (2023). American Customer Satisfaction Index Scores for Consumer Shipping Companies in the United States from 2017 to 2023. Statista.
Cite this article
Xie,J. (2023). Operations Research Improves the Efficiency of United Parcel Service. Advances in Economics, Management and Political Sciences,61,257-264.
Data availability
The datasets used and/or analyzed during the current study will be available from the authors upon reasonable request.
Disclaimer/Publisher's Note
The statements, opinions and data contained in all publications are solely those of the individual author(s) and contributor(s) and not of EWA Publishing and/or the editor(s). EWA Publishing and/or the editor(s) disclaim responsibility for any injury to people or property resulting from any ideas, methods, instructions or products referred to in the content.
About volume
Volume title: Proceedings of the 2nd International Conference on Financial Technology and Business Analysis
© 2024 by the author(s). Licensee EWA Publishing, Oxford, UK. This article is an open access article distributed under the terms and
conditions of the Creative Commons Attribution (CC BY) license. Authors who
publish this series agree to the following terms:
1. Authors retain copyright and grant the series right of first publication with the work simultaneously licensed under a Creative Commons
Attribution License that allows others to share the work with an acknowledgment of the work's authorship and initial publication in this
series.
2. Authors are able to enter into separate, additional contractual arrangements for the non-exclusive distribution of the series's published
version of the work (e.g., post it to an institutional repository or publish it in a book), with an acknowledgment of its initial
publication in this series.
3. Authors are permitted and encouraged to post their work online (e.g., in institutional repositories or on their website) prior to and
during the submission process, as it can lead to productive exchanges, as well as earlier and greater citation of published work (See
Open access policy for details).
References
[1]. Hess, E., (2023). United Parcel Service of America, Inc. Darden Case No. UVA-S-0143. SSRN.
[2]. Bruner, R. F. and Carr, S. (2004). The Battle for Value, 2004: FedEx Corp. vs. United Parcel Service. Inc.
[3]. Kohli, R. (2007). Innovating to create IT-based new business opportunities at United Parcel service. MIS Quarterly Executive, 6(4).
[4]. Ross, J. W. (2001). United Parcel Services: Delivering Packages and E-Commerce Solutions. SSRN.
[5]. Gerald, R. V. (2014). United Parcel Service Financial Challenges in a Developed or Developing Nations. Strategic Management Quarterly, 2(1), 1-10.
[6]. Lekoudis, G. S., Richardson, D. R., and Roark, C. R. (2005). United Parcel Service optimization of vehicle balance. In 2005 IEEE Design Symposium, Systems and Information Engineering, 302-307.
[7]. Schuler, R. S., and Jackson, S. E. (1987). Linking competitive strategies with human resource management practices. Academy of Management Perspectives, 1(3), 207-219.
[8]. Martin, C. R. (2003). The 1997 United Parcel Service strike: Framing the story for popular consumption. Journal of Communication Inquiry, 27(2), 190-210.
[9]. Soupata, L. (2001). Managing culture for competitive advantage at united parcel service. Journal of Organizational Excellence, 20(3), 19-26.
[10]. UPS. (2022). United Parcel Service of America, Inc.'s revenue and net income from FY 2009 to FY 2021 (in million U.S. dollars). Statista.
[11]. UPS. (2022). Number of United Parcel Service employees from FY 2013 to FY 2021. Statista.
[12]. Martin, P. (2023). American Customer Satisfaction Index Scores for Consumer Shipping Companies in the United States from 2017 to 2023. Statista.