


1. Introduction
A share price analysis report is written to provide a comprehensive evaluation of a company's stock performance and the factors that influenced its market value. Such reports are valuable for a variety of stakeholders, including investors, financial analysts, company management, regulators, and even the public. Tencent Holdings Limited is a Chinese Internet company headquartered in Shenzhen, Guangdong Province [1]. The Company, together with its subsidiaries, is principally engaged in the provision of Internet value-added services ("IVAS"), mobile and telecommunication value-added services ("MVAS"), online advertising services, and e-commerce transaction services to users in the PRC. The Company's businesses are in various fields, including Internet value-added services, mobile value-added services, online advertising, e-commerce transactions, and others. Tencent Holdings LLC post its stock in Hong Kong stock exchange market on the date of June 16, 2004. Le has observed and analyzed the stock information of Tencent Holdings LLC from 2018 to the present. And utilized China’s extraordinary growth over the past few decades to attract worldwide investors [2]. In analysis and comparison with grand domestic product enlarge rate, inflation, and employment rate within China itself and amount the world including United States of America to conduct further analysis regards to Tencent Holding LLC's stock volatility based on the scale of macroeconomy. As a high-tech technology company in various technology fields including social software, cloud services, etc. Tencent needs to stay on the cutting edge to achieve high benefits for its equity holders in this rapidly growing field. Innovation is more sophisticated than ever. Companies will now develop internal solutions and technologies that were impossible to think of years back [3]. Include but not limit to development and application of AI, enhanced Automation Machinery, and a balance ecosystem with cyber robotic system. The fourth technological revolution is still in progress but only the countable few can stand out from the game and take advantage of the first breeze of the wind. Similar to web 3.0, the ones that are successful now are those who accomplished greater achievement among its competitors.
The volatility in the stock market is caused by multi factors from all aspects. Economic indicators, interest rates, and economic growth or contraction can affect investor confidence and impact stock prices across the market, including Tencent. Changes in regulations or government policies can have a significant impact on Tencent's operations and its stock price. Regulatory concerns related to the technology sector, data privacy, and other issues can lead to price volatility [4]. Developments in the technology and gaming industries, where Tencent is a major player, can significantly affect its stock price [5]. Innovations, changes in user behavior, regulatory changes, and competition can impact investor perceptions of the company's future growth prospects [6]. Le analyzed the stock price and trade volume monthly to conclude the factors that cause the market to fluctuate. Le gathered the price data and conducted an Arima Model Analysis. Although it concludes a result, again, the data model is only based on numbers. Factors like those mentioned above are not a consideration in the analysis. Therefore, Le utilizes the graph from the analysis and observes the fluctuations of the stock price. Check back with the time of the data and research the cause of the price volatility. From the news report to the press. And from quarterly financial reports to annual reports.
In summary, it's important to note that stock prices are influenced by a complex interplay of factors, and often multiple factors are at play simultaneously [7]. Short-term price fluctuations are normal in the stock market, and a long-term perspective is typically more important for investors to consider when evaluating a company's potential.
2. Methods
2.1. Data Source
The study utilizes data collected over a 5-year period, spanning from August 1, 2015, to August 1, 2023. The dataset comprises a total of 97 values, with each variable recorded monthly. The variables analyzed include stock price, opening price, closing price, daily high point, daily low point, total volume, and percentage change. The data was sourced from "investing.com," which served as the primary data source for the research analysis [8].
2.2. Indicator Selection and Expalnation
The data utilized in this paper are collected from a total of 97 values among multiple variables. Data from the past 5 years are collected and sorted in a periodic order. Variables include price, open price, closing price, daily high, daily low, and volume. One data is collected from each month among all variables (Table 1). was sourced from "investing.com," which served as the primary data source for the research analysis [9].
Table 1: Data of the Stock Price of the 10 factors
0 | Date | Price | Open | High | Low | Vol. | Change% |
1 | 11/1/2022 | 272.78 | 197.36 | 287.59 | 197.36 | 919.01M | 39.69% |
2 | 12/1/2022 | 317.23 | 283.03 | 326.53 | 276.95 | 574.80M | 16.30% |
3 | 1/1/2023 | 382.2 | 317.23 | 416.6 | 312.29 | 529.87M | 20.48% |
4 | 2/1/2023 | 343.6 | 385.6 | 397.2 | 342.8 | 454.58M | -10.10% |
5 | 3/1/2023 | 385.8 | 347.4 | 397.6 | 330.4 | 577.59M | 12.28% |
6 | 4/1/2023 | 344.4 | 389 | 391 | 333 | 317.40M | -10.73% |
7 | 5/1/2023 | 310.6 | 352 | 354.4 | 306 | 408.86M | -9.81% |
8 | 6/1/2023 | 331.6 | 312.6 | 364.4 | 311.2 | 409.74M | 6.76% |
9 | 7/1/2023 | 354.4 | 331.8 | 363 | 320 | 383.66M | 6.88% |
10 | 8/1/2023 | 320 | 354 | 361 | 305.8 | 12.54M | -9.71% |
2.3. Method Introduction
Outline the methodology employed to conduct a comprehensive analysis of Tencent Holdings Limited's stock price using the Autoregressive Integrated Moving Average (ARIMA) (0,1,0) model. The purpose of this research is to provide a structured and data-driven approach to understanding the stock price behavior of Tencent over the past five years. The dataset used in this analysis consists of 97 data points across multiple variables. These variables, including price, open price, closing price, daily high, daily low, and trading volume, are crucial in understanding the dynamics of Tencent's stock price over time. By collecting monthly data over a five-year period, we aim to capture the key trends and fluctuations in these indicators This paper employed the ARIMA (0,1,0) model to analyze the time series data of Tencent's stock price. The choice of this model is based on its ability to capture trends and patterns in time series data by considering differencing, autoregressive, and moving average components [10].
3. Results and Discussion
The Table 2 reports the analysis of a time series dataset using the ARIMA model. The point of this analysis is to present details into the Price variable and determine the optimal ARIMA model for forecasting. The dataset under consideration pertains to a time series of Price data. The result has employed an ARIMA (0,1,0) model for analysis, where the numbers in the parentheses denote the order of the autoregressive (p), differencing (d), and moving average (q) components, respectively. The constant term in the ARIMA (0,1,0) model is estimated to be -2.068. This represents the intercept or baseline value for the time series data. The standard error associated with this estimate is 3.352, and the z-value is -0.617, which is used to test the significance of the constant. The p-value of 0.537 suggests that the constant term is not statistically significant at conventional significance levels (e.g., alpha = 0.05). This means that the constant may not be necessary for modeling the Price data.
The AIC and BIC are information criteria used to assess the degree of accuracy and goodness of fit of statistical models. Lower AIC and BIC values present a more valuable fit. In this case, the AIC value is 945.653, while the BIC value is 950.781. These values can be used for model selection, with lower values indicating a more parsimonious model (Table 2).
Table 2: ARIMA (0,1,0) Model Parameter Tables
Item | Symbol | Ratio | Standard Error | z-value | p-value | 95% CI |
Constant term | c | -2.068 | 3.352 | -0.617 | 0.537 | -8.638 ~ 4.502 |
AIC value:945.653 | ||||||
BIC value:950.781 | ||||||
The Table 3 presents the results of the Ljung-Box Q test applied to the residuals of a statistical model. The Ljung-Box Q test is used to assess whether the residuals exhibit autocorrelation, which is essential in evaluating the adequacy of the model. In this analysis, we focus on the p-values associated with the Q statistic for various lags.
The Ljung-Box Q test evaluates the null hypothesis that the residuals of the model are independent (i.e., white noise). The test statistic Q is calculated for different lags (Q1, Q2, ..., Q19), and the associated p-values are assessed against a significance level, typically 0.05 or 0.1.
In the context of the Ljung-Box Q test, the null hypothesis states that the residuals are independent (white noise), while the alternative hypothesis suggests that there is autocorrelation in the residuals.
Based on the p-values obtained, the p-value for Q6 is 0.634, which is greater than the significance level of 0.1. Therefore, this paper cannot reject the null hypothesis for this lag. This indicates that at a significance level of 0.1, there is no evidence of autocorrelation in the residuals at lag 6. For lags Q1 to Q5, the p-values are all well above 0.1, further suggesting no evidence of autocorrelation at these lags. For lags Q7 and beyond, some p-values are below 0.1, indicating potential autocorrelation in the residuals at those lags. However, it's important to consider the specific significance level chosen for this analysis. If a significance level of 0.05 had been chosen, some of these lags might have been considered significant.
Table 3: The Q statistic
Items | Volume | p Value | Q10 | 17.035 | 0.074 |
Q1 | 0.08 | 0.777 | Q11 | 17.308 | 0.099 |
Q2 | 0.141 | 0.932 | Q12 | 18.282 | 0.107 |
Q3 | 1.975 | 0.578 | Q13 | 19.514 | 0.108 |
Q4 | 2.759 | 0.599 | Q14 | 19.578 | 0.144 |
Q5 | 4.015 | 0.547 | Q15 | 21.027 | 0.136 |
Q6 | 4.314 | 0.634 | Q16 | 22.438 | 0.13 |
Q7 | 10.678 | 0.153 | Q17 | 25.145 | 0.092 |
Q8 | 10.808 | 0.213 | Q 18 | 25.299 | 0.117 |
Q9 | 16.347 | 0.06 | Q19 | 26.144 | 0.126 |
The Table 4 presents the predicted values for a 12-phase forecast, with predictions made at various backward time intervals. Additionally, the report provides the root-mean-square deviation (RMSD) as a measure of the accuracy of the predictions. Values from Table 4 represent the forecasted values for the variable of interest at various time intervals into the future. This value appears to exhibit a decreasing trend as result move further into the future, which is characteristic of a forecasted time series. Predicted values provide insight into the expected behavior of the variable of interest over the next 12 phases. Decreasing trend in the predictions suggests that the variable is expected to decline over time. RMSD value of 32.6388 shows the typical discrepancy between the expected and actual numbers. A lower RMSD suggests more accurate predictions, while a higher RMSD indicates less accuracy. In this case, an RMSD of 32.6388 should be interpreted in the context of the scale and variability of the variable being forecasted. It would be helpful to compare this RMSD to other models or benchmarks to assess whether the predictions are considered accurate or require improvement. And figure 1 shows the model fitting and predicting results, which fits well.
Table 4: Predicted Value (12 Phase)
Prediction | 1 | 2 | 3 | 4 | 5 | 6 |
Value | 119.412 | 117.344 | 115.276 | 113.208 | 111.14 | 109.073 |
Prediction | 7 | 8 | 9 | 10 | 11 | 12 |
Value | 107.005 | 104.937 | 102.869 | 100.801 | 98.733 | 96.665 |
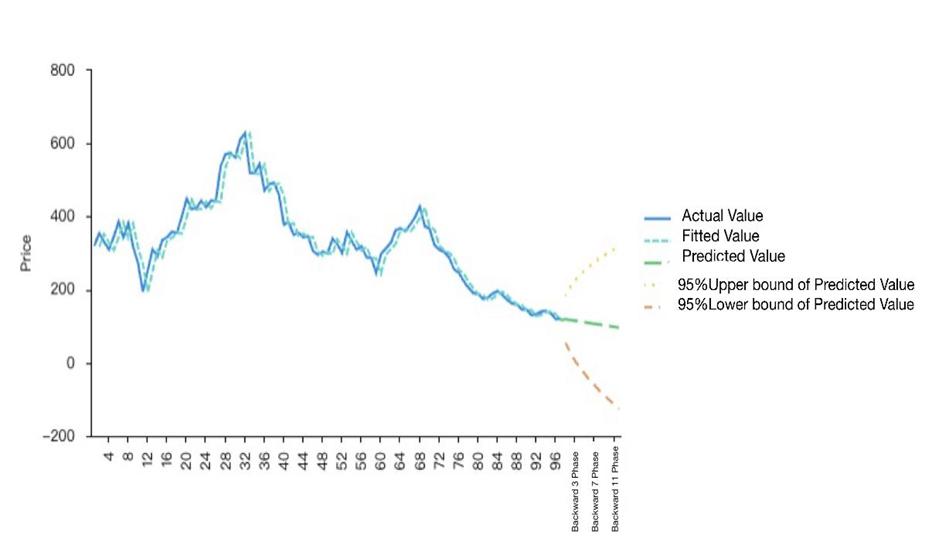
Figure 1: Price model fitting and prediction.
The table 5 presents the results of a Residual LM Correlation LM Test, which aims to assess the correlation between the residuals of a statistical model and a set of independent variables. The F-statistics, measuring the overall correlation strength, yielded a value of 1.351. The associated p-value for the F-statistics is 0.22, indicating no strong evidence to reject the null hypothesis of no significant correlation. Additionally, the T *R square- Statistics, measuring the nature of the correlation, produced a value of 13.125, with an associated p-value of 0.217, further suggesting no strong evidence of significant correlation between the residuals and independent variables at conventional significance levels.
Table 5: Residual LM Correlation LM Test
F-statistics | T *R square- Statistics | |
1.351 | 13.125 | |
p Value | 0.22 | 0.217 |
4. Conclusion
In this comprehensive analysis of Tencent Holdings Limited's stock performance, the conclusion has examined a myriad of factors that influence stock price volatility, including economic indicators, regulatory changes, industry dynamics, and technological advancements. This utilization of an ARIMA (0,1,0) model shed light on the time series data of Tencent's stock price, indicating that the constant term in the model may not be statistically significant, suggesting its potential redundancy in modeling the stock price. Source of 12-phase forecast revealed a downward trend in Tencent's stock price, an insight valuable for investors considering their positions in the company. However, the root-mean-square deviation (RMSD) underscores the importance of contextualizing prediction accuracy, considering the scale and variability of the variable being forecasted. Additionally, the conclusion assessed residual correlation using the Residual LM Correlation LM Test, which yielded no strong evidence of significant correlation between residuals and independent variables. In sum, this analysis underscores the intricate nature of stock price determination, emphasizing the need for a holistic approach that encompasses both quantitative and qualitative factors. Investors are reminded to adopt a long-term perspective when evaluating Tencent's market potential, as stock prices are subject to a complex interplay of variables that extend beyond numerical analysis.
Authors Contribution
All the authors contributed equally and their names were listed in alphabetical order.
References
[1]. Ji, X. (2022) Valuation of Tencent Holdings. Repositorio.
[2]. Che, J. (2018) Investment Analysis about China’s IT Company-The Tencent Holdings Limited. Modern Economy, 09(06), 1112–1120.
[3]. Sharma, A. K., et al. (2021) A study of trends and industrial prospects of Industry 4.0. Materials Today: Proceedings, 47.
[4]. Fu, T. (2019) China’s personal information protection in a data-driven economy: A privacy policy study of Alibaba, Baidu and Tencent. Global Media and Communication, 15(2).
[5]. Cui, J., Yan, C., Ng, A. and Hong, H. (2022) Tencent’s Corporate Strategic Organizational Digital Management and Digital Transformation: A case study. Journal of business and social sciences, 2.
[6]. Wang, Y. (2023) Impact of Tencent equity incentive on enterprise expected growth ability (Dissertation). Working paper.
[7]. Kurihara, Y. (2021) What Influences on Stock Prices Have Occurred Due to the U.S.- China Trade Dispute? Journal of Economics & Management Research, 2(3), 1–5.
[8]. Liu, H.B., and Yi, D.Y. (2007) A stock price prediction method based on wavelet analysis and fractal theory Statistics and Decision Making, 110-111.
[9]. Li, D., Su, X.H. and Ma, S.Y. (2003) A stock price prediction algorithm based on the new dimensional grey Markov model Journal of Harbin Institute of Technology, 35 (2), 5.
[10]. Yuan, D. (2009) Research on stock price prediction model based on dynamic neural network. Doctoral dissertation, Hunan University.
Cite this article
Sun,L.;Yuan,H. (2023). Research on the Tencent Company Stock Price Based on ARIMA Model. Advances in Economics, Management and Political Sciences,64,263-268.
Data availability
The datasets used and/or analyzed during the current study will be available from the authors upon reasonable request.
Disclaimer/Publisher's Note
The statements, opinions and data contained in all publications are solely those of the individual author(s) and contributor(s) and not of EWA Publishing and/or the editor(s). EWA Publishing and/or the editor(s) disclaim responsibility for any injury to people or property resulting from any ideas, methods, instructions or products referred to in the content.
About volume
Volume title: Proceedings of the 2nd International Conference on Financial Technology and Business Analysis
© 2024 by the author(s). Licensee EWA Publishing, Oxford, UK. This article is an open access article distributed under the terms and
conditions of the Creative Commons Attribution (CC BY) license. Authors who
publish this series agree to the following terms:
1. Authors retain copyright and grant the series right of first publication with the work simultaneously licensed under a Creative Commons
Attribution License that allows others to share the work with an acknowledgment of the work's authorship and initial publication in this
series.
2. Authors are able to enter into separate, additional contractual arrangements for the non-exclusive distribution of the series's published
version of the work (e.g., post it to an institutional repository or publish it in a book), with an acknowledgment of its initial
publication in this series.
3. Authors are permitted and encouraged to post their work online (e.g., in institutional repositories or on their website) prior to and
during the submission process, as it can lead to productive exchanges, as well as earlier and greater citation of published work (See
Open access policy for details).
References
[1]. Ji, X. (2022) Valuation of Tencent Holdings. Repositorio.
[2]. Che, J. (2018) Investment Analysis about China’s IT Company-The Tencent Holdings Limited. Modern Economy, 09(06), 1112–1120.
[3]. Sharma, A. K., et al. (2021) A study of trends and industrial prospects of Industry 4.0. Materials Today: Proceedings, 47.
[4]. Fu, T. (2019) China’s personal information protection in a data-driven economy: A privacy policy study of Alibaba, Baidu and Tencent. Global Media and Communication, 15(2).
[5]. Cui, J., Yan, C., Ng, A. and Hong, H. (2022) Tencent’s Corporate Strategic Organizational Digital Management and Digital Transformation: A case study. Journal of business and social sciences, 2.
[6]. Wang, Y. (2023) Impact of Tencent equity incentive on enterprise expected growth ability (Dissertation). Working paper.
[7]. Kurihara, Y. (2021) What Influences on Stock Prices Have Occurred Due to the U.S.- China Trade Dispute? Journal of Economics & Management Research, 2(3), 1–5.
[8]. Liu, H.B., and Yi, D.Y. (2007) A stock price prediction method based on wavelet analysis and fractal theory Statistics and Decision Making, 110-111.
[9]. Li, D., Su, X.H. and Ma, S.Y. (2003) A stock price prediction algorithm based on the new dimensional grey Markov model Journal of Harbin Institute of Technology, 35 (2), 5.
[10]. Yuan, D. (2009) Research on stock price prediction model based on dynamic neural network. Doctoral dissertation, Hunan University.