


1.Introduction
The stock market is a crucial component of the financial market and has a significant impact on the promotion of national economic development and global integration. The price of stocks is in flux every moment, and changes in stock prices are manifested in market volatility, which makes the study of stock price changes of great significance. In recent years, the size of the stock market has been expanding rapidly and the market transparency is getting higher and higher, and the trading strategies of investors have been homogenized seriously, and the prediction of stock prices has become more difficult, therefore, it is important to explore reasonable and effective prediction methods to be able to better predicting stock price trends.
Studying the influencing factors of the stock market based on the perspective of econometric models is one of the important directions of the early stock market research methods. Engle's model of autoregressive conditional heteroskedasticity can describe and analyze the volatility of the return of the financial assets, and it is the tool [1]. The generalized ARCH model proposed by Bollerslev has been widely used in practice, and the GARCH model can be more effective in describing the conditional heteroskedasticity's dynamic characteristics. Wan Wei used several models such as GARCH to study the stocks in Shanghai and Shenzhen markets, and empirically conducted a comparative study of their returns and summarized the laws that existed in them. Huang Xuan et al. constructed an ARMA-GARCH model to empirically analyze the Shanghai and Shenzhen 300 index volatility and concluded that the ARMA-GARCH model can effectively predict its future short-term volatility to a certain extent. Li Xiongying fits and predicts the daily log return series of the stocks of the four major banks and analyzes them and concludes that the ARMA-GARCH model can achieve more desirable results in terms of fitting effect and prediction ability compared with the ARMA model [2].
Further, in using VaR for risk measurement, Dowd categorizes the VaR measures into three categories: parametric, nonparametric, and stochastic modeling. Considering the prevalence of financial time series with conditional [3].
Considering the general conditional heteroskedasticity of financial time series, Engle proposed the ARCH model (Autoregressive Conditional Heteroskedasticity Model) to characterize the volatility agglomeration of financial time series. In order to solve the problem of the high number of parameters to be estimated due to the high order of the ARCH model, Bollerslev extended the ARCH model into the GARCH model (Generalized Autoregressive Conditional Heteroskedasticity Model) [4,5]. Subsequently, in order to compensate for the shortcomings of the GARCH model, the GARCH-M, IGARCH, LGARCH, EGARCH, TGARCH, TGARCH and TGARCH have been developed to compensate for the shortcomings of the GARCH model [6]. and other new models have been proposed continuously, and financial time series risk management models have been improved. On the other hand, due to the prevalence of sharp peaks and thick tails in financial time series, Chen Shoudong and Yu Shidian analyzed the risk of the Shanghai and Shenzhen stock markets based on the t-distribution and the GED distribution, and found that the GARCH model under the assumptions of the t-distribution and the GED distribution better reflects the risk characteristics of the rate of return, and at the same time, the Shenzhen stock market has a greater risk, Ye Qing, Zou Jianjun, Zhang Zongyi, and Qin Zhengalso analyzed the risk profile of China's stock market using this model[7,8]; Liu Qingfu, Zhong Weijun, and Mei Shu'e found that the Va R-EGARCH model better portrays the risk characteristics of China's copper futures market by establishing a GARCH-VaR model under the assumptions of the three distributions [9]; Yuan Chunling found a Va R-EGARCH model better reflects the risk characteristics of China's copper futures market by using the VaR-EGARCH model based on the ARMA-GARCH model [10]. Yuan Chunling found that by using the VAR method based on the ARMA-GARCH model, the CVAR model of the EGARCH model under GED distribution may more accurately assess the market risk of China's Hong Kong REITs.; Guo Xiaoting also analyzed the risk characteristics of China's securities fund investment market through the GARCH-VAR model [11,12].
2.Research design
2.1.Data Sources
This paper uses the Choice financial terminal to find out the closing price and returns of China's stock and futures market. Due to the violent impact on the stock and the futures market, we do not choose the stock market’s and the futures market’s closing price during the epidemic situation. In order to make the data more time -effective, we chose the closing price and returns of the stock market and the futures market from 2016 to 2019, as a data source and data basis for empirical analysis to study the the impact of fluctuations in the stock market price on the futures market price and the influence of futures market price fluctuations on the stock market price. Due to the occurrence of systemic financial risks in 2015 and the COVID-19 in 2020, the data from 2016 to 2019 are more valuable for reference and research.
2.2.Weak Stationarity Test
After completing the model construction, we first need to perform a unit root test (smoothness test) on the model, where the original hypothesis is that the model is not smooth. We use STATA for ADF test to get Table 1.
Table 1: Weak Stationarity Test
|
t |
p |
|
|
Index |
||
|
SSEC |
-2.232 |
0.4717 |
|
CCICFI |
-2.658 |
0.2538 |
|
Return |
||
|
SSEC |
-21.688 |
0.0000 |
|
CCICFI |
-21.337 |
0.0000 |
According to the P-value obtained, we know that the p-value for the returns is 0, which is less than 0.1 and can be considered statistically significant. Thus, the data for the returns is stationary.
2.3.Vector Autoregression (VAR) Model
We use VAR models and set up two independent time sequence variables, which are represented by\( S and C \), respectively, and obtained the two -dimensional VAR model.
S=\( {α_{10}}+{α_{11}}{x_{t-1,1}}+⋯+{α_{1p}}{x_{t-p,1}}+{β_{11}}{x_{t-1,1}}+⋯+{β_{1p}}{x_{t-p,2}}+{γ_{11}}{x_{t-3,3}}+⋯+{γ_{1p}}{x_{t-p,3}}+{ε_{1t}} \) (1)
C=\( {α_{20}}+{α_{21}}{x_{t-1,1}}+⋯+{α_{2p}}{x_{t-p,1}}+{β_{21}}{x_{t-1,2}}+⋯+{β_{2p}}{x_{t-p,2}}+{γ_{21}}{x_{t-1,3}}+⋯+{γ_{2p}}{x_{t-p,3}}+{ε_{2t}} \) (2)
\( (\begin{matrix}S \\ C \\ \end{matrix})=(\begin{matrix}{α_{10}} \\ {α_{20}} \\ \end{matrix})+(\begin{matrix}{α_{11}} \\ {α_{21}} \\ \end{matrix}){x_{t-1,1}}+⋯+(\begin{matrix}{α_{1p}} \\ {α_{2p}} \\ \end{matrix}){x_{t-p,1}}+(\begin{matrix}{β_{11}} \\ {β_{12}} \\ \end{matrix}){x_{t-1,2}}+⋯+(\begin{matrix}{β_{1p}} \\ {β_{2p}} \\ \end{matrix}){x_{t-p,2}}+(\begin{matrix}{γ_{11}} \\ {γ_{21}} \\ \end{matrix}){x_{t-1,3}}+⋯+(\begin{matrix}{γ_{1p}} \\ {γ_{2p}} \\ \end{matrix}){x_{t-p,3}}+(\begin{matrix}{e_{1t}} \\ {e_{2t}} \\ \end{matrix}) \) (3)
The equation (1), (2) above are for stock market return and futures market, respectively, while equation (3) is in matrix form. In equation (1),\( {α_{10}}+{α_{11}}{x_{t-1,1}}+⋯+{α_{1p}}{x_{t-p,1}} \)represents a linear function of past lags of stock market return,while\( {β_{11}}{x_{t-1,2}}+⋯+{β_{1p}}{x_{t-p,2}} \)and\( {γ_{11}}+{x_{t-1,3}}+⋯+{γ_{1p}}{x_{t-p,3}} \)represent past lags of daily closing price,\( {ε_{1t}} \)is the error term. Similarly, the structures of the equations for the other variable is the same, but the variable on the left of the equation and coefficients are changed.
2.4.ARMA-GARCHX Model
2.4.1.Model specification: ARMA
In the equation (1),\( {∅_{0}}+\sum _{i=1}^{p}{α_{i}}{x_{t-i}} \)represents the AR(p) model, which uses the historical returns of stock market or future market to forecast the future, while\( \sum _{i=1}^{q}{β_{i}}{ϵ_{t-1}} \)which uses past volatility to estimate the future and the last part of the model.
|
\( {x_{t}}={∅_{0}}+\sum _{i=1}^{p}{α_{i}}{x_{t-i}}+\sum _{i=1}^{q}{β_{i}}{ϵ_{t-1}}+{ϵ_{i}} \) |
(4) |
In this paper, the AR model uses the historical returns of stock market and future market over the period from 2016 to 2019, while the MA model uses an error term to forecast the future.
2.4.2.Model specification: GARCH-X
We construct ARMA-GARCH models of the returns and volatilities of the stock market and future market to assess the correlation between the stock market’s and the future market’s volatilities.
The model GARCH (p, q) is set as follows:
|
\( σ_{S,t}^{2}={α_{1}}ε_{t-1}^{2}+⋯+{α_{q}}ε_{t-q}^{2}+{γ_{1}}σ_{t-1}^{2}+⋯+{γ_{p}}σ_{t-p}^{2}+βσ_{F,t}^{2} \) |
(5) |
|
\( σ_{F,t}^{2}σ_{S,t}^{2}={α_{1}}ε_{t-1}^{2}+⋯+{α_{q}}ε_{t-q}^{2}+{γ_{1}}σ_{t-1}^{2}+⋯+{γ_{p}}σ_{t-p}^{2}+βσ_{S,t}^{2} \) |
(6) |
In the equation (5) and (6),\( σ_{S,t}^{2} \)is the stock market's erratic behavior and\( σ_{F,t}^{2} \)is the future market's erratic behavior, the terms\( {α_{1}}ε_{t-1}^{2}+⋯+{α_{q}}ε_{t-q}^{2} \)is ARCH part, GARCH model is set up based on the ARCH model, with the addition of autoregression of\( σ_{t}^{2} \). In (5) and (6), the term\( {γ_{1}}σ_{t-1}^{2}+⋯+{γ_{p}}σ_{t-p}^{2} \)is GARCH part.
3.Empirical Research Result
3.1.Model Order Identification and Stability
The VAR model has the following characteristics:
1.This model is an economic theory-based structural model. Unfortunately, the dynamic interaction between the variables is not clearly depicted by economic theory.;
2. the problem of dividing endogenous and exogenous variables is more complicated.
3. the problem of model identification, when the model is not identifiable, in order to achieve the purpose of identifiability, it is often necessary to add different instrumental variables to the equations, usually these instrumental variables have weak explanatory power.
4.The assumptions are broken if the variables are not stationary, which causes more severe issues with pseudo-regression.
When analyzing the effect of lagged variables in the dependent variable, it is extremely inconvenient to deal with it with an ordinary system of simultaneous equations. First of all, ordinary systems of simultaneous equations have to consider whether the variables are endogenous or exogenous in the selection of variables, and sometimes some important lagged variables are omitted, while the VAR model treats all the variables as endogenous variables, thus reducing the uncertainty in the system of simultaneous equations model that increases due to the error of subjective judgment.
Table 2: Likelihood ratio test and information criterion
|
Lag |
LL |
LR |
p |
AIC |
HQIC |
SBIC |
|
0 |
6131.93 |
-12.7441* |
-12.7403* |
-12.734* |
||
|
1 |
6135.53 |
7.1992 |
0.126 |
-12.7433 |
-12.7317 |
-12.7129 |
|
2 |
6136.14 |
1.2192 |
0.875 |
-12.7363 |
-12.717 |
-12.6856 |
|
3 |
6138.71 |
5.144 |
0.273 |
-12.7333 |
-12.7063 |
-12.6624 |
|
4 |
6140.31 |
3.2044 |
0.524 |
-12.7283 |
-12.6936 |
-12.6372 |
|
5 |
6148.42 |
16.203 |
0.003 |
-12.7368 |
-12.6944 |
-12.6255 |
|
6 |
6152.62 |
8.3999 |
0.078 |
-12.7372 |
-12.6871 |
-12.6057 |
|
7 |
6158.48 |
11.721* |
0.020 |
-12.7411 |
-12.6833 |
-12.5893 |
|
8 |
6159.97 |
2.9861 |
0.560 |
-12.7359 |
-12.6704 |
-12.5638 |
|
9 |
6163.82 |
7.7035 |
0.103 |
-12.7356 |
-12.6624 |
-12.5433 |
|
10 |
6165.9 |
4.1642 |
0.384 |
-12.7316 |
-12.6507 |
-12.519 |
|
11 |
6169.05 |
6.2884 |
0.179 |
-12.7298 |
-12.6412 |
-12.497 |
|
12 |
6170.36 |
2.6338 |
0.621 |
-12.7242 |
-12.6279 |
-12.4712 |
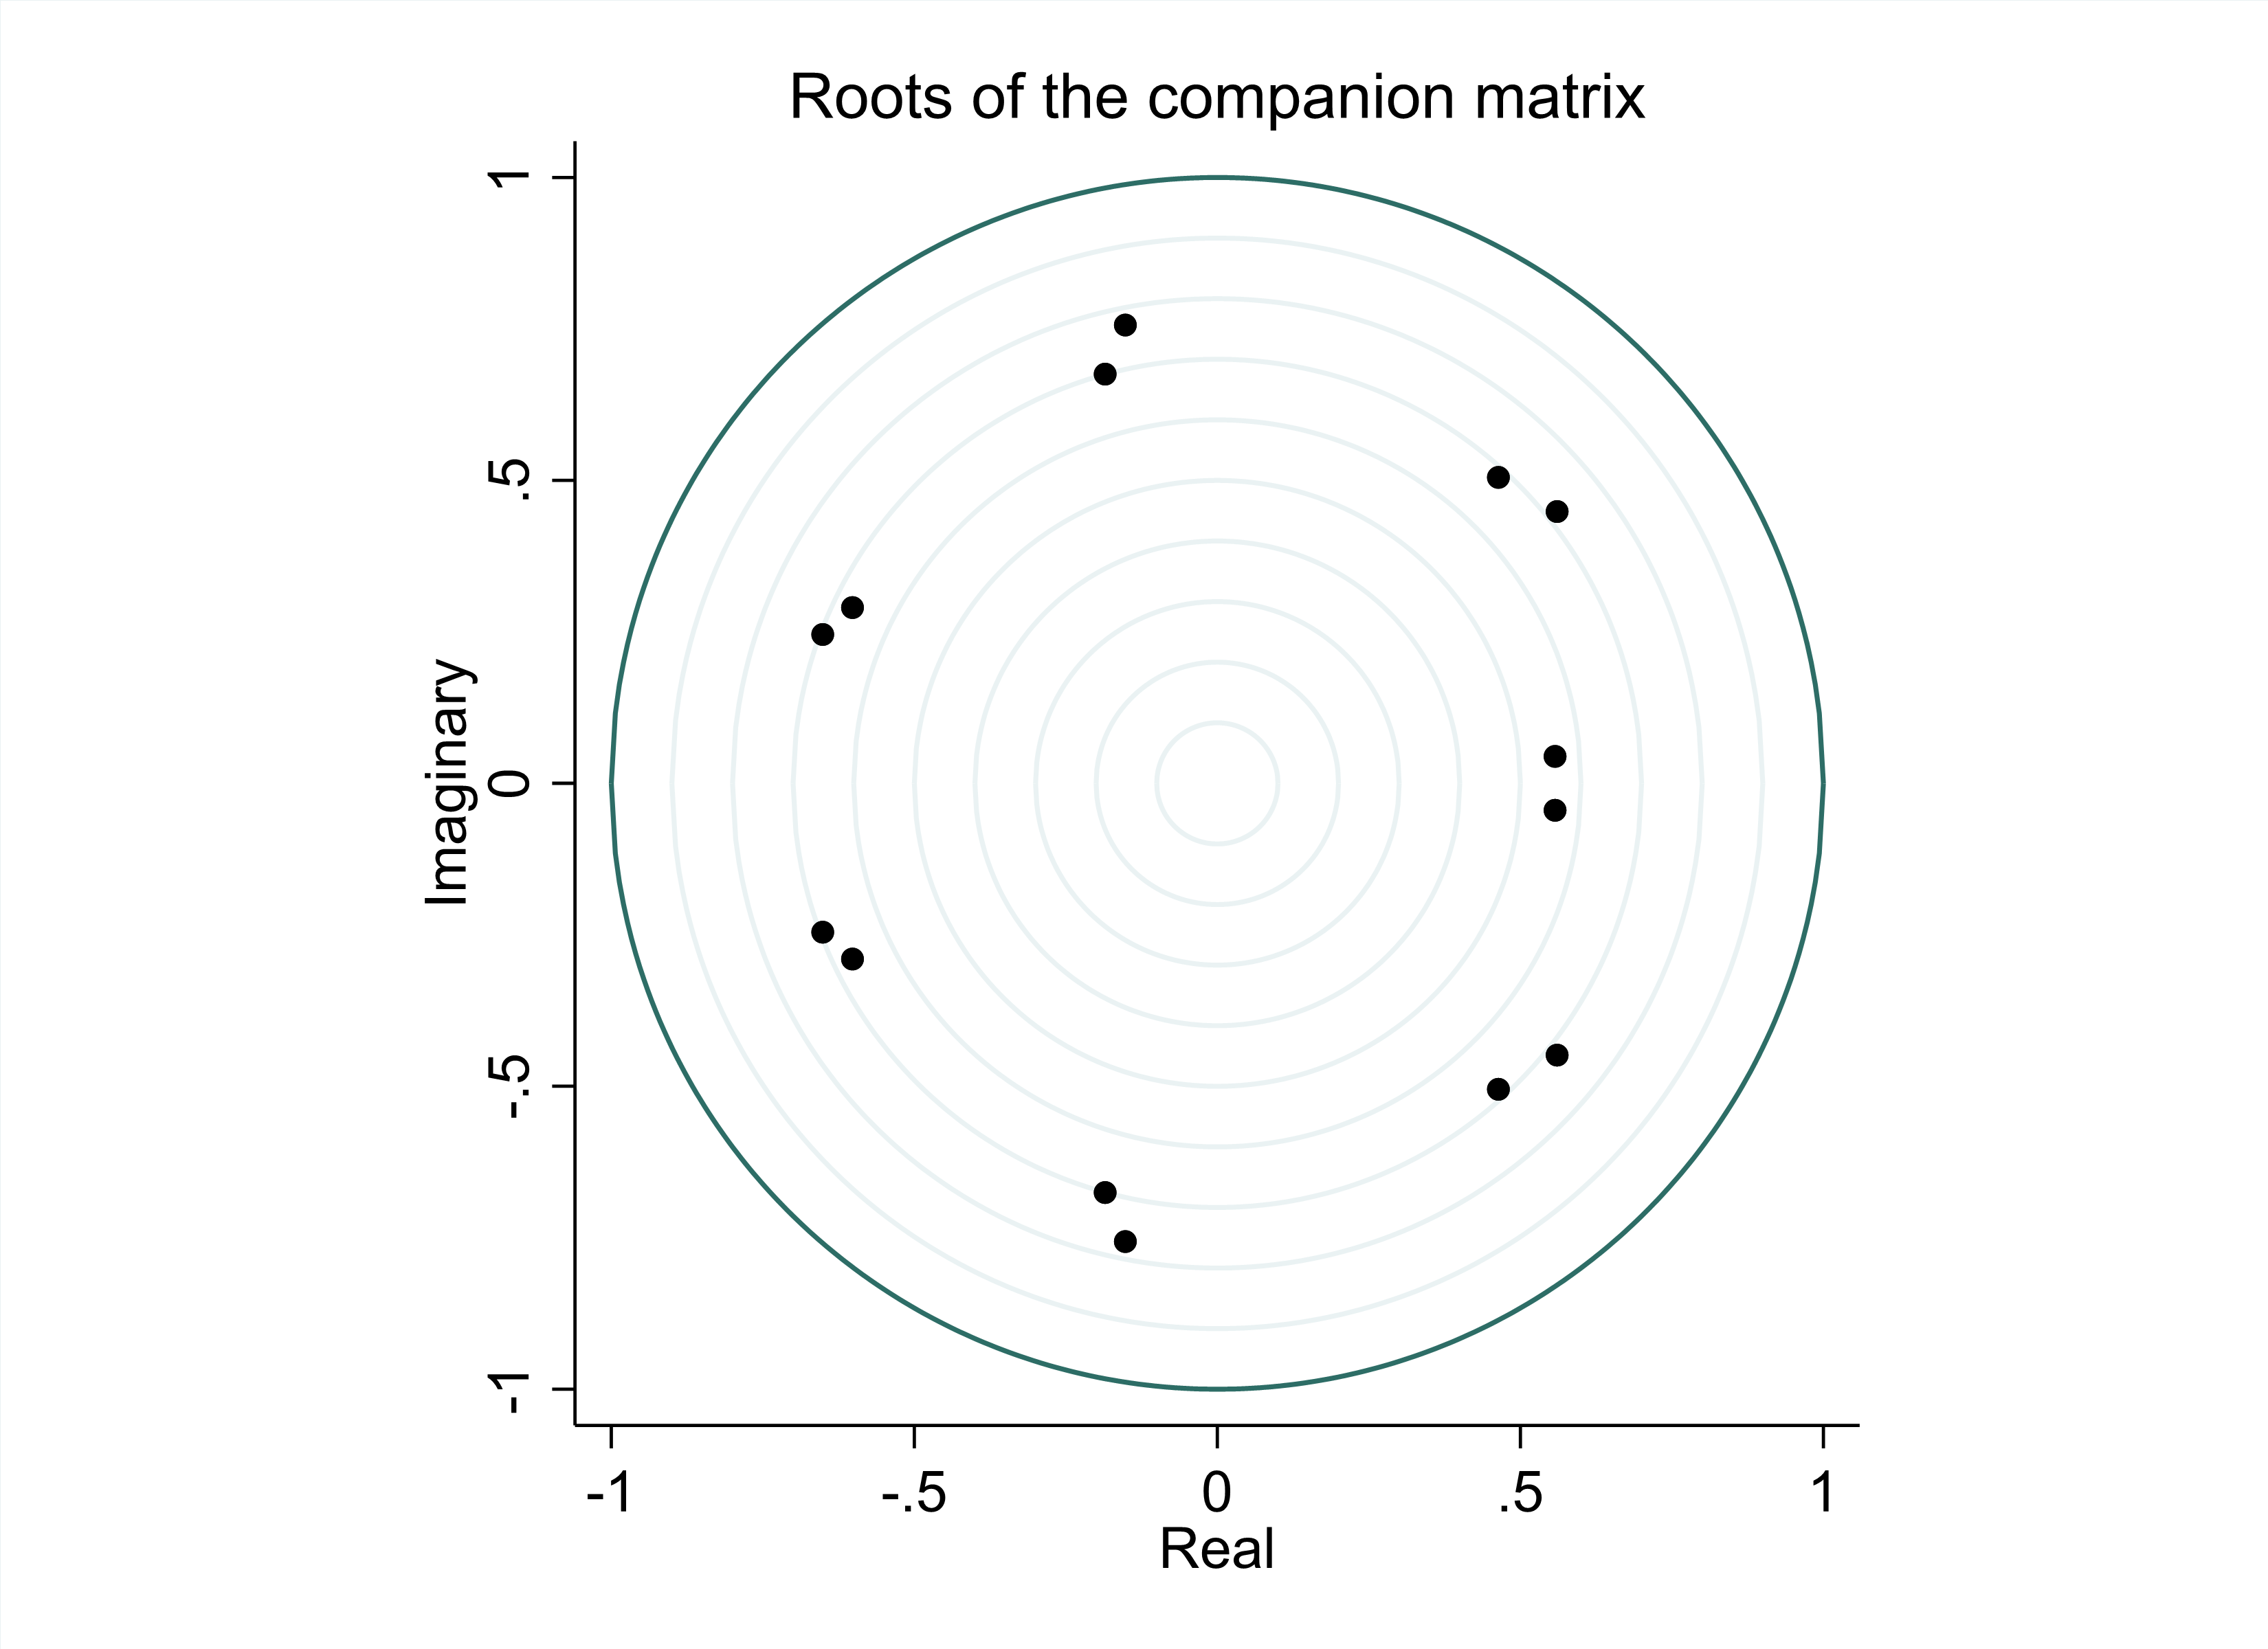
The Weak Stationarity Test in Table 2 shows that Index is not smooth, while Return has a p-value of 0, thus rejecting the original hypothesis and is smooth. Hence in this paper Return is modeled instead of Index. In Table 2 since other orders are 0, we modeled with 7th order. This results in Figure 1. From Figure 1 it is easy to see that all the points fall inside the circle, indicating that this model is stable.
|
|
|
Figure 1: Unit root test |
|
Photo credit: Original |
3.2.Pulse Response of Returns in Stock and Futures Markets
Correspondence between impulse wave and stock price trend stage
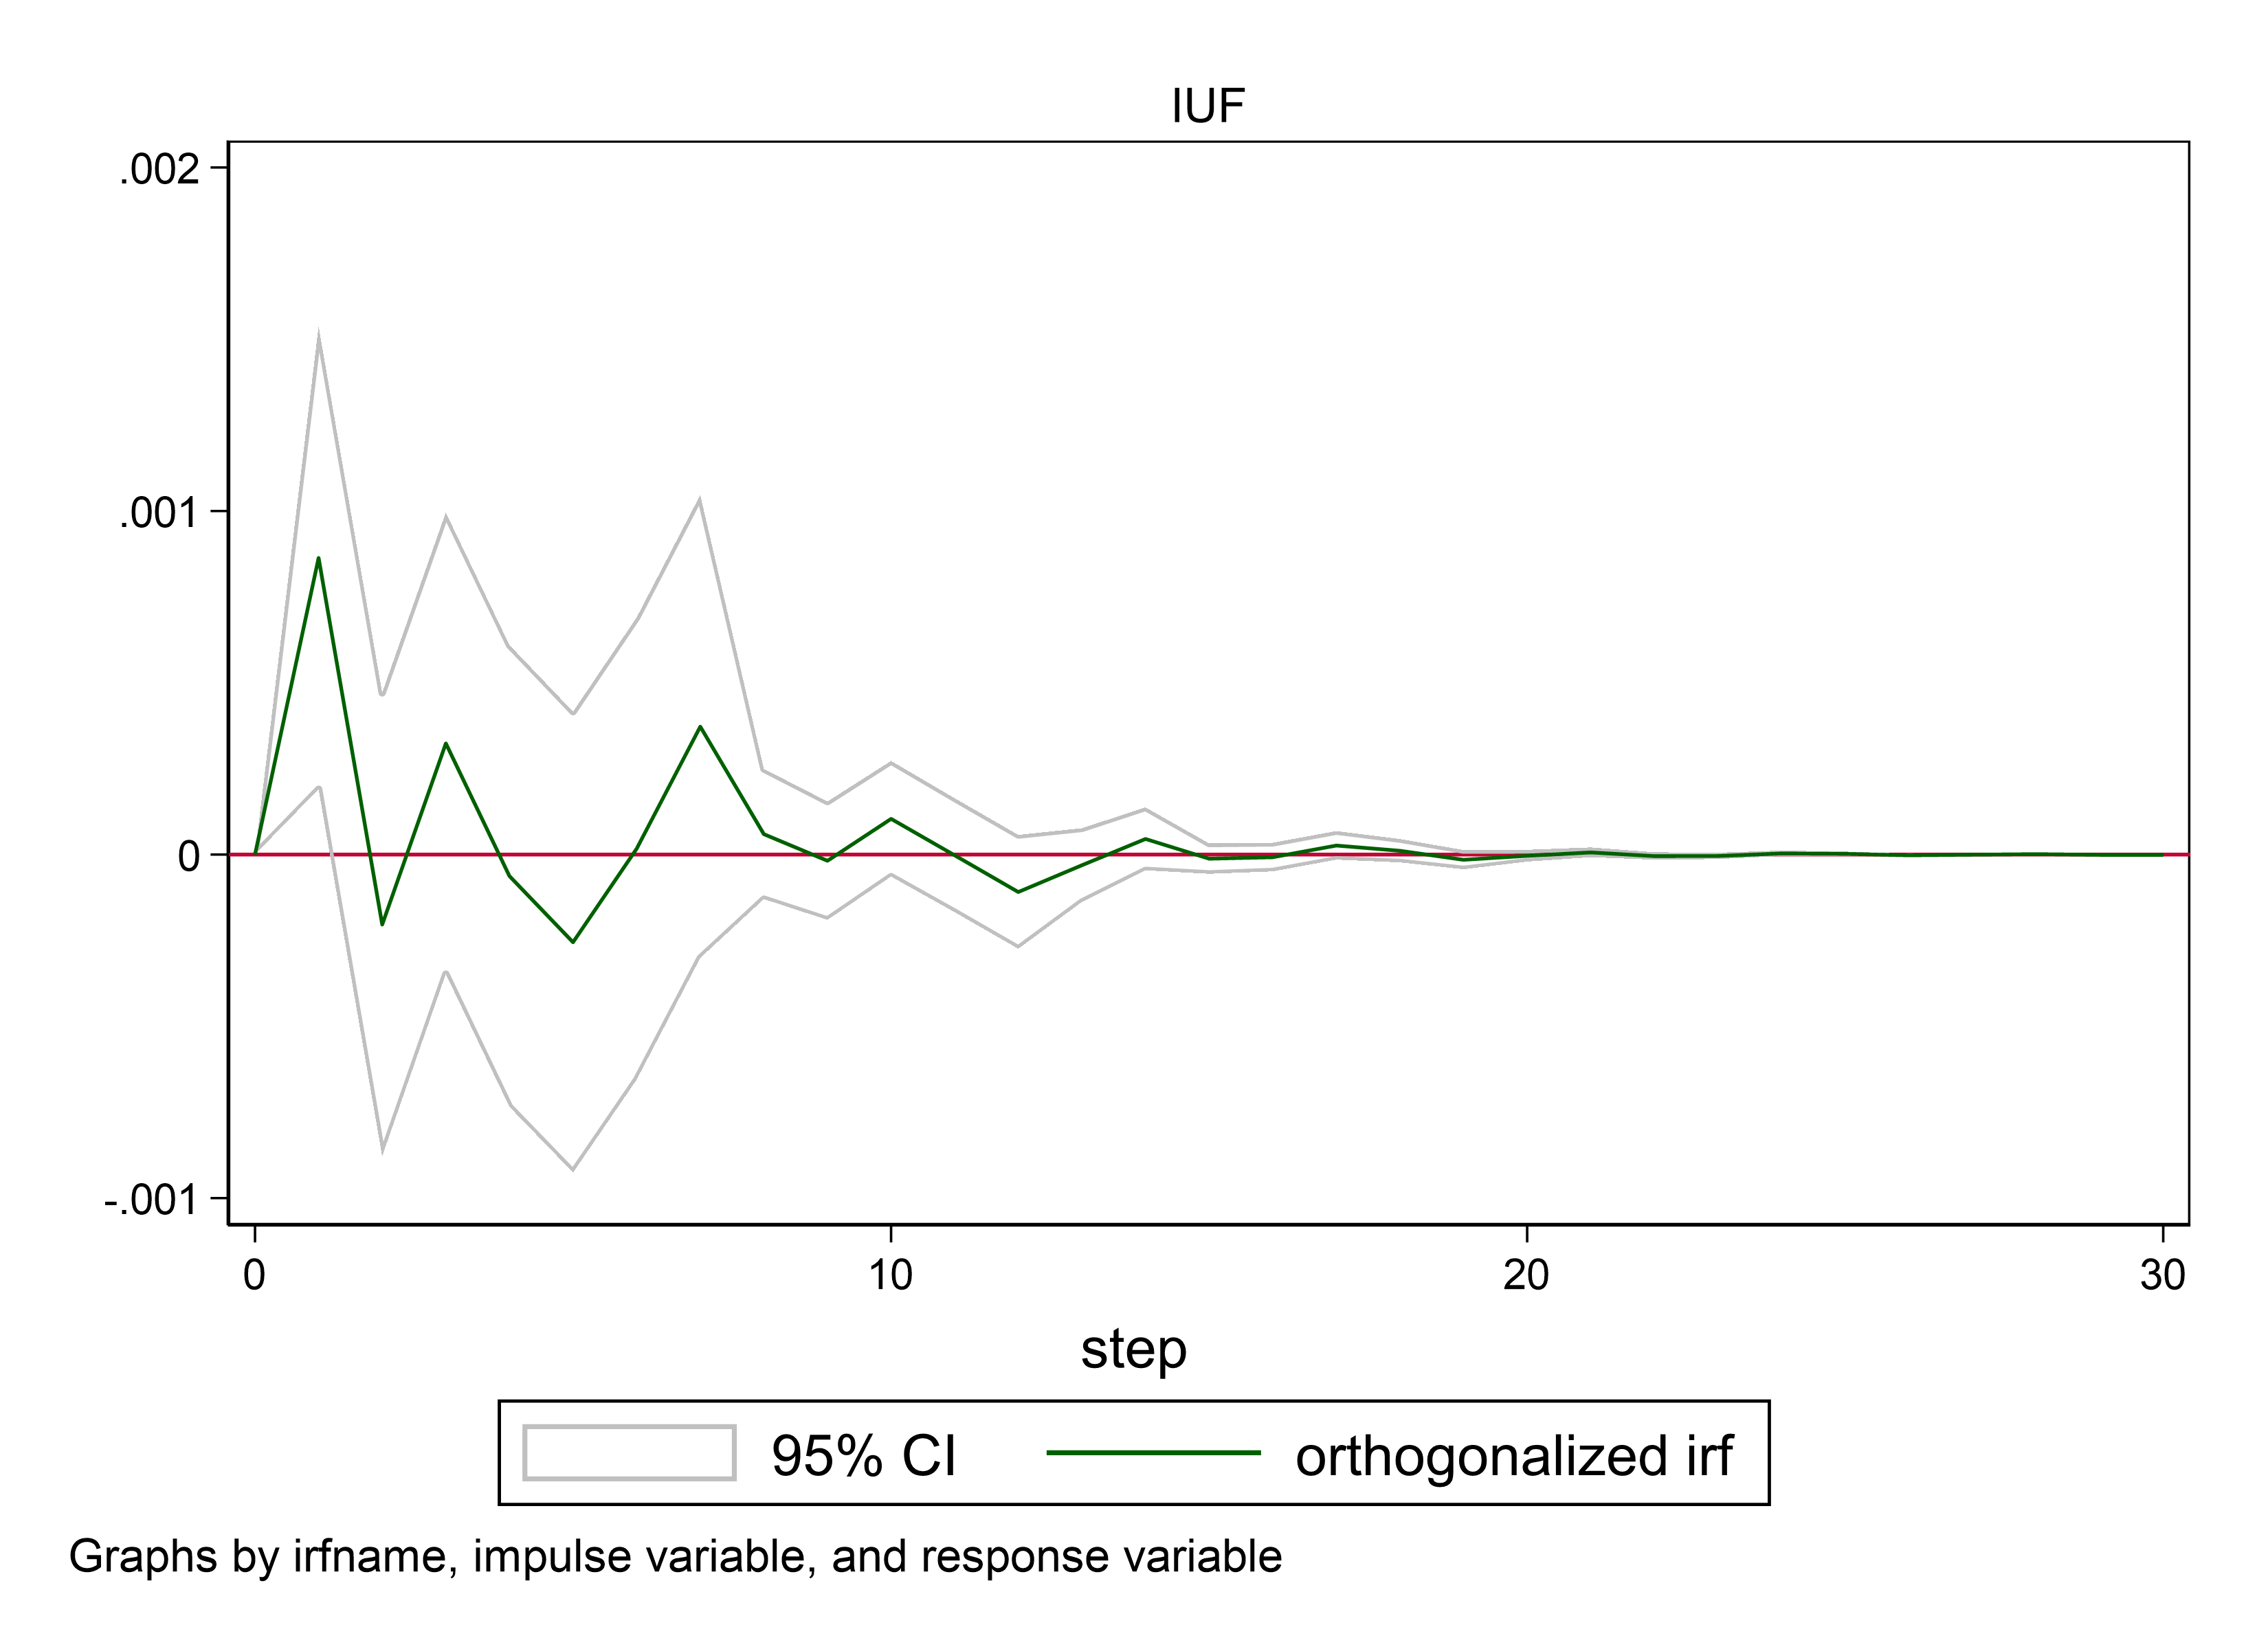
1. in the first impulse response plot, the impulse variable is CCICFI and the response variable is SSEC. when CCICFI floats upward, SSEC is basically positive.
2. In the second impulse response graph (Figure 2), the impulse variable changes to SSEC and the response variable changes to CCICFI. when SSEC floats upward, CCICFI is basically positive.
From this, it can be basically judged that CCICFI and SSEC influence each other.
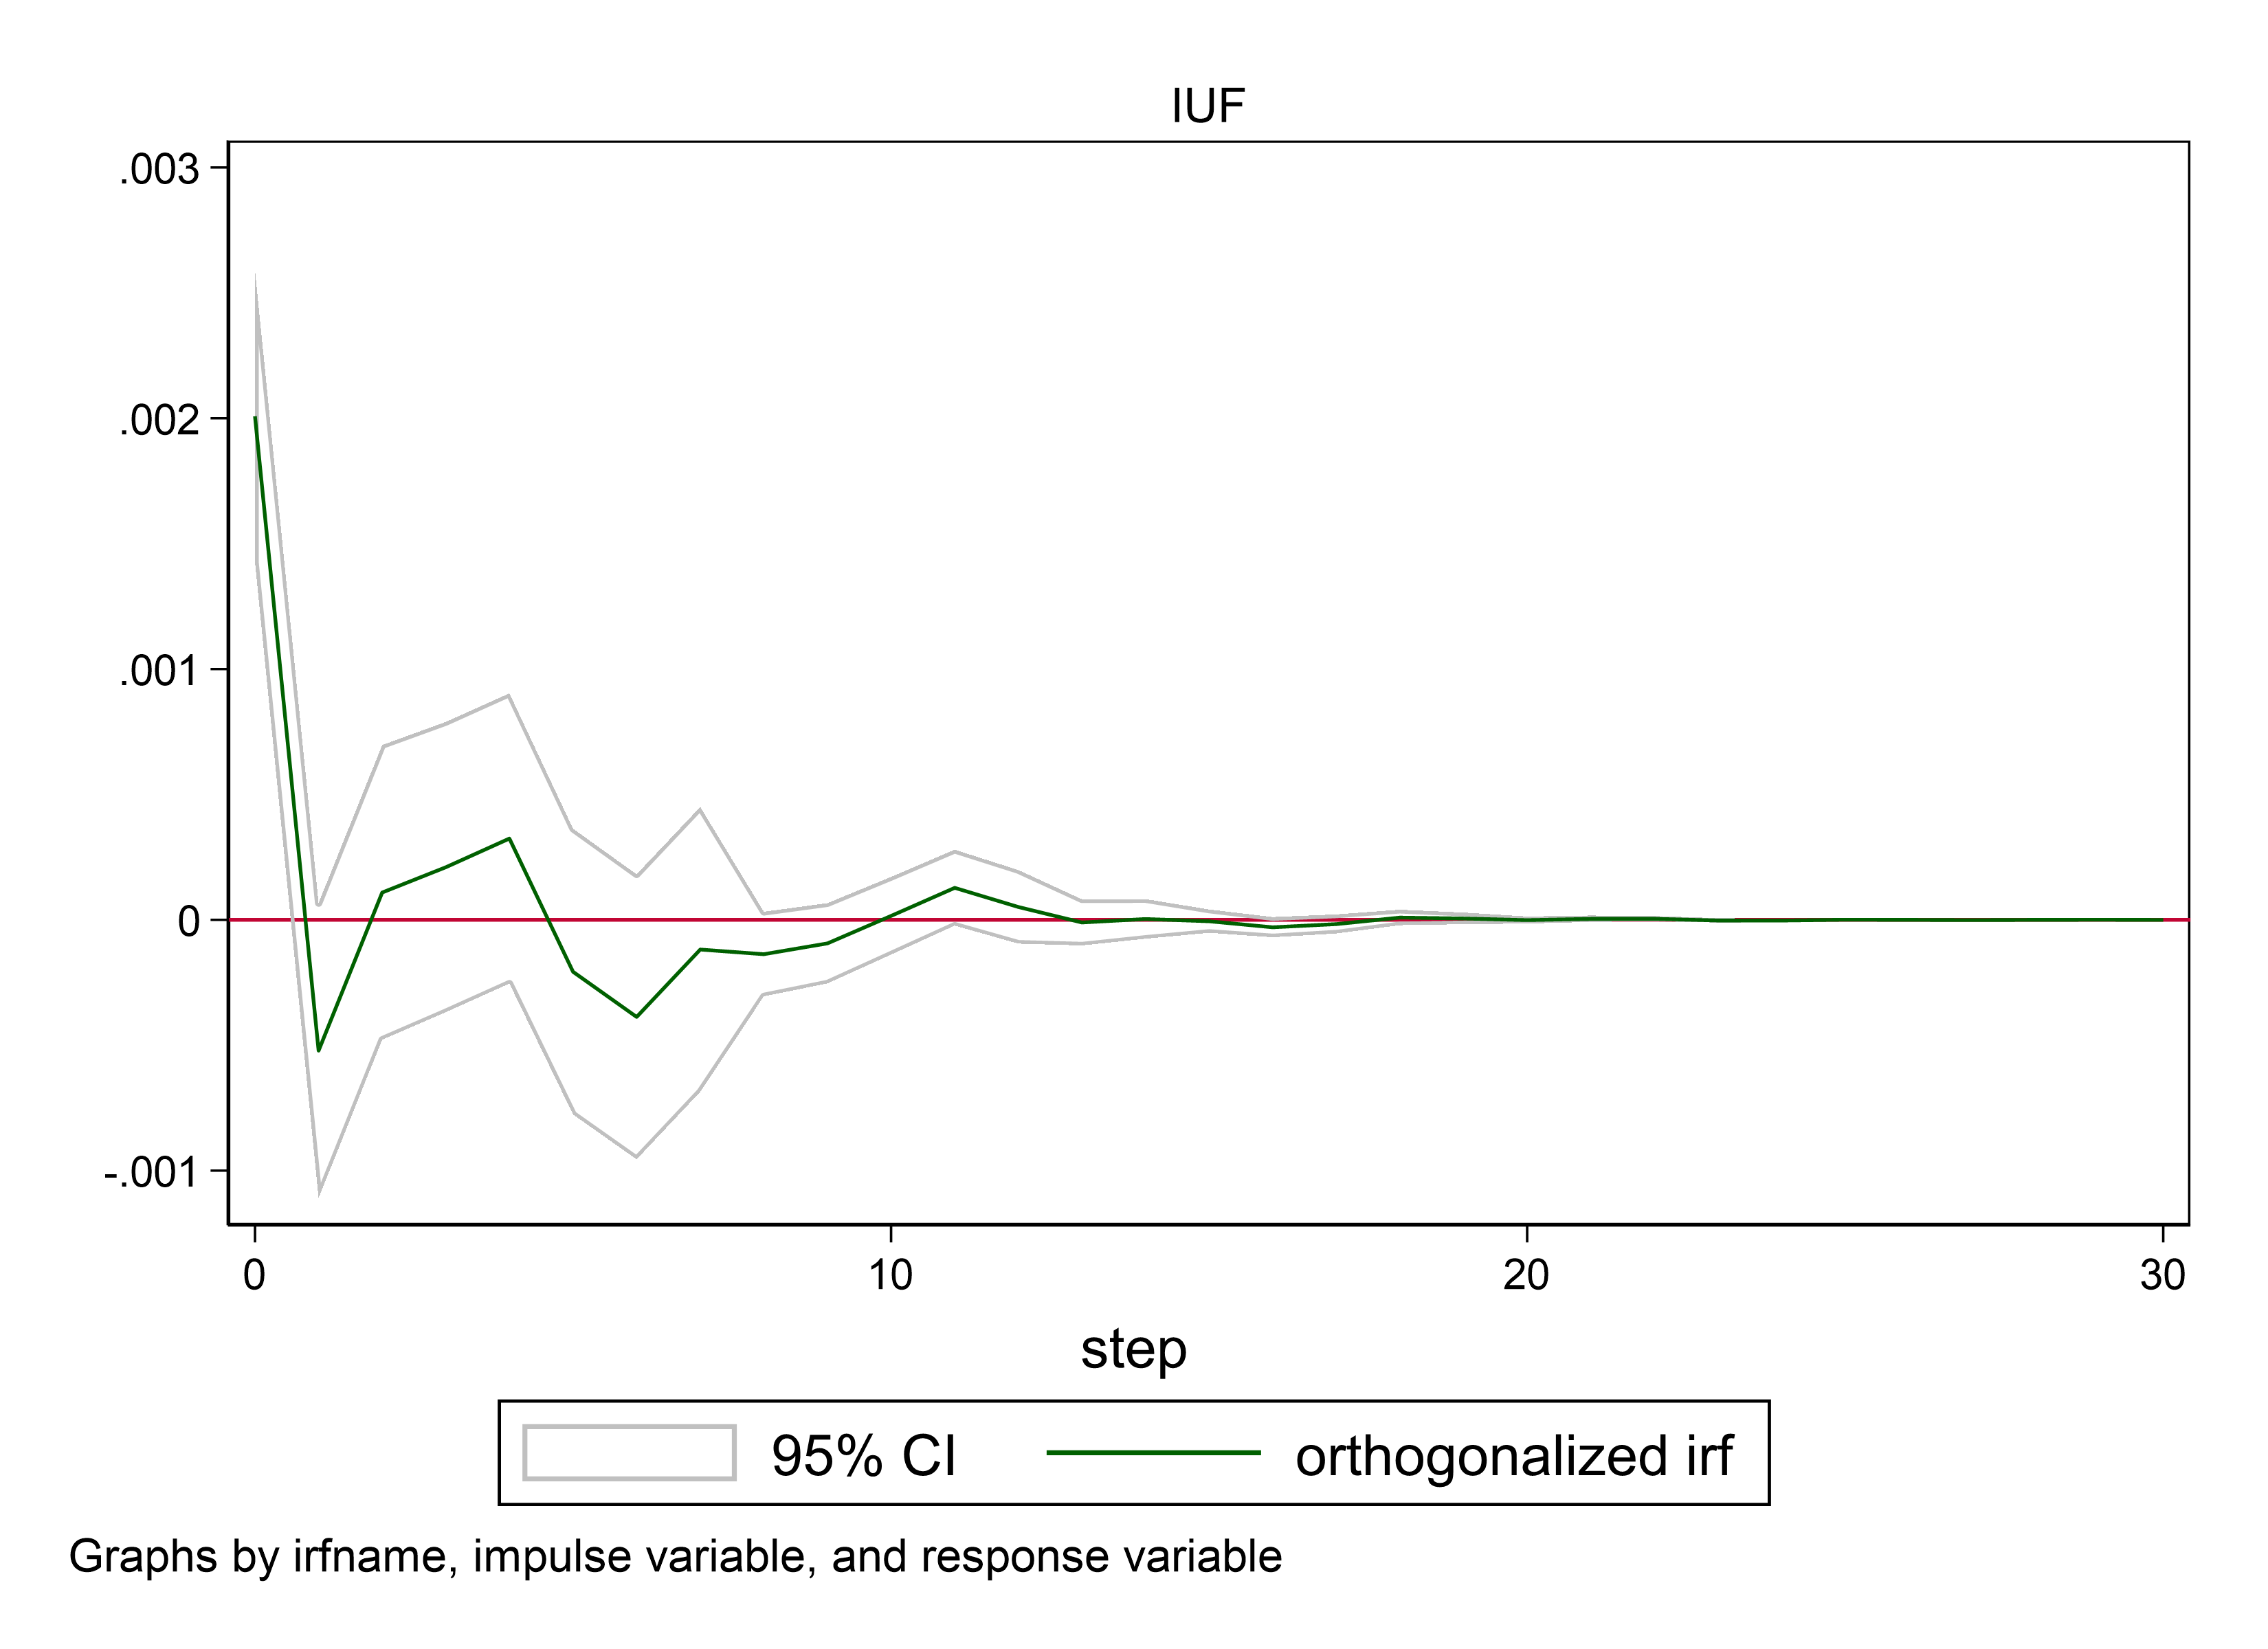
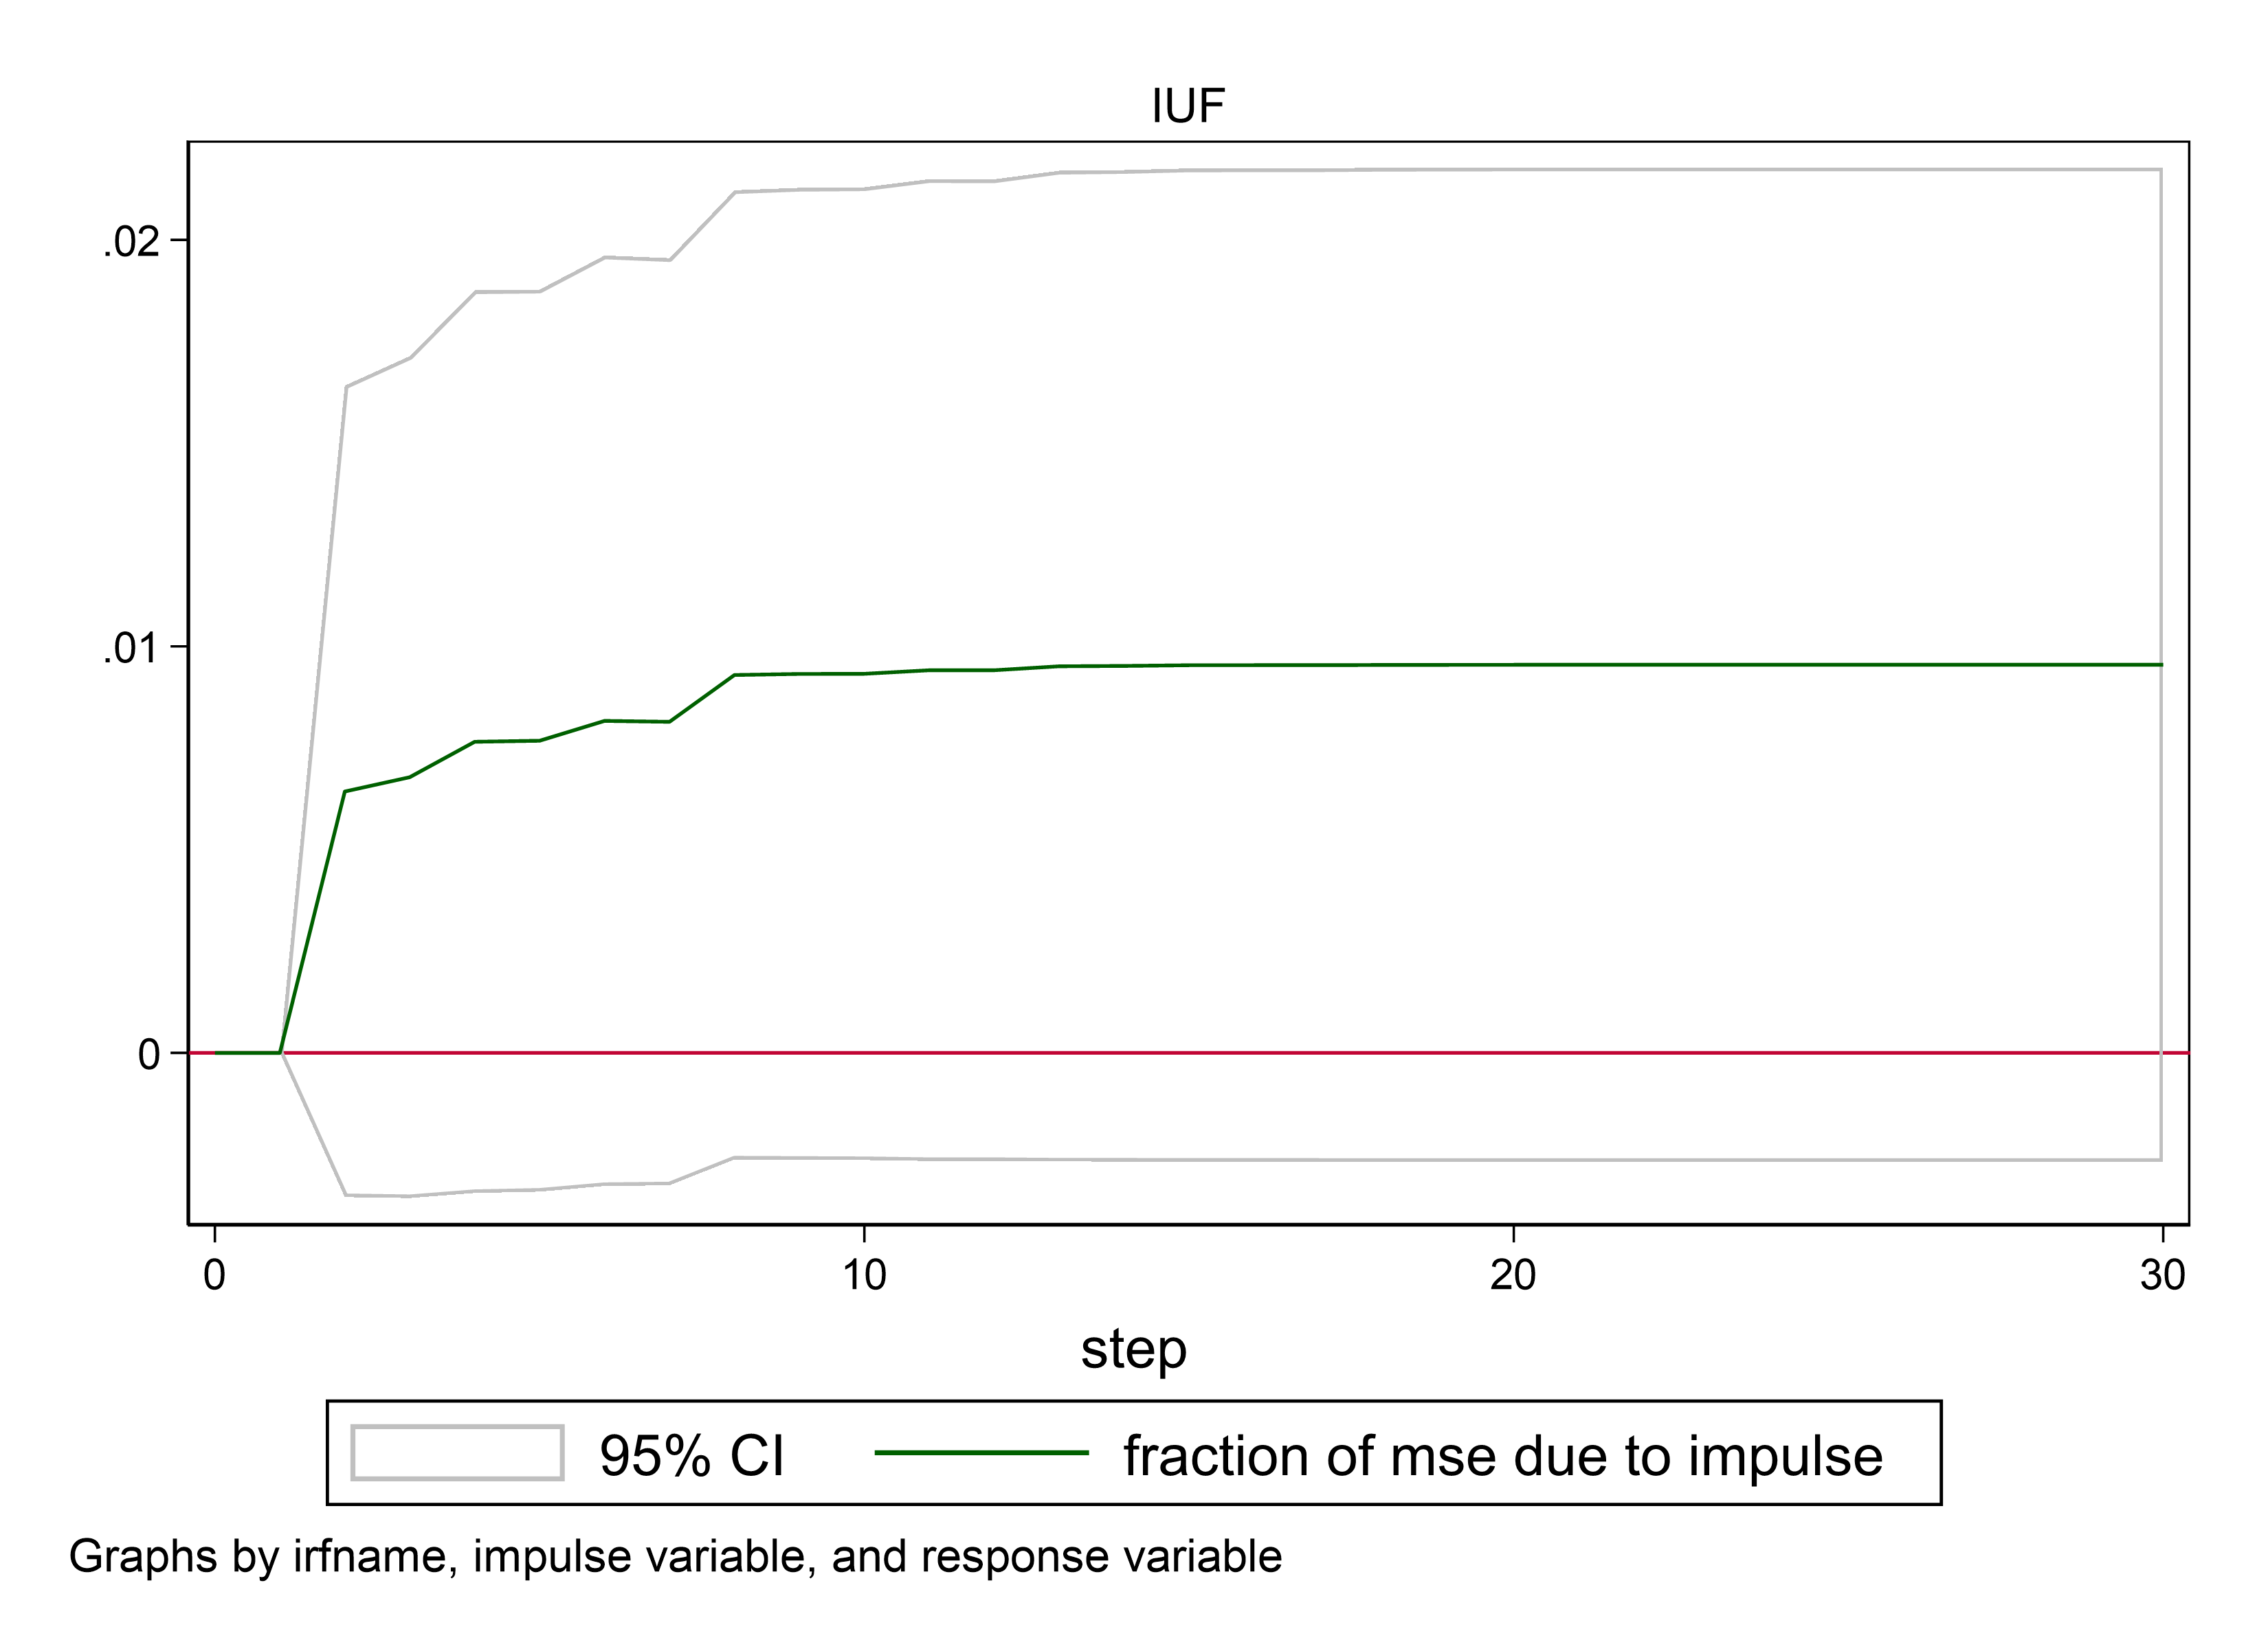
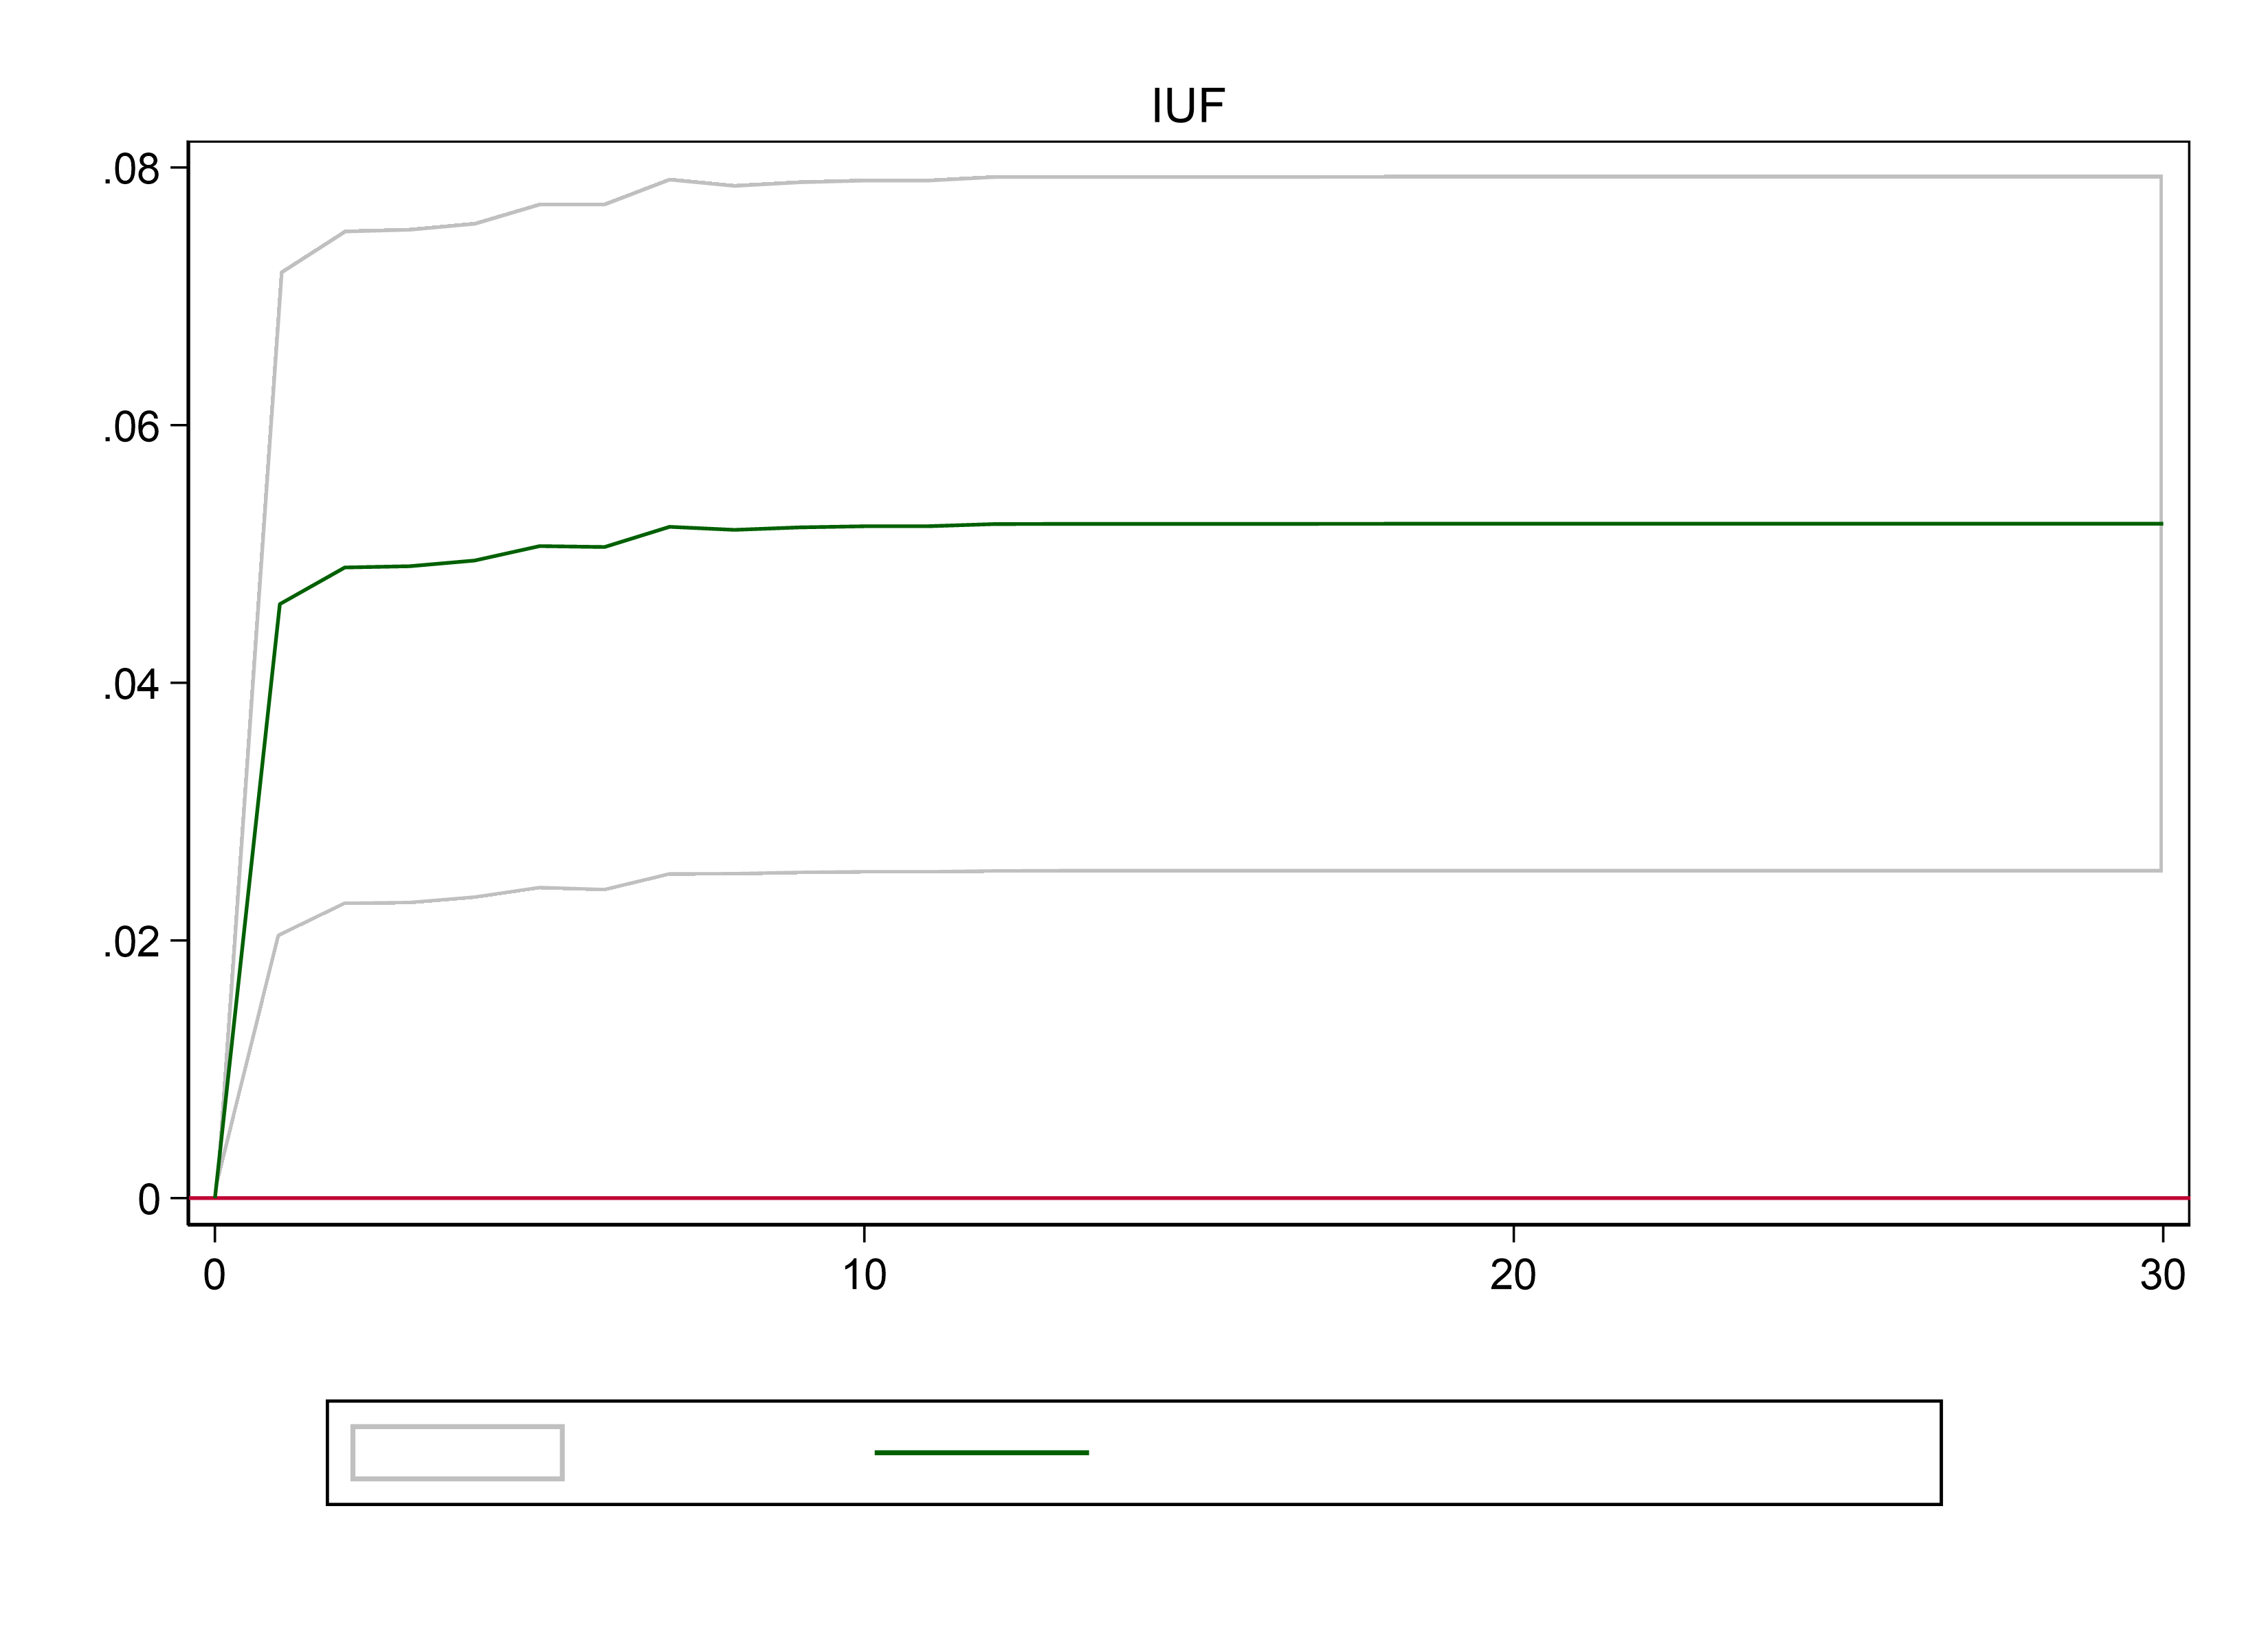
3. Observe the cumulative effect chart in Figure 3. The impulse variable in the first sub-chart is CCICFI, and the response variable is SSEC, i.e., the effect of the futures index on the SSE. It can be seen that the cumulative effect is close to one percent.
4. In the second subplot, the impulse variable changes to SSEC and the response variable changes to CCICFI, i.e., the effect of the SSE on the futures index. The cumulative effect is about five percent.
From this, it is easy to conclude that the effect of the SSE on the futures index is greater than the effect of the futures index on the SSE.
|
Respond variable: SSEC Impulse variable: CCICFI |
Respond variable: CCICFI Impulse variable: SSEC |
|
|
|
|
Figure 2: Impulse and response |
|
|
Photo credit: Original |
|
|
Respond variable: SSEC Impulse variable: CCICFI |
Respond variable: CCICFI Impulse variable: SSEC |
|
|
|
|
Figure 3: Cumulative response |
|
|
Photo credit: Original |
|
3.3.ARMA-GARCH-X
GARCH modeling and testing 1. Table 3 (1) represents the variance equation of SSEC i.e. volatility of SSEC. When CCICFI fluctuates, the p-value is only 0.001, indicating that when the volatility of CCICFI increases, it decreases the volatility of SSEC.
2. In Table 3 (2), when SSEC fluctuates, the P-value is 0.136 which is greater than 0.1, it is not difficult to show that the volatility of SSEC has no effect on the volatility of CCICFI.
In both tables, the P-value of ARCH and GARCH of SSEC and CCICFI is 0, which indicates that the ARCH and GARCH effects of the two are very obvious, i.e., there is a very obvious conditional heteroskedasticity. Therefore, this model can be constructed.
In Table 3, we can summarize that the volatility of CCICFI does not cause the volatility of SCEC to fluctuate positively with it, but causes the volatility of SSEC to fall when the volatility of CCICFI rises. the volatility of SSEC is not affected by the volatility of CCICFI.
Table 3: ARMA-GARCHX regression: variance equation
|
(1) |
(2) |
|||||
|
SSEC |
CCICFI |
|||||
|
Coef. |
Std. Err. |
P |
Coef. |
Std. Err. |
P |
|
|
SSEC, variance |
56.45184 |
37.86595 |
0.136 |
|||
|
CCICFI, variance |
-106.8525 |
32.78278 |
0.001 |
|||
|
ARCH |
.0540208 |
.0074048 |
0.000 |
.036513 |
.0078406 |
0.000 |
|
GARCH |
.9340477 |
.0074132 |
0.000 |
.9610875 |
.0076537 |
0.000 |
|
Constant |
-12.74237 |
.2918007 |
0.000 |
-16.89575 |
2.130899 |
0.000 |
4.Discussion
This academic research study endeavors to conduct a comprehensive analysis of the relationship between the stock and futures markets in the Chinese financial market from 2016 to 2019. The purpose of this research is to examine the intricate dynamics between these two markets and how they influence each other. The analysis will focus on understanding how changes in stock prices can affect the futures market and vice versa. Previous studies have utilized econometric models like the GARCH model to investigate market volatility. However, this research aims to take a closer look at the unique dynamics of the Chinese stock and futures markets during the specified period, taking into consideration contextual factors that may affect the correlation between the two markets. By doing so, this study aims to provide a more in-depth understanding of the Chinese financial market and its complex interrelationships.
Moreover, this study advocates for creating personalized risk management and investment strategies based on the peculiarities of this specific market. By doing so, investors can gain a deeper understanding of the market's characteristics and develop more effective strategies for managing risk and maximizing returns.
Furthermore, this research confirms the practicality of utilizing the ARMA-GARCH model as an analytical tool for examining logarithmic daily return series. This model can help investors and researchers better comprehend and predict market volatility, and thus make more informed investment decisions.
Although this research may not have a direct impact on policy-making processes, it can provide valuable insights into the connection between stock and futures markets. These insights can assist in shaping market regulation and stability policies and contribute to the larger conversation on financial market dynamics and their implications for diverse stakeholders. Therefore, this study is significant not only for academics but also for investors, policymakers, and other stakeholders in the financial industry.
5.Conclusion
This research paper delves into the intricate relationship between the stock market and futures market prices in China from 2016 to 2019. The study aims to provide a detailed analysis of how these markets are interconnected, using advanced econometric models such as VAR and ARMA-GARCHX. By leveraging these models, this research will be able to uncover hidden patterns and relationships that exist in the data, shedding light on the dynamics of these markets and their impact on the broader economy.
A study conducted on the Chinese stock market during the aforementioned period yielded two noteworthy findings. Firstly, it was observed that fluctuations in the stock market had a significant impact on the futures market, indicating a degree of interdependence between these two markets. Secondly, the research revealed that changes in the futures market had a relatively lesser effect on the stock market. This asymmetry in influence provides valuable insights into the dynamics of how these markets interact and respond to external factors, which could be useful for market analysts and investors seeking to optimize their investment strategies.
It is imperative for investors to be cognizant of the significant impact that the stock market can have on the futures market. Such an awareness can aid investors in making well-informed decisions and devising personalized strategies to manage risks effectively. A sound comprehension of the correlation between these two markets is of utmost importance in the creation of robust investment approaches in the Chinese financial landscape. As such, it is recommended that investors take this correlation into account while developing their investment strategies and risk management techniques.
Authors Contribution
All the authors contributed equally and their names were listed in alphabetical order.
References
[1]. Chen JL, Zhang W. (2002). A unified model for CVaR and portfolio optimization. Application of System Engineering Theory and Methods, (01):68-71.
[2]. Liu J.-S. (2007) Comparative study of VaR and CVaR based on risk measurement theory. Quantitative and Technical Economic Research, (03):125-133.
[3]. CHEN Shoudong, YU Shidian. (2002). Analysis of Chinese stock market based on Va R method of GARCH model. Journal of Social Sciences of Jilin University, (04):11-17.
[4]. AN Ningning,HAN Zhaozhou. Comparison of Vector GARCH Family Models for Calculating Portfolio Value at Risk (Va R) in Chinese Financial Markets
[5]. Li Jianfei. Research on U.S. (2005). Real Estate Trust Funds and Implications for China. International Financial Research, (01):48-53.
[6]. Daniel B. Nelson.(1990) Stationarity and Persistence in the GARCH(1,1) Model. Econometric Theory.(06): 318-334
[7]. Ye Qing. (2000). VaR model based on GARCH and semiparametric method and its application in risk analysis of Chinese stock market[J]. Statistical Research, (12):25-29.
[8]. Zou Jianjun, Zhang Zongyi, Qin Zheng. (2003). Application of GARCH model in calculating the value at risk of China's stock market[J]. Systems Engineering Theory and Practice, (05):20-25+135.
[9]. LIU Qingfu,ZHONG Weijun,MEI Shu'e. (2006) .A study on risk measurement of China's copper futures market based on Va R-GARCH model family. Journal of Systems Engineering, (04):429-433.
[10]. Yuan Chunling.(2019).Empirical analysis of the market risk of China's Hong Kong REITs based on ARMA-GARCH model family. Xiamen University.
[11]. GUO Xiaoting. (2005).An empirical study on the market risk of China's securities investment funds based on GARCH model. International Finance Research, (10):55-59.
[12]. Gou Hongjun, Chen Xun, Hua Congjun.(2015).Research on foreign exchange portfolio risk measurement based on GARCH-EVT-COPULA model. Journal of Management Engineering, ,29(01):183-193.
Cite this article
Feng,Y.;Zhang,K.;Zhu,H. (2023). Analysis of Stock and Futures Price Fluctuations Based on Mathematical Model. Advances in Economics, Management and Political Sciences,65,1-8.
Data availability
The datasets used and/or analyzed during the current study will be available from the authors upon reasonable request.
Disclaimer/Publisher's Note
The statements, opinions and data contained in all publications are solely those of the individual author(s) and contributor(s) and not of EWA Publishing and/or the editor(s). EWA Publishing and/or the editor(s) disclaim responsibility for any injury to people or property resulting from any ideas, methods, instructions or products referred to in the content.
About volume
Volume title: Proceedings of the 2nd International Conference on Financial Technology and Business Analysis
© 2024 by the author(s). Licensee EWA Publishing, Oxford, UK. This article is an open access article distributed under the terms and
conditions of the Creative Commons Attribution (CC BY) license. Authors who
publish this series agree to the following terms:
1. Authors retain copyright and grant the series right of first publication with the work simultaneously licensed under a Creative Commons
Attribution License that allows others to share the work with an acknowledgment of the work's authorship and initial publication in this
series.
2. Authors are able to enter into separate, additional contractual arrangements for the non-exclusive distribution of the series's published
version of the work (e.g., post it to an institutional repository or publish it in a book), with an acknowledgment of its initial
publication in this series.
3. Authors are permitted and encouraged to post their work online (e.g., in institutional repositories or on their website) prior to and
during the submission process, as it can lead to productive exchanges, as well as earlier and greater citation of published work (See
Open access policy for details).
References
[1]. Chen JL, Zhang W. (2002). A unified model for CVaR and portfolio optimization. Application of System Engineering Theory and Methods, (01):68-71.
[2]. Liu J.-S. (2007) Comparative study of VaR and CVaR based on risk measurement theory. Quantitative and Technical Economic Research, (03):125-133.
[3]. CHEN Shoudong, YU Shidian. (2002). Analysis of Chinese stock market based on Va R method of GARCH model. Journal of Social Sciences of Jilin University, (04):11-17.
[4]. AN Ningning,HAN Zhaozhou. Comparison of Vector GARCH Family Models for Calculating Portfolio Value at Risk (Va R) in Chinese Financial Markets
[5]. Li Jianfei. Research on U.S. (2005). Real Estate Trust Funds and Implications for China. International Financial Research, (01):48-53.
[6]. Daniel B. Nelson.(1990) Stationarity and Persistence in the GARCH(1,1) Model. Econometric Theory.(06): 318-334
[7]. Ye Qing. (2000). VaR model based on GARCH and semiparametric method and its application in risk analysis of Chinese stock market[J]. Statistical Research, (12):25-29.
[8]. Zou Jianjun, Zhang Zongyi, Qin Zheng. (2003). Application of GARCH model in calculating the value at risk of China's stock market[J]. Systems Engineering Theory and Practice, (05):20-25+135.
[9]. LIU Qingfu,ZHONG Weijun,MEI Shu'e. (2006) .A study on risk measurement of China's copper futures market based on Va R-GARCH model family. Journal of Systems Engineering, (04):429-433.
[10]. Yuan Chunling.(2019).Empirical analysis of the market risk of China's Hong Kong REITs based on ARMA-GARCH model family. Xiamen University.
[11]. GUO Xiaoting. (2005).An empirical study on the market risk of China's securities investment funds based on GARCH model. International Finance Research, (10):55-59.
[12]. Gou Hongjun, Chen Xun, Hua Congjun.(2015).Research on foreign exchange portfolio risk measurement based on GARCH-EVT-COPULA model. Journal of Management Engineering, ,29(01):183-193.