


1. Introduction
In the stock market, stock price predictable study has always been a very fascinating area and the researchers are always looking to improve existing prediction models to get more accurate forecasting results. This is because accurate stock price forecasts are critical in the financial sector as they guide investment decisions, reduce risk, facilitate portfolio management, influence corporate finance, develop trading strategies, improve market efficiency, and can be used as economic indicators [1]. Organizations and individuals with the ability of investment decision-making can easily make giant profits from the stock market if they are able to anticipate the stock price that they can make plans and develop effective strategy [2]. However, predicting stock prices has always been difficult for both investors and experts due to several factors which is unrelated to the stock market, such as the overall economic situation of the world, price indices of goods, the development of the country, investor’s psychology, political factors and so on [3].
Traditional forecasting approaches are mostly used to analysis the stock price trend based on economic data, formulation and so on. There are two typical traditional method: technical analysis and Fundamental Analysis. The time series of stock prices serves as the foundation for the technical analysis technique. On the other hand, in the fundamental analysis, trading decision-making relies on the financial condition and macroeconomic indicators of a company such as EBITDA, sales, dividend yield, and return on equity. Fundamental researchers will calculate the business value of a company's stock based on these indices, and then investors will increase holdings when the value is bigger than the market price, and conversely sell the stock when they believe the company's value is not as high as the market price [4]. However, these methods always provide limited information and predicting accuracy. Nowadays, programmable forecasting techniques have shown to be more accurate at anticipating stock values as machine learning and deep learning prediction tools improve [5-6]. More and more analysts and investors are looking at applying machine learning algorithms to forecast the stock price.
In this article, the Long Short-term Memory Neural Networks method is used which has become the focus of the area of machine learning and has been widely employed in various tasks like speech recognition, acoustic modeling, trajectory prediction, sentence embedding, and association analysis due to its powerful and effective learning capabilities [7-8]. This article applies LSTM method to Google's price prediction, and the results show that machine learning methods perform well in stock price prediction.
2. Data
2.1. Data Selection
Google which is a subsidiary company of Alphabet Inc. is one of the most influential and famous technology companies in the world. Google was first largely recognized for its Internet search engine, but it has since expanded into a wide range of other fields and has grown to be a dominating player in the technology sector. The fact that Google is the most extensively used search engine in the world, that Google Cloud offers cloud infrastructure and services to companies, and that it is at the forefront of artificial intelligence and machine learning research all contribute to Google's enormous impact in the IT sector. As a result, Google's stock price is representative of the technology industry.
This paper collected the stock price from Yahoo finance for a long period from January 1st, 2000, to September 1st, 2023, as the datasets for training and testing the LSTM model.
2.2. Data Preprocessing
This paper used Google's closing prices as a dataset. Firstly, this paper removed all the null values from the data to avoid affecting the subsequent processing.
Next, this paper normalized the data. To create a generic prediction model for categorization problems, machine learning algorithms need a high-quality dataset. Normalization involves adjusting and modifying the data in the training set to ensure that each feature is given equal weight [9-10]. The effectiveness of the machine learning algorithm is enhanced by the data normalizing conduction.
After data normalization, the study divides the dataset into a training set and a testing set. About four fifths of the data are set aside for training and optimizing the LSTM model, in contract, the rest of data are used to test the predictions made by the model. To feed the sequential nature of stock price data into the LSTM model, sequences of data are created. This involves organizing the data into overlapping segments, where each segment has a specified number of time steps, referred to as the sequence length. In this essay, a sequence length of 60 was chosen as a reasonable balance between capturing relevant historical patterns and maintaining computational efficiency. These sequences enable the model to learn from past price movements and attempt to forecast future prices based on historical trends. The LSTM model is trained using these sequences, optimizing its internal weights to make accurate predictions.
3. Model Construction and training
The LSTM model is built sequentially, consisting of multiple layers, each with a specific purpose. It begins with an initial LSTM layer with 50 units, which is responsible for processing the sequential input data and learning relevant patterns. This is followed by additional LSTM layers, also with 50 units each, to further refine the model's understanding of intricate temporal relationships within the data. At last, the study adds a dense layer that contains a single unit to this model to provide the output prediction.
Subsequently, the model is configured with the 'adam' optimizer and 'mean squared error' as the loss functions. With the architecture defined and the optimization strategy specified, the model is ready for training. In the process of training, the model will learn to minimize the error between its forecasts and the actual stock prices from the training data. It can iteratively scale and alter its internal weights to approximate the underlying patterns in the data. This training phase, crucial to the model's performance, is conducted over multiple epochs, with each epoch representing one complete pass through the training data. The batch size, set at 32 in this essay, determines the number of data samples used in each update of the model's weights, influencing both training speed and stability.
4. Result and Discussion
The results come out from the best model shows that the relative error is small. This paper compared the predicted stock price obtained from running the optimal model with the actual stock price and plotted a line graph which indicates the actual price of the stock in blue and the predicted value of the stock price in red (See Figure 1). As the graph shows, the overall trend of predicting result and the actual value is nearly identical.
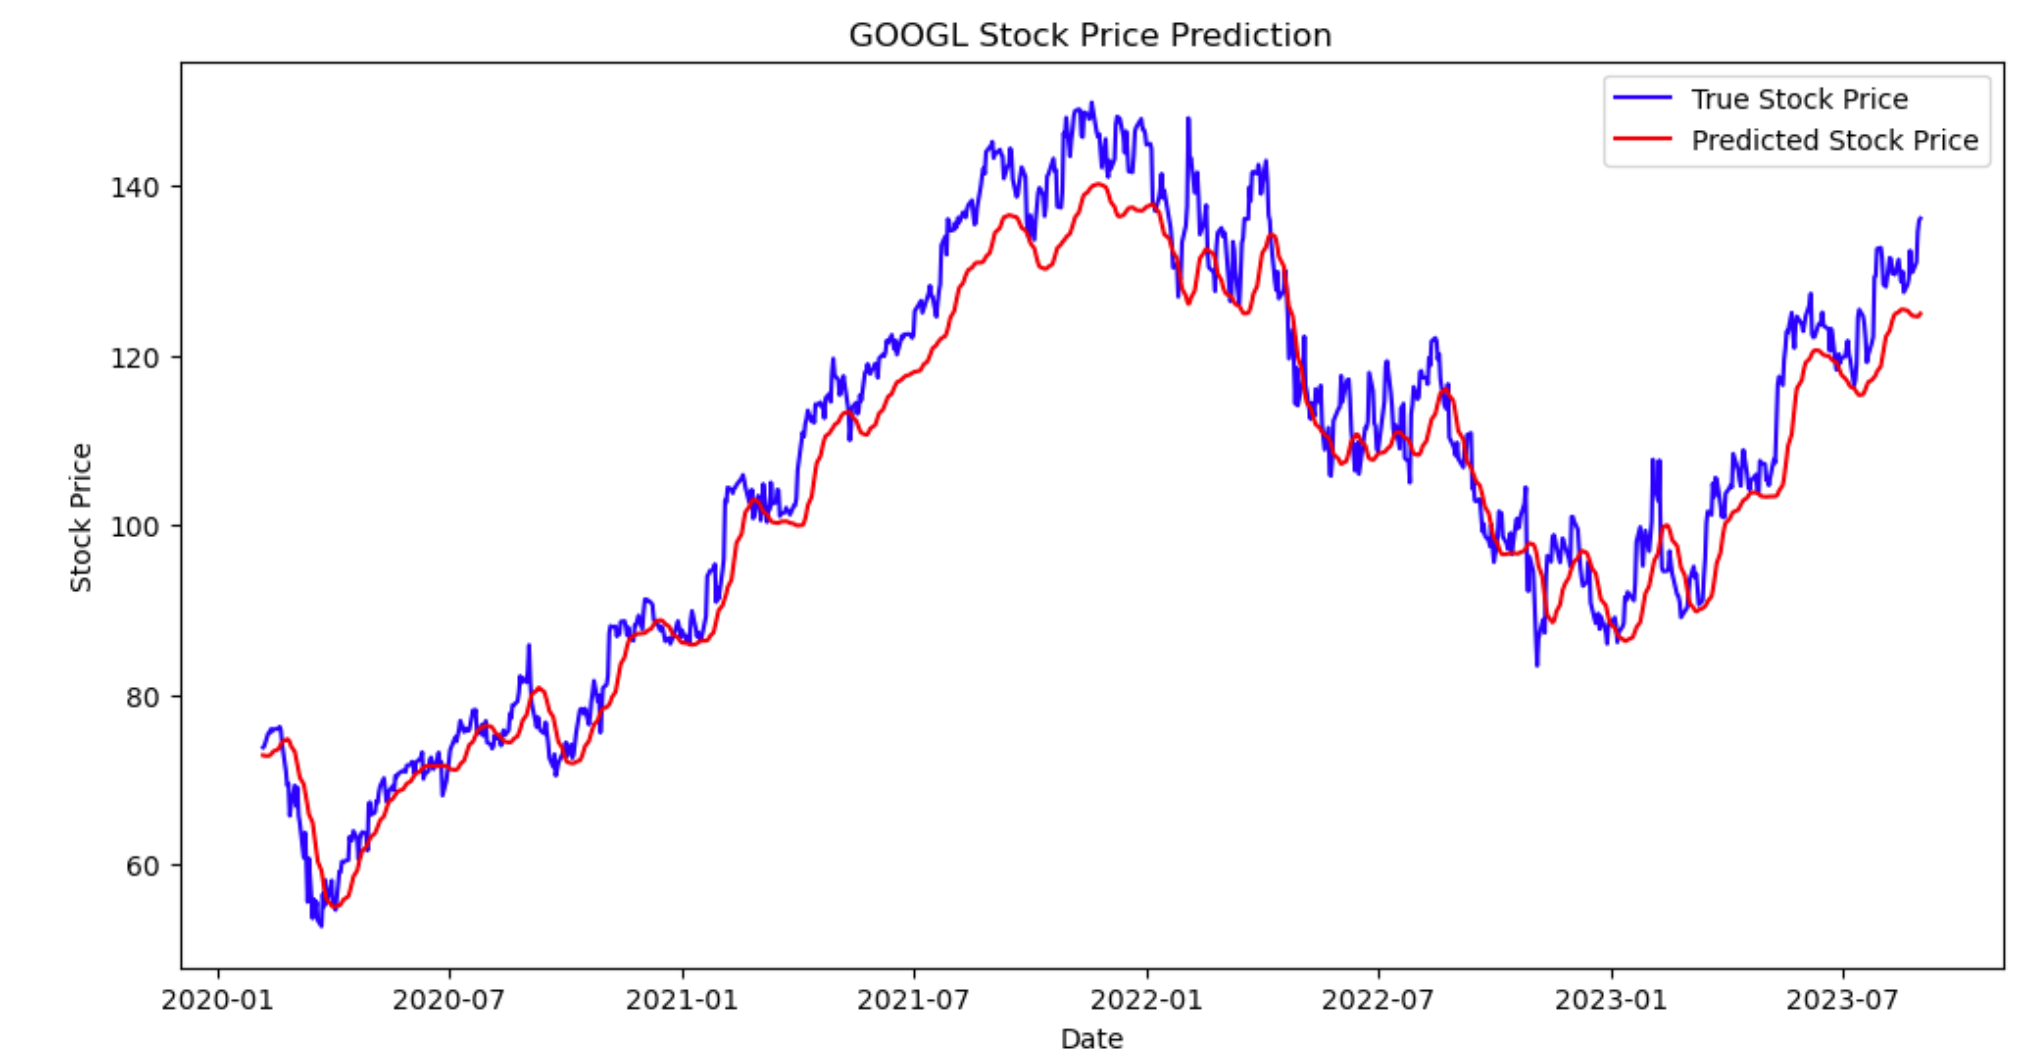
Figure 1: Predicted prices vs actual prices
This result emphasizes the reliability of the model. Given the relatively low percentage error, stock market participants can feel confident using the forecast result to guide their investment decisions. With the price forecasting outcome, Investors can harness the information of the trend of stock prices in advance. While there are some small fluctuations that are not able to be predicted, the overall change in the outcome over time can be predicted with great accuracy. Based on these relatively accurate predictions of changes, investors can make correct financial decisions, such as buying a stock when it is predicted to be about to rise significantly.
However, while the predicted results are as like the true value, the model can still be strengthened. The experimental conditions this paper uses are limited, and with better conditions, the model can also be adjusted to further reduce the error value and enhance its predictive ability.
According to the result, the LSTM method for predicting stock prices uses deep learning and is effective at conducting complicated historical data. It excels in making both short- and long-term forecasts and can deal with non-stationarity.
5. Conclusion
This research studies the creative application of machine learning methods to anticipate stock price by scanning an actual scenario of employing LSTM methods to make predictions of Google's stock price in an overall period of 23 years. The method used in the case is to develop a model using machine learning, feed processed data into the model to train it, and then choose the best model to forecast Google's stock price. After the work, a comparison is conducted between the anticipated outcome and the actual value of the stock price to analyze the relationships. The results confirm that LSTM is highly accurate in predicting the movement of the stock prices over time. The model is available to be used to predict the movement of a firm's stock over time, and investors can use the information obtained from the prediction result to investment decisions with more accuracy in the stock market. In summary, machine learning has far-reaching implications in the field of stock market forecasting, involving aspects of the industry and society at large. It is noteworthy that the model still can be improved. In the future, machine learning will change the way how most investors make financial decisions, and more people will get involved in this field. However, at the same time, it may also bring challenges related to ethics, regulation, and cybersecurity, which will require stricter supervision by the relevant authorities. In addition, even though machine learning models have shown substantial promise in predicting stock prices, the financial market is too sophisticated and vulnerable to contingencies, such as the occurrence of some natural disasters that may affect the stock prices of pharmaceutical and food companies, which are impossible to anticipate. Therefore, even the most complicated machine learning models may not provide perfect predictions, and there is still a lot of room for future machine learning development in this area.
References
[1]. Masoud, N. M. (2013). The impact of stock market performance upon economic growth. International Journal of Economics and Financial Issues, 3(4), 788-798.
[2]. Ariyo, A. A., Adewumi, A. O., Ayo, C. K. (2014). Stock price prediction using the ARIMA model. In 2014 UKSim-AMSS 16th international conference on computer modelling and simulation (pp. 106-112). IEEE.
[3]. Nabipour, M., Nayyeri, P., Jabani, H., Mosavi, A., Salwana, E. (2020). Deep learning for stock market prediction. Entropy, 22(8), 840.
[4]. Picasso, A., Merello, S., Ma, Y., Oneto, L., Cambria, E. (2019). Technical analysis and sentiment embeddings for market trend prediction. Expert Systems with Applications, 135, 60-70.
[5]. Vijh, M., Chandola, D., Tikkiwal, V. A., Kumar, A. (2020). Stock closing price prediction using machine learning techniques. Procedia computer science, 167, 599-606.
[6]. Jordan, M. I., Mitchell, T. M. (2015). Machine learning: Trends, perspectives, and prospects. Science, 349(6245), 255-260.
[7]. Yu, Y., Si, X., Hu, C., Zhang, J. (2019). A review of recurrent neural networks: LSTM cells and network architectures. Neural computation, 31(7), 1235-1270.
[8]. Rouf, N., Malik, M. B., Arif, T., Sharma, S., Singh, S., Aich, S., Kim, H. C. (2021). Stock market prediction using machine learning techniques: a decade survey on methodologies, recent developments, and future directions. Electronics, 10(21), 2717.
[9]. Shah, D., Isah, H., Zulkernine, F. (2019). Stock market analysis: A review and taxonomy of prediction techniques. International Journal of Financial Studies, 7(2), 26.
[10]. Singh, D., Singh, B. (2020). Investigating the impact of data normalization on classification performance. Applied Soft Computing, 97, 105524.
Cite this article
Kong,T. (2023). Machine Learning in Finance: A Case Study on Forecasting Google's Stock Price. Advances in Economics, Management and Political Sciences,65,31-35.
Data availability
The datasets used and/or analyzed during the current study will be available from the authors upon reasonable request.
Disclaimer/Publisher's Note
The statements, opinions and data contained in all publications are solely those of the individual author(s) and contributor(s) and not of EWA Publishing and/or the editor(s). EWA Publishing and/or the editor(s) disclaim responsibility for any injury to people or property resulting from any ideas, methods, instructions or products referred to in the content.
About volume
Volume title: Proceedings of the 2nd International Conference on Financial Technology and Business Analysis
© 2024 by the author(s). Licensee EWA Publishing, Oxford, UK. This article is an open access article distributed under the terms and
conditions of the Creative Commons Attribution (CC BY) license. Authors who
publish this series agree to the following terms:
1. Authors retain copyright and grant the series right of first publication with the work simultaneously licensed under a Creative Commons
Attribution License that allows others to share the work with an acknowledgment of the work's authorship and initial publication in this
series.
2. Authors are able to enter into separate, additional contractual arrangements for the non-exclusive distribution of the series's published
version of the work (e.g., post it to an institutional repository or publish it in a book), with an acknowledgment of its initial
publication in this series.
3. Authors are permitted and encouraged to post their work online (e.g., in institutional repositories or on their website) prior to and
during the submission process, as it can lead to productive exchanges, as well as earlier and greater citation of published work (See
Open access policy for details).
References
[1]. Masoud, N. M. (2013). The impact of stock market performance upon economic growth. International Journal of Economics and Financial Issues, 3(4), 788-798.
[2]. Ariyo, A. A., Adewumi, A. O., Ayo, C. K. (2014). Stock price prediction using the ARIMA model. In 2014 UKSim-AMSS 16th international conference on computer modelling and simulation (pp. 106-112). IEEE.
[3]. Nabipour, M., Nayyeri, P., Jabani, H., Mosavi, A., Salwana, E. (2020). Deep learning for stock market prediction. Entropy, 22(8), 840.
[4]. Picasso, A., Merello, S., Ma, Y., Oneto, L., Cambria, E. (2019). Technical analysis and sentiment embeddings for market trend prediction. Expert Systems with Applications, 135, 60-70.
[5]. Vijh, M., Chandola, D., Tikkiwal, V. A., Kumar, A. (2020). Stock closing price prediction using machine learning techniques. Procedia computer science, 167, 599-606.
[6]. Jordan, M. I., Mitchell, T. M. (2015). Machine learning: Trends, perspectives, and prospects. Science, 349(6245), 255-260.
[7]. Yu, Y., Si, X., Hu, C., Zhang, J. (2019). A review of recurrent neural networks: LSTM cells and network architectures. Neural computation, 31(7), 1235-1270.
[8]. Rouf, N., Malik, M. B., Arif, T., Sharma, S., Singh, S., Aich, S., Kim, H. C. (2021). Stock market prediction using machine learning techniques: a decade survey on methodologies, recent developments, and future directions. Electronics, 10(21), 2717.
[9]. Shah, D., Isah, H., Zulkernine, F. (2019). Stock market analysis: A review and taxonomy of prediction techniques. International Journal of Financial Studies, 7(2), 26.
[10]. Singh, D., Singh, B. (2020). Investigating the impact of data normalization on classification performance. Applied Soft Computing, 97, 105524.