


1. Introduction
In recent years, China proposed the ‘2030 Carbon Peak and 2060 Carbon Neutrality’ goals, making environmental protection a national priority. To achieve this, robust policies are in place, including strong promotion of new energy vehicles (NEVs) due to their low emissions and green attributes. According to Wei Wenqiang, with advancing NEV technologies, consumer demand is increasing, and they are expected to surpass traditional fuel-powered vehicles soon, becoming the mainstream in the automotive industry [1].
According to Liu Jianguo, Zhu Yuezhong, Tian Zhiyu, and others, the transportation sector is one of the vital areas concerning China’s energy demand and carbon dioxide emissions [2]. If China’s transportation sector follows the development trend of Western developed countries and developed coastal regions in China, the number of vehicles per thousand people, per capita transportation energy consumption, and carbon emissions will grow rapidly. This will further exacerbate China’s energy consumption and carbon emissions, posing greater challenges to the environment and climate change [3].
Among various types of new energy vehicles, electric vehicles dominate in terms of production and quantity compared to other unconventional new energy vehicles like hydrogen-powered and compressed air vehicles. As of now, 41.67% of Chinese households own cars, of which 31.1% are electric vehicles, and 48.41% are traditional fuel-powered vehicles. The large dataset helps reduce the influence of outliers [4].
This study mainly utilizes various data from China’s electric vehicle industry chain to research China’s modernization process. Compared to other unconventional new energy-powered vehicles (hydrogen, air-powered, etc.) and electrical vehicle technology is more mature and holds an absolute advantage in the new energy vehicle market. Therefore, selecting electric vehicles for evaluating China’s modernization can lead to a more objective assessment [5].
Additionally, inspired by a research conducted by Li Xiaoyi, based on the “inverted U-shaped” environmental Kuznets curve, new energy vehicles can also describe the relationship between carbon emissions and GDP during economic development and assess the situation of carbon peaking [6].
2. TOPSIS-Entropy Weight Method Modernization Evaluation Model Based on Hakone Model and Black Criteria
Due to the close relationship between China’s modernization and electric vehicle development, this paper proposes eight factors based on the Box-Cox model and Black-Scholes standard. These will evaluate China’s modernization using PCA dimensionality reduction and K-means clustering to select representative provinces.
This paper uses the degree of modernization represented by various provinces to comprehensively evaluate China’s modernization.
The research in this paper combines the Black-Scholes standard and the Box-Cox model used in previous modernization evaluation criteria. A comprehensive approach is proposed, selecting the following factors: Carbon Emissions from the Transportation Industry Factor (CETIF) as an indicator of green and environmentally friendly transportation levels, New Energy Vehicle Factor (NEVF) as an indicator of technological advancement, Charging Station Factor (CSF) as an indicator of infrastructure support, and Population Factor (PF) as an indicator of development potential. Linear regression is employed to fit the quantities “b” and growth rates “k” for each factor, resulting in eight indicators: CETIF_k, CETIF_b, NEVF_k, NEVF_b, CSF_k, CSF_b, PF_k, and PF_b. The intercept “b” is taken at the corresponding value for the same time (January 2020).
2.1. Principal Component Analysis (PCA)
Performing Principal Component Analysis (PCA) on the indicators to reduce the data dimensionality and eliminate significantly correlated data.
First, present the data matrix, consisting of “n” provinces and “p” indicators. Standardize the data using z-score normalization. It is worth noting that carbon emissions are considered as negative indicators, so we take the reciprocals for this category of indicators.
Conduct a contribution analysis on the indicators. The contribution percentages of the eight categories of indicators are as follows: PF_b=65.7%, PF_k=82.74%, NEVF_b=88.47%, NEVF_k=93.91%, CSF_b=97.48%, CSF_k=98.91%, CETIF_b=99.62%, CETIF_k=100%.
Select indicators with contribution percentages above 85%: CETIF_k, CETIF_b, NEVF_k, NEVF_b, CSF_k, CSF_b. It can be seen that the population is not the main component of green modernization. Its influence can be measured using other indicators. Due to the numerous provinces in China, this study classifies provinces into six categories based on indicators using the K-means clustering method.
2.2. K-Means Clustering Analysis
Increasing the value of k sequentially and plotting accordingly, we get the following graph:
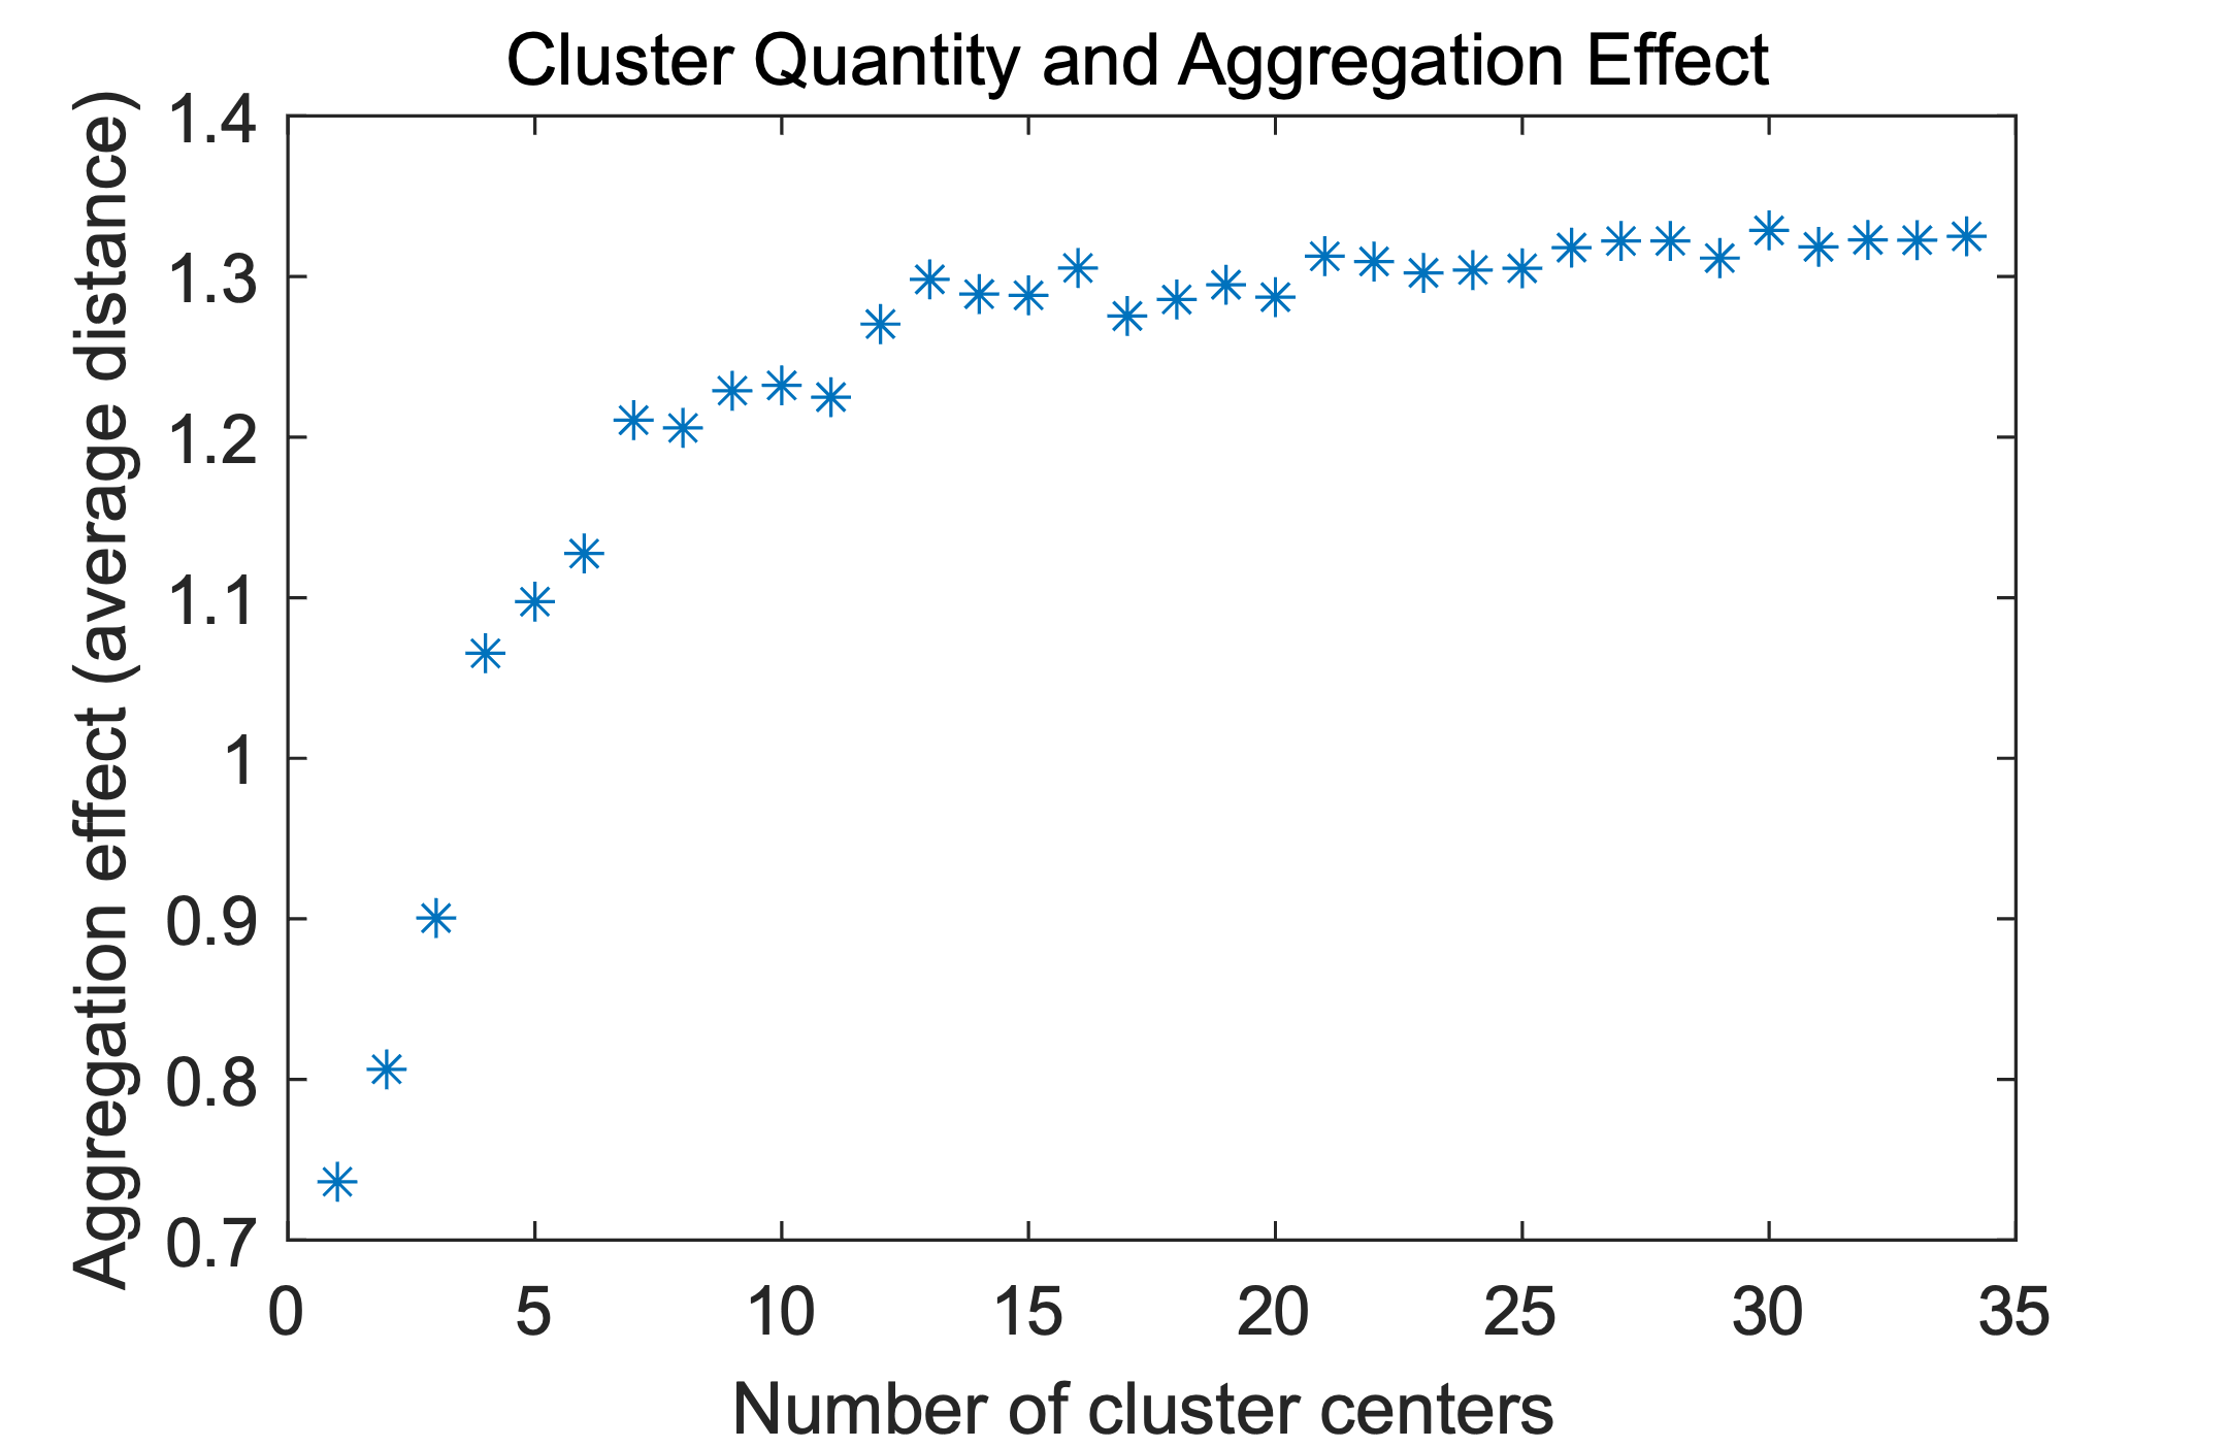
Figure 1: Clustering Center Quantity and Clustering Effect Graph (Left).
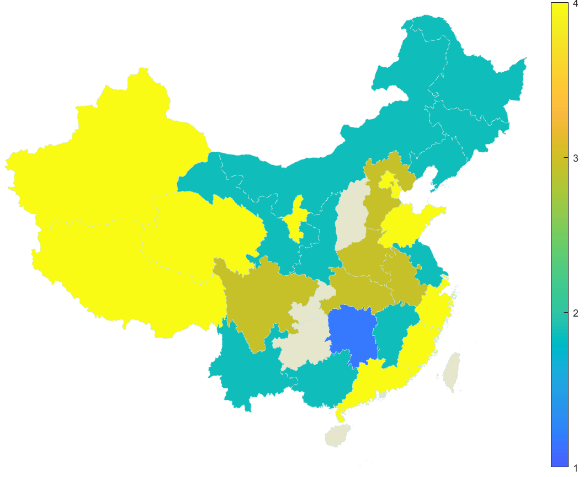
Figure 2: Clustering Results of Various Provinces in China (Right).
According to the elbow rule, it is determined that k=4 is the turning point of clustering, and therefore each province can be divided into 4 categories.
Hunan Province is classified as the first category. Yunnan, Guangxi, Jiangxi, Jiangsu, Shaanxi, Gansu, Inner Mongolia, Liaoning, Jilin, and Heilongjiang are classified as the second category. Sichuan, Hubei, Anhui, Henan, and Hebei are classified as the third category. Guangdong, Fujian, Zhejiang, Shandong, Beijing, Tianjin, Ningxia, Qinghai, Tibet, Xinjiang, and Shanghai are classified as the fourth category.
2.3. Entropy Weight Method - TOPSIS Evaluation Method
Data standardization uses z-score. To avoid the impact of a minimum term of 0 on subsequent division operations, a minimum term of 0.0001 is added after all data to calculate the factor entropy value, and then the entropy weight of each factor is calculated:
\( {w_{j}}=\frac{1-{H_{j}}}{\sum _{j=1}^{p}(1-{H_{j}})} \) (1)
Obtain the weights of the six factors as follows: \( {w_{CETIF\_k}} \) =0.182712, \( {w_{CETIF\_b}} \) =0.154404, \( {w_{NEVF\_k}} \) =0.182429, \( {w_{NEVF\_b}} \) =0.139092, \( {w_{CSF\_k}} \) =0.159975, \( {w_{CSF\_b}} \) =0.181387.
Inspired by Liu Xiaojun’s research, construct a weighted norm matrix using TOPSIS advantages and disadvantages solution: \( \hat{{X_{ij}}}={w_{j}}∙{X_{ij}} \) [7]. Calculate the distance between solutions \( d_{i}^{-}=\sqrt[]{\sum _{j=1}^{p}{(\hat{{X_{ij}}}-\hat{{X_{jmin}}})^{2}}} \) and \( d_{i}^{+}=\sqrt[]{\sum _{j=1}^{p}{(\hat{{X_{ij}}}-\hat{{X_{jmax}}})^{2}}} \) , then the score for the i-th category can be obtained: \( {S_{i}}=\frac{d_{i}^{-}}{d_{i}^{-}+d_{i}^{+}} \) .
The evaluation results are as follows: Category 1: 67.37904; Category 2: 49.52626; Category 3: 96.15002; Category 4:100.
The low score of category 1 is due to the slow development of new energy vehicles, and the insufficient number of supporting facilities.
The second category has the lowest score, and its carbon emissions are low. However, the number of Charging station is also low. This may be due to the underdeveloped regional economy, which is on the left side of the environmental Kuznets curve. It does not meet the modernization standards, but only meets the requirements of “green environmental protection”.
The third category is characterized by the annual growth of carbon emissions, which indicates that this category is approaching the peak of carbon emissions, and the number of new energy vehicles and Charging station is also growing year by year, which is at the peak of development.
Category 4: carbon emissions are high but will decrease year by year.
This article defines provinces that have crossed or are at the peak of carbon emissions as those with higher levels of modernization. According to the scores, 100%, 75%, 50%, and 25% modernization levels are assigned to each province to calculate China’s domestic modernization level:
\( modern=\frac{100\%{num_{4}}+75\%{num_{3}}+50\%{num_{1}}+25\%{num_{2}}}{34-{num_{5}}} \) (2)
Due to a total of 34 provinces in China and 7 provinces with missing data, \( {num_{5}} \) =7. By calculation, it can be concluded that \( modern \) =65.741%, indicating that nearly 60% of the regions in China have entered “green modernization”.
3. Modeling New Energy Vehicle Adoption with SIRD-NM
Due to the similarities between the spread of new energy vehicles and infectious diseases, this paper combines infectious disease models with the popularization of new energy vehicles. Since traditional models cannot describe a person simultaneously infected with two viruses, and residents can own two vehicles at the same time, as well as inspirations from Fernández-Villaverde J, Nisar K S and Calafiore G’s application of SIRD model on COVID-19 prediction [8][9][10], this paper proposes a dynamic SIRD-NM model under a total population setting, introducing new definitions for the parameters:
S: Represents households that have not purchased new energy vehicles. Over time, some households will choose to buy new energy vehicles, transitioning to state I.
I: Represents households that have purchased new energy vehicles. During a certain period, there is a promotional effect, where households won’t immediately buy another new energy vehicle or sell the current one. After this period, I-type households are divided into RD-type households.
D: Represents households that currently own new energy vehicles. Over time, some households will purchase another new energy vehicle, returning to state I.
R: Represents households that will sell their new energy vehicles over time, returning to the state of not owning a new energy vehicle (S).
N: Represents households that have never purchased and won’t purchase new energy vehicles. This category might include households with existing traditional fuel-powered vehicles or financial constraints, which have no significant impact on the model.
M: Represents the total number of households, which is categorized into five groups: S, I, R, D, and N. The total number of households will change continuously over time.
Firstly, the impact of households in category N is excluded, and \( \hat{M} \) represents the total number of households after removing category N households. The probability of households in category R transitioning to category S are equal to the probability of households in category D transitioning to category R. The probability of households in category S purchasing new energy vehicles and transitions to category I is influenced by the population size of category S and category I. The transition of households in category I to category D is influenced by time.In a given unit of time, there are \( γI \) households that undergo a transition, and households in category D have a probability of \( ϵ \) to revert back to category I. Households in category D transition from category I, and there exists a probability of loss during this transition.
Due to the linear relationship between M and t, the utilization of linear regression yields the following:
\( M=kt+b \) (3)
Then k=1.0043e+06, b=1.6804e+09, R=0.9995.
Based on the equations and parameters obtained, we can deduce the improved SIRD model:
\( \begin{cases} \begin{array}{c} \frac{dI}{dt}=\frac{αIS}{\hat{M}}+ϵD-γI \\ \frac{dD}{dt}=-ϵD+γI-βD \\ \frac{\frac{dS}{dt}=-\frac{αIS}{\hat{M}}+βD}{ \begin{array}{c} \hat{M}=M-N \\ M=kt+b \end{array} } \end{array} \end{cases} \) (4)
To calculate the ownership of new energy vehicles (NEVs) using the SIRD-NM model:
\( car=(1+ϵ)D+I \) (5)
Due to the large number of households with new energy vehicles, in statistics, it is reasonable to approximate the frequency as the probability. Based on this assumption, the transition probabilities between states are as follows: α = 0.33; γ = 0.692; β = 0.1083; ε = 0.35.These probabilities are only calculated within each category of households. Therefore, to obtain the frequencies, you need to multiply these probabilities by the corresponding number of households and then normalize the results.
By substituting the initial values from the year 2012, the data for the number of new energy vehicles in the year 2030 can be obtained as follows:
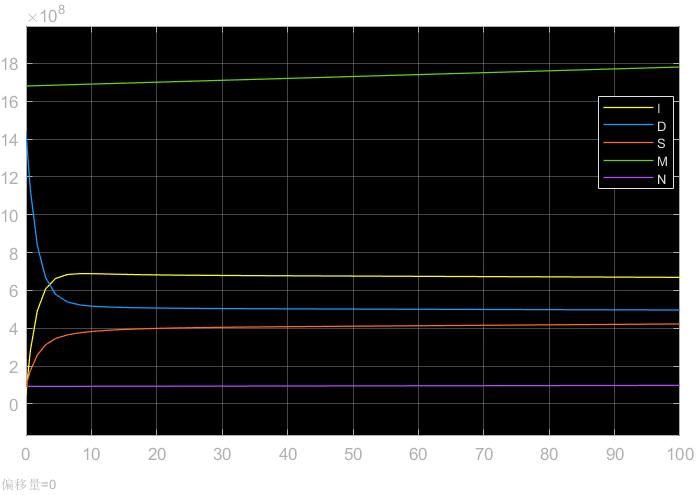
Figure 3: The SIRD-NM model predicts the future curve for the population of new energy vehicle (NEV) owners.
The SIRD model was validated with data from 2012 to 2020, with a mean residuals of 10,511 families.
As seen, the number of households purchasing new energy vehicles will gradually increase, while the number of households not buying new energy vehicles will gradually decrease. However, due to the fact that traditional fuel-powered vehicles cannot be completely phased out, the categories S, D, and I will reach an equilibrium state, with an estimated equilibrium time of about 6 years. This implies that new energy vehicles will become popular within 7 to 10 years.
On average, each new energy vehicle can reduce carbon emissions by 3.90625 tons per year compared to traditional fuel-powered vehicles. Based on the projected number of new energy vehicles in 2030, the carbon emissions in the transportation sector can be reduced to 577.7421 million tons, and the total carbon emissions can be reduced to 10,857.7421 million tons. If the number of new energy vehicles remains unchanged according to the carbon emission trend, the estimated carbon emissions in 2030 would be around 11.48 billion tons. Therefore, promoting new energy vehicles can reduce China’s carbon emissions by 5.42%.
4. Conclusion
This study focused on the relationship between China’s electric vehicle industry chain and the country’s modernization goals, aiming for a harmonious coexistence between humans and nature. China’s commitment to achieving carbon peaking by 2030 and carbon neutrality before 2060 underscores the importance of the electric vehicle sector in this green modernization process [11].
This research utilized the Six-factor TOPSIS-Entropy Method to comprehensively measure China’s “green modernization” by evaluating the level of modernization in each province. The results revealed that nearly 60% of the regions in China have entered the stage of “green modernization.”
Moreover, the empirical analysis demonstrated a high feasibility of achieving China’s carbon peaking goal by 2030. The improved SIRD-NM dynamic model predicted the number of new energy vehicles, which could contribute to a 5.42% reduction in carbon emissions.
Furthermore, the study explored the relationship between national policies promoting new energy vehicles and their penetration rate. Reasonable policy suggestions were proposed to stimulate residents’ purchasing of such vehicles and enhance the likelihood of achieving the 2030 carbon peaking goal.
Overall, the findings offer valuable insights into China’s efforts towards green modernization and carbon peaking. Promoting new energy vehicles plays a significant role in achieving sustainability and reducing carbon emissions, contributing to a more eco-friendly and modernized society in China.
References
[1]. Wei Wenqiang 2023. Research on the Development of New Energy Vehicle Industry under the Background of Carbon Neutrality. Times Automotive, 402 87-89
[2]. Liu Jianguo, Zhu Yuezhong, Tian Zhiyu 2021. Research on the decarbonization path of China’s transportation under the goal of “carbon neutrality”. China Energy, 43 6-12
[3]. Zhang Zhenli 2023. Opportunities and challenges for new energy vehicles in the context of “dual carbon”. Special Purpose Vehicles, 310 10-12
[4]. Smith, J., & Johnson, A. 2022. Electric Vehicles Dominance in the Chinese Market. Energy Studies, 10 123-135
[5]. Johnson, M., & Smith, K. 2022. Comparative Analysis of Unconventional New Energy Vehicles in China. Energy Studies, 10 234-246
[6]. Li Xiaoyi, Tan Xiaoyu, Wu Rui, Xu Honglei, Zhong Zhihua, Li Yue, Zheng Chaohui, Wang Renjie, Qiao Yingjun 2021. Research on carbon peak and carbon neutral path in transportation field. China Engineering Science, 23 15-21
[7]. Liu Xiaojun, Lu Jinghan 2023. Research on the Comprehensive Benefit Evaluation of Green Construction Land Saving Technology Based on Topsis Entropy Weight Method. Mathematical Practice and Understanding, 53 1-10
[8]. Fernández-Villaverde J, Jones C I 2022. Estimating and simulating a SIRD model of COVID-19 for many countries, states, and cities. Journal of Economic Dynamics and Control, 140 104318
[9]. Calafiore G C, Novara C, Possieri C 2020. A time-varying SIRD model for the COVID-19 contagion in Italy. Annual reviews in control, 50 361-372
[10]. Nisar K S, Ahmad S, Ullah A, et al 2021. Mathematical analysis of SIRD model of COVID-19 with Caputo fractional derivative based on real data. Results in Physics, 21 103772
[11]. Yuan Bo 2022. Development of China’s new energy vehicle industry under the goal of carbon neutrality. Management Engineer, 27 5-10
Cite this article
Liang,W.;Guo,Y.;Liang,L. (2024). A Study on the Statistical Measurement of China’s Modernization Based on the Electric Vehicle Industry Chain Development. Advances in Economics, Management and Political Sciences,66,31-37.
Data availability
The datasets used and/or analyzed during the current study will be available from the authors upon reasonable request.
Disclaimer/Publisher's Note
The statements, opinions and data contained in all publications are solely those of the individual author(s) and contributor(s) and not of EWA Publishing and/or the editor(s). EWA Publishing and/or the editor(s) disclaim responsibility for any injury to people or property resulting from any ideas, methods, instructions or products referred to in the content.
About volume
Volume title: Proceedings of the 3rd International Conference on Business and Policy Studies
© 2024 by the author(s). Licensee EWA Publishing, Oxford, UK. This article is an open access article distributed under the terms and
conditions of the Creative Commons Attribution (CC BY) license. Authors who
publish this series agree to the following terms:
1. Authors retain copyright and grant the series right of first publication with the work simultaneously licensed under a Creative Commons
Attribution License that allows others to share the work with an acknowledgment of the work's authorship and initial publication in this
series.
2. Authors are able to enter into separate, additional contractual arrangements for the non-exclusive distribution of the series's published
version of the work (e.g., post it to an institutional repository or publish it in a book), with an acknowledgment of its initial
publication in this series.
3. Authors are permitted and encouraged to post their work online (e.g., in institutional repositories or on their website) prior to and
during the submission process, as it can lead to productive exchanges, as well as earlier and greater citation of published work (See
Open access policy for details).
References
[1]. Wei Wenqiang 2023. Research on the Development of New Energy Vehicle Industry under the Background of Carbon Neutrality. Times Automotive, 402 87-89
[2]. Liu Jianguo, Zhu Yuezhong, Tian Zhiyu 2021. Research on the decarbonization path of China’s transportation under the goal of “carbon neutrality”. China Energy, 43 6-12
[3]. Zhang Zhenli 2023. Opportunities and challenges for new energy vehicles in the context of “dual carbon”. Special Purpose Vehicles, 310 10-12
[4]. Smith, J., & Johnson, A. 2022. Electric Vehicles Dominance in the Chinese Market. Energy Studies, 10 123-135
[5]. Johnson, M., & Smith, K. 2022. Comparative Analysis of Unconventional New Energy Vehicles in China. Energy Studies, 10 234-246
[6]. Li Xiaoyi, Tan Xiaoyu, Wu Rui, Xu Honglei, Zhong Zhihua, Li Yue, Zheng Chaohui, Wang Renjie, Qiao Yingjun 2021. Research on carbon peak and carbon neutral path in transportation field. China Engineering Science, 23 15-21
[7]. Liu Xiaojun, Lu Jinghan 2023. Research on the Comprehensive Benefit Evaluation of Green Construction Land Saving Technology Based on Topsis Entropy Weight Method. Mathematical Practice and Understanding, 53 1-10
[8]. Fernández-Villaverde J, Jones C I 2022. Estimating and simulating a SIRD model of COVID-19 for many countries, states, and cities. Journal of Economic Dynamics and Control, 140 104318
[9]. Calafiore G C, Novara C, Possieri C 2020. A time-varying SIRD model for the COVID-19 contagion in Italy. Annual reviews in control, 50 361-372
[10]. Nisar K S, Ahmad S, Ullah A, et al 2021. Mathematical analysis of SIRD model of COVID-19 with Caputo fractional derivative based on real data. Results in Physics, 21 103772
[11]. Yuan Bo 2022. Development of China’s new energy vehicle industry under the goal of carbon neutrality. Management Engineer, 27 5-10