


1. Introduction
Since its inception in 2008, Airbnb has made great strides in the short-term lodging industry [1]. The selection of lodging by consumers is influenced by housing prices, which may exhibit discernible spatial autocorrelation [2]. To investigate the influence of spatial and locational factors on Airbnb prices, this article: (1) visualizes the overall distribution of prices; (2) conducts Global Moran's I analysis on prices; (3) conducts a GWR model using a semi-logarithmic model with four categories and a total of 10 explanatory variables.
2. Literature Review
Given that hosts are in charge of pricing their own listed properties, analyzing the elements that influence Airbnb prices is significant for researchers and industry professionals [3]. The hedonic price model, a popular approach in this discipline, hypothesizes that the price is reflective of the consumer's assessment of the property's disparate features [4]. Two primary elements that may explain the differential pricing include physical attributes (e.g. the number of bathrooms, etc.) and location-specific variables (e.g. proximity to amenities, the desirability of the neighborhood, etc.) [5].
Besides, factors related to the host or customers such as the characteristics of the host [6], host responsiveness [7], customer ratings, and their review comments [8] are also essential. Real estate prices are highly spatially dependent, exhibiting a high degree of homogeneity in attributes across homes within the same geographic area [9]. The traditional Ordinary Least Squares (OLS) model fails to account for the spatial dependence of Airbnb prices, thus rendering the results of the price model statistically biased [10,11]. An academically accepted approach to tackling spatial autocorrelation (SAC) is the application of geographically weighted regression (GWR), which can provide a spatial regression model and perform spatial prediction, while indicators such as Moran's I enable the test of SAC [12].
Learning from the literature, this article takes London as the study area, based on the Airbnb price data in London, selects 10 explanatory variables from the four dimensions of property characteristics, location characteristics, neighborhood characteristics, and transaction characteristics, uses Global Moran's I to test SAC and constructs the GWR model to the influence of spatial and locational factors on Airbnb prices.
3. Study Area and Data
3.1. Study Area
The city of London is situated in the southeast region of England, the coordinates of its central area being 51°30' north latitude and 0°5' east longitude [13]. Fig.1 shows London's 32 boroughs, underground stations, and green space areas.
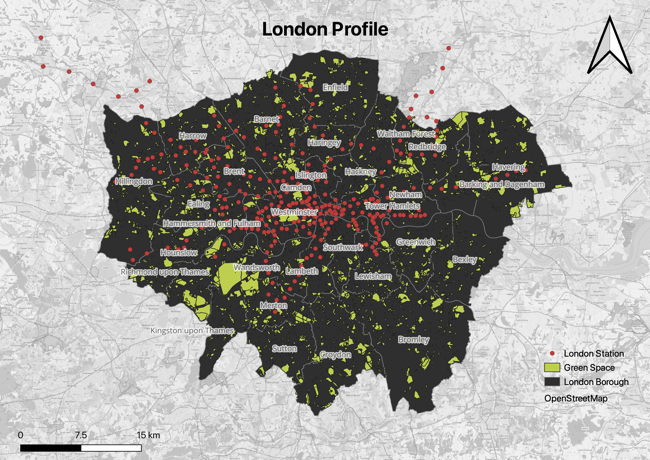
Figure 1: London Profile.
3.2. Data Source and Variables Selection
The final data set selected in this article encompasses information about Airbnb listings in London over the 12 months preceding December 10, 2022, with a total of 51,218 valid values collected. The data was sourced from Airbnb's official website http://insideairbnb.com/, and is pre-processed in QGIS, RStudio, and ArcGIS according to the following principles:
(1) Removes missing values and hard-to-quantify text information.
(2) Adopts the semi-logarithmic model, which takes the natural logarithm of Price and generates a new variable (LnPrice).
(3) Deals with categorical variables in terms of their types.
3.3. Selection and Measurement of Variables
3.3.1. Explained Variable: Listing Price (Unit: £)
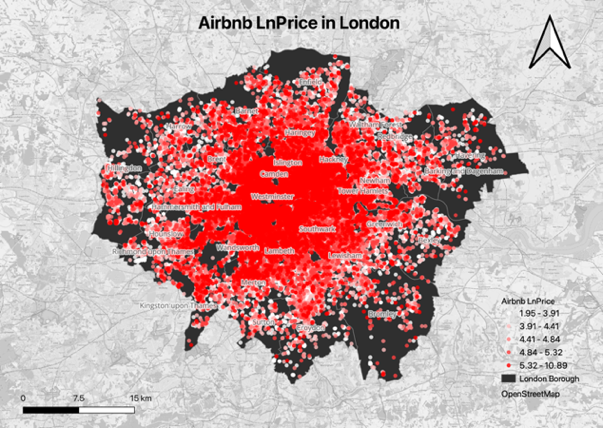
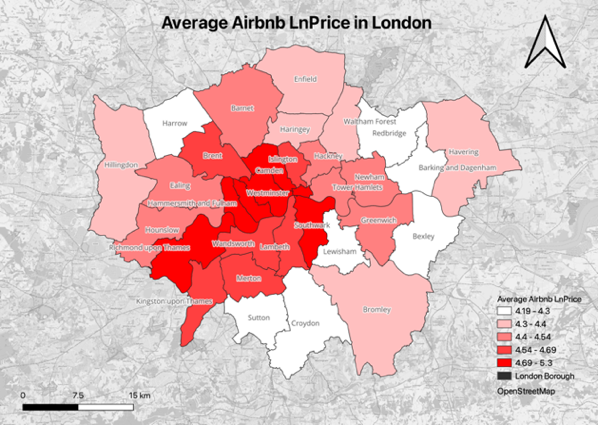
There are 71,938 transaction prices in the original data set. Firstly, 13 outliers whose value equals 0 are discarded, and the natural logarithm (LnPrice) is taken for the remaining 71,925 samples. The sample distribution of LnPrice is shown in Fig.2. Besides, the distribution of LnPrice mean across London boroughs is visualized in Fig.3. The presence of spatial heterogeneity is apparent, as evidenced by the higher prices observed in areas closer to London's center, particularly in the south-western region.
|
|
Figure 2: Airbnb LnPrice. | Figure 3: Average Airbnb Lnprice. |
3.3.2. Explanatory Variables
Considering the problem of possible multicollinearity, this article finally selected 10 explanatory variables and a categorical variable as shown in Table 1 below.
Table 1: Variable Clarification.
Classification | Variable name | Variable Description |
Property | RoomType | Four room types, including hotel, private room, Shared room and Entire place |
bedrooms | Discrete, the number of bedrooms | |
scores_value | Continuous | |
Location (Unit: meter) | Distance_Station | Continuous, Euclidean distance to the nearest subway station within 500m buffer zone |
LENGTH_Road | Continuous, Length of roads within 500m buffer zones | |
Neighborhood (Unit:m2) | Area_GreenSpace | Continuous, Area of green space within 500m buffer zones |
Transaction | superhost | Dummy |
num_reviews | Discrete | |
review_scores | Continuous | |
scores_checkin | Continuous | |
scores_communication | Continuous |
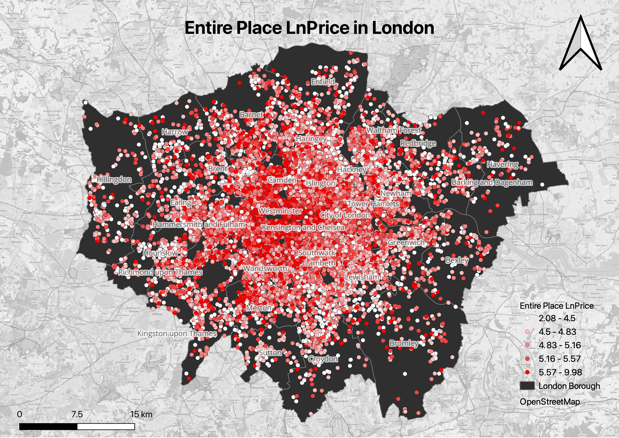
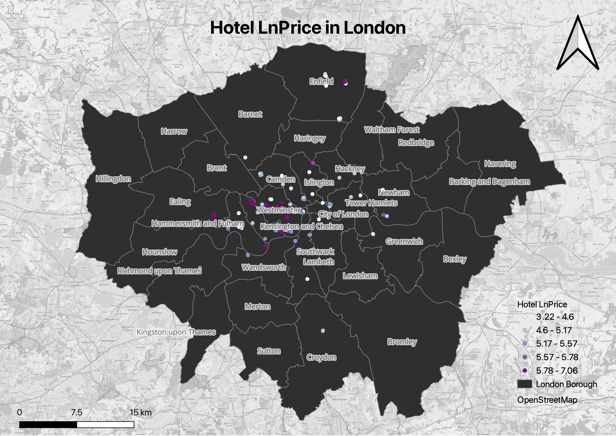
Apart from the full-sample regression, this article also conducts four regressions separately based on the room type to examine its influence on price. The corresponding distribution of LnPrice based on room type is shown in Figures 4-7 below. The descriptive statistics of the variables selected in this article are shown in Table 2.
|
|
Figure 4: Entire LnPrice. | Figure 5: Hotel Lnprice. |
|
|
Figure 6: Shared Room LnPrice. | Figure 7: Private Room LnPrice. |
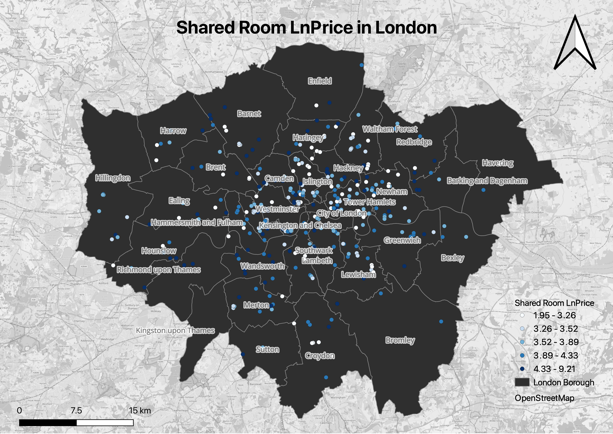
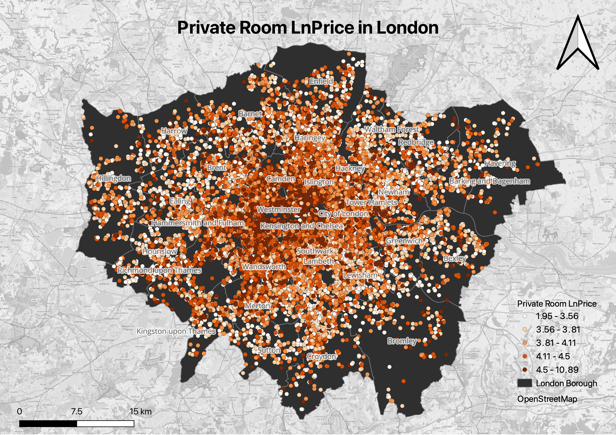
Table 2: Descriptive Statisctics.
Variable | mean | sd | p50 | min | max |
LnPrice | 4.655949 | 0.829111 | 4.60517 | 2.08 | 10.88908 |
Room Type |
|
|
|
|
|
bedrooms | 1.496095 | 0.856264 | 1 | 1 | 22 |
scores_value | 4.622964 | 0.51145 | 4.75 | 0 | 5 |
Distance_Station(m) | 1150.493 | 1544.586 | 601.3622 | 1.11 | 19813.0876 |
Length_Road(m) | 5596.423 | 1265.221 | 5610.956 | 0 | 10135.578 |
Area_GreenSpace(m2) | 58040.78 | 82304.38 | 27755.58 | 0 | 1096931.83 |
superhost(dummy) |
|
|
|
|
|
num_reviews | 23.51999 | 45.39534 | 8 | 1 | 1171 |
review_scores | 4.675534 | 0.499817 | 4.83 | 0 | 5 |
scores_checkin | 4.792605 | 0.445431 | 4.95 | 0 | 5 |
scores_communication | 4.807603 | 0.443677 | 4.98 | 0 | 5 |
4. Methodology
4.1. Global SAC Test of Airbnb Price
SAC pertains to the level of correlation that exists between a particular attribute value within a regional unit and the corresponding value in a neighboring unit. This article uses the indicator Global Moran's I (Equ.1) to calculate the global SAC [12].
\( I=\frac{n}{\sum _{i=1}^{n}\sum _{j=1}^{n}{w_{ij}}}\cdot \frac{\sum _{i=1}^{n}\sum _{j=1}^{n}{w_{ij}}({x_{i}}-\bar{x})({x_{j}}-\bar{x})}{\sum _{i=1}^{n}{({x_{i}}-\bar{x})^{2}}} \) (1)
where wij represents the spatial weight value; n is the total number of spatial units. The value is between -1 and 1. At a significant level, Moran's I>0 indicates that there is a positive SAC, and the prices reflect the cluster effect. This paper uses ArcGIS to conduct a global SAC test on LnPrice and obtains Global Moran's I=0.20, P-Value<0.0001, which proves that the spatial distribution of London Airbnb prices is clustered. The result is shown in Fig.8 below.
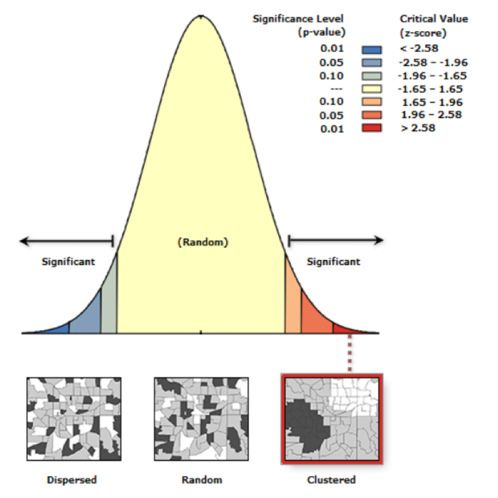
Figure 8: Results.
4.2. GWR Model
The GWR model applies the spatial weight matrix to the linear regression model, enabling captures of spatial heterogeneity [12]. Its general form is shown in Equ.2.
\( {Y_{i}}={β_{0}}({u_{i}},{v_{i}})+\sum _{k=1}^{K}{β_{k}}({u_{i}},{v_{i}}){X_{ik}}+{ε_{i}} \) (2)
where ui and vi are spatial coordinates; \( {β_{0}}({u_{i}},{v_{i}}) \) is the intercept term; βk is the estimated coefficient of the kth influencing factor of the ith point on the explained variable \( {Y_{i}} \) ; \( {ε_{i}} \) represents the error term.
The regression coefficient is obtained according to Equ.3.
\( {β_{j}}({u_{i}},{v_{i}})={({X^{T}}W({u_{i}},{v_{i}})X)^{-1}}{X^{T}}W({u_{i}},{v_{i}})Y \) (3)
where \( W({u_{i}},{v_{i}}) \) is the weighting matrix when the ith spatial point characterizes the model.
Its formulation is shown in Equ.4.
\( {W_{ij}}={e^{-\frac{1}{2}{(\frac{{d_{ij}}}{b})^{2}}}} \) (4)
where \( {d_{ij}} \) represents the distance between \( i \) and \( j \) , and \( b \) is the bandwidth.
Thus, based on the aforementioned fundamental framework, this article constructs the following benchmark semi-logarithmic model (Equ.5) and uses RStudio to realize it.
\( LnPrice={β_{0}}({u_{i}},{v_{i}})+\sum _{k=1}^{K}{β_{i}}({u_{j}},{v_{j}}){X_{ij}}+{ε_{j}} \) (5)
5. Empirical Results
5.1. Global and GWR Model Results
5.1.1. Model Evaluation
The tables below show the global model and GWR of the full sample and classification discussions. It is noteworthy that the "bedroom" variable of shared rooms is not included in the regression, as all samples have a value of 1. Compared to the global model, the R2 value of the GWR model of the full sample is 0.5720318, the Adjusted-R2 value is 0.5320542. Combined with the results of the classification discussion, the results comprehensively show that the goodness-of-fit for the GWR model is notably higher than the global model for the study of the spatial impact of Airbnb prices, particularly in relation to the Private Room type.
Table 3: Results Full Sample.
| Num of obs | = | 51218 | ||
Multiple R2 | = | 0.3611 | |||
Adjusted R2 | = | 0.361 | |||
Extra Diagnostic information | |||||
AIC | = | 103230.2 | |||
AICc | = | 103230.2 | |||
BIC | = | 52248.41 | |||
Variable | Estimate | Std. Error | t-value | Pr(>|t|) | |
(Intercept) | 3.92E+00 | 3.88E-02 | 101.087 | < 2e-16 *** | |
Room Type | |||||
bedrooms | 4.96E-01 | 3.44E-03 | 144.1 | < 2e-16 *** | |
scores_value | -3.05E-01 | 1.06E-02 | -28.634 | < 2e-16 *** | |
Distance_Station | -7.81E-05 | 1.98E-06 | -39.472 | < 2e-16 *** | |
Length_Road | 1.24E-04 | 2.62E-06 | 47.397 | < 2e-16 *** | |
Area_GreenSpace | 7.89E-08 | 3.87E-08 | 2.041 | 0.0412 * | |
superhost | 1.61E-01 | 8.23E-03 | 19.535 | < 2e-16 *** | |
num_reviews | -1.10E-03 | 6.70E-05 | -16.373 | < 2e-16 *** | |
review_scores | 3.55E-01 | 1.19E-02 | 29.799 | < 2e-16 *** | |
scores_checkin | -4.64E-02 | 1.08E-02 | -4.312 | 1.62e-05 *** | |
scores_communication | -1.33E-01 | 1.17E-02 | -11.363 | < 2e-16 *** | |
Significance stars
* p<0.1,** p<0.05,*** p<0.01
Table 4: Results Classification.
Room Type | Entire Home | Private Room | Shared Room | Hotel |
Num of obs | 30787 | 20068 | 214 | 149 |
Variable | Coefficient Estimate | |||
(Intercept) | 4.348e+00 *** | 4.192e+00*** | 4.025e+00*** | 3.160e+00*** |
bedrooms | 3.327e-01*** | 2.284e-01*** |
| 1.804e-01*** |
scores_value | -2.310e-01*** | -1.473e-01*** | 9.30E-02 | -5.546e-01** |
Distance_Station | -7.525e-05*** | -4.581e-05*** | 6.61E-05 | -1.04E-05 |
Length_Road | 1.072e-04*** | 8.536e-05*** | -5.50E-05 | 2.866e-04*** |
Area_GreenSpace | 1.925e-07*** | 6.88E-09 | -1.290e-06* | 2.685e-06** |
superhost | 2.293e-01*** | 1.344e-01*** | 3.897e-01* | -6.60E-02 |
num_reviews | -6.336e-04*** | 1.12E-04 | -3.25E-04 | -3.018e-03** |
review_scores | 3.021e-01*** | 1.989e-01*** | -3.85E-02 | 9.024e-01*** |
scores_checkin | -2.709e-02* | -4.525e-02** | -7.30E-02 | -7.12E-02 |
scores_communication | -1.381e-01*** | -1.782e-01*** | 1.83E-02 | -2.76E-01 |
Mutiple R2 | 0.3272 | 0.08834 | 0.07863 | 0.428 |
Adjusted R2 | 0.3269 | 0.08789 | 0.03798 | 0.3865 |
AIC | 49655.58 | 37811.39 | 447.1007 | 313.1017 |
AICc | 49655.59 | 37811.41 | 448.4076 | 315.3958 |
BIC | 19092.62 | 17957.16 | 329.1522 | 260.1964 |
Table 5: GWR Full Sample.
|
|
| Multiple R2 | = | 0.5720318 |
Adjusted R2 | = | 0.5320542 | |||
Kernel function: bisquare | |||||
Adaptive bandwidth: 419 (number of nearest neighbors) | |||||
AIC | = | 85981.63 | |||
AICc | = | 89735.85 | |||
BIC | = | 67227.36 | |||
Variable | Min. | 1st Qu. | Median | 3rd Qu. | Max. |
(Intercept) | -1.37E+00 | 3.58E+00 | 4.25E+00 | 5.00E+00 | 1.06E+01 |
bedrooms | 1.82E-01 | 4.45E-01 | 5.00E-01 | 5.56E-01 | 8.03E-01 |
scores_value | -1.38E+00 | -4.26E-01 | -2.98E-01 | -1.70E-01 | 4.92E-01 |
Distance_Station | -2.84E-03 | -2.54E-04 | -4.92E-05 | 9.03E-05 | 4.60E-03 |
Length_Road | -6.43E-04 | -7.73E-05 | -1.47E-05 | 4.14E-05 | 1.00E-03 |
Area_GreenSpace | -2.76E-05 | -1.17E-06 | -2.38E-07 | 5.10E-07 | 0.00E+00 |
superhost | -3.28E-01 | 4.54E-02 | 1.47E-01 | 2.41E-01 | 8.17E-01 |
num_reviews | -1.07E-02 | -2.38E-03 | -1.42E-03 | -6.41E-04 | 5.20E-03 |
review_scores | -4.53E-01 | 1.86E-01 | 3.26E-01 | 5.04E-01 | 1.54E+00 |
scores_checkin | -1.14E+00 | -1.50E-01 | -3.69E-02 | 7.56E-02 | 9.13E-01 |
scores_communication | -1.23E+00 | -2.15E-01 | -5.45E-02 | 8.96E-02 | 8.72E-01 |
Table 6: GWR Classification.
Room Type | Entire Home | Private Room | Shared | Hotel | ||||
Num of obs | 30787 | 20068 | 214 | 149 | ||||
Variable | 1st Qu. | 3rd Qu. | 1st Qu. | 3rd Qu. | 1st Qu. | 3rd Qu. | 1st Qu. | 3rd Qu. |
(Intercept) | 4.15E+00 | 5.31E+00 | 3.44E+00 | 4.63E+00 | 3.99E+00 | 4.07E+00 | 3.09E+00 | 3.15E+00 |
bedrooms | 2.94E-01 | 4.02E-01 | 1.48E-01 | 4.84E-01 |
|
| 1.78E-01 | 1.84E-01 |
scores_value | -3.06E-01 | -1.01E-01 | -3.43E-01 | -9.40E-02 | 7.77E-02 | 8.52E-02 | -5.50E-01 | -5.47E-01 |
Distance_Sta | -1.99E-04 | 4.57E-05 | -1.83E-04 | 3.02E-05 | 6.48E-05 | 6.81E-05 | -1.02E-05 | -3.56E-06 |
Length_Road | -5.65E-05 | 3.24E-05 | -6.06E-05 | 3.17E-05 | -5.62E-05 | -5.26E-05 | 2.89E-04 | 2.97E-04 |
Area_Green | -7.76E-07 | 4.13E-07 | -8.93E-07 | 2.29E-07 | -1.33E-06 | -1.27E-06 | 2.72E-06 | 2.88E-06 |
superhost | 1.01E-01 | 2.48E-01 | 7.20E-02 | 2.50E-01 | 3.51E-01 | 4.01E-01 | -6.95E-02 | -5.80E-02 |
num_reviews | -1.99E-03 | -1.22E-04 | -9.18E-04 | 3.03E-04 | -3.30E-04 | -2.91E-04 | -3.00E-03 | -2.97E-03 |
review_scores | 1.69E-01 | 3.96E-01 | 1.33E-01 | 4.03E-01 | -4.00E-02 | -3.33E-02 | 8.98E-01 | 9.00E-01 |
scores_checkin | -1.13E-01 | 5.53E-02 | -1.15E-01 | 1.11E-01 | -8.98E-02 | -4.98E-02 | -8.78E-02 | -8.06E-02 |
Scores_commu | -1.91E-01 | 1.01E-02 | -2.32E-01 | 3.94E-02 | -2.76E-03 | 4.84E-02 | -2.73E-01 | -2.65E-01 |
Mutiple R2 | 0.5451296 | 0.368423 | 0.09147867 | 0.4346917 | ||||
Adjusted R2 | 0.5012563 | 0.3086156 | 0.04021602 | 0.3859119 | ||||
AIC | 39616.61 | 31735.33 | 432.8207 | 298.7351 | ||||
AICc | 41946.31 | 33235.57 | 447.028 | 314.5719 | ||||
BIC | 27856.21 | 23368.71 | 265.6448 | 195.3401 | ||||
6. Conclusion and Discussion
After implementing the global Moran's I analysis and GWR model on the sample data, this article draws a conclusion that LnPrice presents clustered characteristics. In addition, the impact of some explanatory factors presents obvious spatial instability, especially for variables related to location and neighborhood presents, that is, their influence on LnPrice is either positive or negative. In addition, this article also conducts a classification discussion to integrate the impact of Room_Type on LnPrice.
However, constrained by the availability of data, this article acknowledges the presence of the following limitations: (1)The non-uniform distribution of room types within the sample population has the potential to impact the efficacy of the model; (2) The absence of significant factors, such as the age of the dwelling, within property-related explanatory variables is notable; (3) Factors that reflect the amenity, such as supermarkets and shops, are neglected in neighborhood-related explanatory variables; (4) Area_Green Space and Distance_Station are seriously affected by dimensions. Based on the above considerations, this article suggests that future research can expand the sample size to improve model interpretation, incorporate additional POI data, and standardize independent variables to avoid dimension effects.
References
[1]. DOGRU, T., MODY, M. & SUESS, C. 2019. Adding evidence to the debate: Quantifying Airbnb's disruptive impact on ten key hotel markets. Tourism Management, 72, 27-38.
[2]. ZHANG, Z., CHEN, R. J., HAN, L. D. & YANG, L. 2017. Key factors affecting the price of Airbnb listings: A geographically weighted approach. Sustainability, 9, 1635.
[3]. VOLTES-DORTA, A. & SÁNCHEZ-MEDINA, A. 2020. Drivers of Airbnb prices according to property/room type, season and location: A regression approach. Journal of Hospitality and Tourism Management, 45, 266-275.
[4]. LANCASTER, K. J. 1966. A new approach to consumer theory. Journal of Political Economy, 74, 132-157.
[5]. CAN, A. 1992. Specification and estimation of hedonic housing price models. Regional science and urban economics, 22, 453-474.
[6]. MAGNO, F., CASSIA, F. & UGOLINI, M. M. 2018. Accommodation prices on Airbnb: effects of host experience and market demand. The TQM Journal.
[7]. GUNTER, U. & ÖNDER, I. 2018. Determinants of Airbnb demand in Vienna and their implications for the traditional accommodation industry. Tourism Economics, 24, 270-293.
[8]. CASTRO, C. & FERREIRA, F. A. 2018. Online hotel ratings and its influence on hotel room rates: the case of Lisbon, Portugal. Tourism & Management Studies, 14, 63-72.
[9]. SOLER, I. P. & GEMAR, G. 2018. Hedonic price models with geographically weighted regression: An application to hospitality. Journal of Destination Marketing & Management, 9, 126-137.
[10]. LAWANI, A., REED, M. R., MARK, T. & ZHENG, Y. 2019. Reviews and price on online platforms: Evidence from sentiment analysis of Airbnb reviews in Boston. Regional Science and Urban Economics, 75, 22-34.
[11]. ANSELIN, L. & BERA, A. K. 1998. Spatial dependence in linear regression models with an introduction to spatial econometrics. Statistics textbooks and monographs, 155, 237-290.
[12]. MORAN, P. A. 1950. Notes on continuous stochastic phenomena. Biometrika, 37, 17-23.
[13]. WILLIAMS, V. R. 2022. London: Geography, History, and Culture, ABC-CLIO.
Cite this article
Liu,X.;She,Y.;Liu,M. (2024). The Impact of Spatial and Locational Characteristics on Airbnb Prices in London. Advances in Economics, Management and Political Sciences,69,238-246.
Data availability
The datasets used and/or analyzed during the current study will be available from the authors upon reasonable request.
Disclaimer/Publisher's Note
The statements, opinions and data contained in all publications are solely those of the individual author(s) and contributor(s) and not of EWA Publishing and/or the editor(s). EWA Publishing and/or the editor(s) disclaim responsibility for any injury to people or property resulting from any ideas, methods, instructions or products referred to in the content.
About volume
Volume title: Proceedings of the 2nd International Conference on Financial Technology and Business Analysis
© 2024 by the author(s). Licensee EWA Publishing, Oxford, UK. This article is an open access article distributed under the terms and
conditions of the Creative Commons Attribution (CC BY) license. Authors who
publish this series agree to the following terms:
1. Authors retain copyright and grant the series right of first publication with the work simultaneously licensed under a Creative Commons
Attribution License that allows others to share the work with an acknowledgment of the work's authorship and initial publication in this
series.
2. Authors are able to enter into separate, additional contractual arrangements for the non-exclusive distribution of the series's published
version of the work (e.g., post it to an institutional repository or publish it in a book), with an acknowledgment of its initial
publication in this series.
3. Authors are permitted and encouraged to post their work online (e.g., in institutional repositories or on their website) prior to and
during the submission process, as it can lead to productive exchanges, as well as earlier and greater citation of published work (See
Open access policy for details).
References
[1]. DOGRU, T., MODY, M. & SUESS, C. 2019. Adding evidence to the debate: Quantifying Airbnb's disruptive impact on ten key hotel markets. Tourism Management, 72, 27-38.
[2]. ZHANG, Z., CHEN, R. J., HAN, L. D. & YANG, L. 2017. Key factors affecting the price of Airbnb listings: A geographically weighted approach. Sustainability, 9, 1635.
[3]. VOLTES-DORTA, A. & SÁNCHEZ-MEDINA, A. 2020. Drivers of Airbnb prices according to property/room type, season and location: A regression approach. Journal of Hospitality and Tourism Management, 45, 266-275.
[4]. LANCASTER, K. J. 1966. A new approach to consumer theory. Journal of Political Economy, 74, 132-157.
[5]. CAN, A. 1992. Specification and estimation of hedonic housing price models. Regional science and urban economics, 22, 453-474.
[6]. MAGNO, F., CASSIA, F. & UGOLINI, M. M. 2018. Accommodation prices on Airbnb: effects of host experience and market demand. The TQM Journal.
[7]. GUNTER, U. & ÖNDER, I. 2018. Determinants of Airbnb demand in Vienna and their implications for the traditional accommodation industry. Tourism Economics, 24, 270-293.
[8]. CASTRO, C. & FERREIRA, F. A. 2018. Online hotel ratings and its influence on hotel room rates: the case of Lisbon, Portugal. Tourism & Management Studies, 14, 63-72.
[9]. SOLER, I. P. & GEMAR, G. 2018. Hedonic price models with geographically weighted regression: An application to hospitality. Journal of Destination Marketing & Management, 9, 126-137.
[10]. LAWANI, A., REED, M. R., MARK, T. & ZHENG, Y. 2019. Reviews and price on online platforms: Evidence from sentiment analysis of Airbnb reviews in Boston. Regional Science and Urban Economics, 75, 22-34.
[11]. ANSELIN, L. & BERA, A. K. 1998. Spatial dependence in linear regression models with an introduction to spatial econometrics. Statistics textbooks and monographs, 155, 237-290.
[12]. MORAN, P. A. 1950. Notes on continuous stochastic phenomena. Biometrika, 37, 17-23.
[13]. WILLIAMS, V. R. 2022. London: Geography, History, and Culture, ABC-CLIO.