


1.Introduction
ILO (International Labour Organization) monitoring shows that COVID-19 has seriously impacted the world labor market by reducing working hours [1]. In April 2020, the U.S. unemployment rate hit a record high of 14.7 percentage points due to the loss of approximately 20.5 million jobs [2]. The unemployment insurance claims report for the week ending March 21, 2020, shows that more than 3.3 million workers filed for unemployment insurance, an unprecedented number even during the deep recession [3]. The occupational risk of COVID-19 exposure also appears to be greater in more precarious categories of workers, including insecure employment, inadequate income, and a lack of rights and protection [4]. Women, younger workers, migrants, Hispanics, lower-skilled workers, and lower-educated workers are at disproportionate risk of working under precarious conditions and suffering poor health outcomes as a result [5-14]. Crucially, precarious work often intersects with other factors of vulnerability. However, there is a lack of evidence on whether a pandemic exacerbates economic inequalities among precarious workers in the face of the dual burden of post-infection negative health outcomes and already vulnerable financial hardship.
This study examined whether the income of single households was affected by the infected with COVID-19. Based on previous studies, we focused our main study target on the part of precarious workers (part-time workers, young adults, Hispanics, women, urban dwellers, and low-education groups). In addition, it was considered that groups with one or more underlying diseases are also economically vulnerable during the pandemic. This is because they are at higher risk of developing serious diseases because of COVID-19 infection, which implies more time to recover and more medical expenses. Therefore, our target also includes groups with underlying diseases (hypertension, obesity, diabetes, cardiovascular disease, asthma, chronic lung disease). We used a difference-in-difference model to compare the average income gap between individuals infected covid-19 and those uninfected covid-19 within different groups. To demonstrate that individuals in a particular group suffer more severe economic hardship due to infected COVID-19.
I used data from NHIS 2021, which describes how the early stage of the pandemic has increased income inequality between different groups. The results show that full-time sample adults infected with COVID-19 have significantly lower incomes than those uninfected. This is consistent with our assumption 1 that the infected group is relatively disadvantaged in terms of income compared with the uninfected group. This proves that infection with COVID-19 incurs a time cost that is associated with reduced income. In contrast, I did not find an obvious gap in income between infected and uninfected sample adults within the part-time group. This may be due to the average income of part-time workers being much lower than that of full-time workers, and thus their time costs due to COVID-19 infection are also smaller. In several financially vulnerable groups (low-educated, nonmetropolitan dwellers, with hypertension), unexpectedly found that infected individuals had higher incomes than uninfected individuals. In other words, the sample adults with hypertension, low education, or non-metropolitan residents who were not infected with COVID-19 were the most disadvantaged financially. Finally, based on the available evidence, I suggested that the sample adults in the low-education, non-metropolitan, and hypertensive groups became unemployed due to COVID-19 infection. This led to eligibility for unemployment benefits under the CARES Act during the pandemic, which enabled them to overcome the economic shock. This also coincides with a sharp rise in the number of people receiving unemployment benefits.
2.Literature Review
The occupational risk of COVID-19 exposure also appears to be greater in more precarious categories of workers, including younger workers and those in low-income and low-skilled occupations [4]. Crucially, precarious work often intersects with other axes of vulnerability. Women, younger workers, migrants, lower-skilled workers, and lower-educated workers are at disproportionate risk of working under precarious conditions and suffering poor health outcomes [5-14]. Because they have low incomes and limited access to cash and credit, the reduction and loss of income during a pandemic make it difficult to sustain their livelihoods. The health damage caused by the infection also undoubtedly exacerbates this economic hardship. In addition to individuals of lower socioeconomic status like Hispanics, those with less than a bachelor's degree, and those with one or more underlying diseases are disproportionately bearing the negative economic impact of the covid-19 pandemic.
Although, there is ample evidence that the pandemic disproportionately affects the finances of different groups. However, many of the studies are descriptive rather than causal and also use early pandemic data. Therefore, these results should be interpreted with greater caution. However, these studies are useful in helping us to identify which subgroups are experiencing the most severe difficulties. Many studies addressing the risk of COVID-19 transmission in the workplace can lead to an increased risk of poor health status. Precarious workers' pre-existing economic vulnerability, as well as high exposure risk in unstable occupations, both exacerbate negative health effects. However, there is a lack of evidence that facing an adverse health condition such as infected status increases the burden of already fragile economies. Despite the prior studies showing that COVID-19 infection leads to unemployment, they did not involve the loss of income [14]. This leads us to ignore those special groups who are not unemployed and those who are re-employed come out of economic hardship. Whether income inequality has increased a year after the pandemic remains unclear. Several studies have examined the loss of employment income due to differences in covered insurance, health status, and income level, but have not explicitly analyzed the loss of employment income due to COVID-19 infection as a cause [13]. Individuals' self-reported health status was used as an independent variable to explain changes in income. This may lead to an underestimation of the impact of post-infection ill health on the labor market. Infected persons, even after recovery, may face economic hardship due to unemployment. There is also evidence that there is no statistically significant difference in lost jobs between men and women due to the COVID-19 pandemic in Japan and Korea [15]. However, this was limited to studies between genders and used infection rates as explanatory variables, which were much higher in the United States than in Japan and Korea.
3.Research Methodology
3.1.Study design
This study examined whether the income of single-adult households was affected by sample adults who were infected with COVID-19. Based on previous studies, the primary focus is on whether economically vulnerable groups suffer more severe financial hardship due to infection. Hence, I define all primary objectives of the study as fragile groups (part-time workers, young adults, Hispanics, women, metropolitan dwellers, low education, hypertension, obesity, diabetes, cardiovascular disease, asthma, and chronic lung disease groups). The key fragile - not fragile comparison is captured in the following models, with analyses focused on outcomes reflecting the impact of the pandemic on the income of a single-adult household.
INCi=α+β1COVIDi*Xi+β2COVIDi +β3Xi+εi
INCi is the value of a single family’s income; εi is an error term, with zero expectation and orthogonal to predictors; COVIDi is a dummy variable for infected status if the sample adults have infected COVID-19 then covid=1, otherwise covid=0. β2 represents the difference in income between the ever-infected and never-infected groups in not-fragile groups. Xi is a dummy variable. Suppose the sample adults belong to the fragile groups, then Xi=1; otherwise, Xi=0. β3 represents the difference in income between the fragile groups and not fragile groups when uninfected by COVID-19. β1 is the difference-in-differences estimator. The difference in outcome due to group and infection status is captured by a dummy variable cross-term COVIDi*Xi, whose parameter estimates the average treatment effect ATE.
β1 =E [INCi | COVIDi = 1, Xi=1] – E [INCi | COVIDi= 0, Xi=1] −
E [INCi | COVID i= 1, Xi=0] − E [INCi | COVIDi= 0, Xi=0]
We propose 2 hypotheses.
1 The infected covid-19 group is relatively disadvantaged in terms of income compared with the uninfected covid-19 group.
2 Part of the precarious workers, including those with underlying disease, who are infected with COVID-19, will lead to a greater reduction in income for their single-adult families than for uninfected single-adult families.
If β1 is negative and statistically significant, hypotheses 1 and 2 both hold. Compared to the uninfected sample adults, the infected sample adults were economically disadvantaged, and the fragile group experienced a more severe income shock. If positive and statistically significant, it means that hypothesis 1 holds, but hypothesis 2 does not, that the sample adults in the not fragile group, experienced more severe economic hardship due to covid-19 infection. While if β1 is statistically insignificant, income changes experienced within the fragile group due to infected COVID-19 were the same as in the not fragile group.
3.2.Data Collection
The National Health Interview Survey (NHIS) is a household interview survey data cross-section. The target population is civilian non-institutionalized persons residing in the 50 U.S. states and the District of Columbia at the time of the interview. Using a geographic subgroup sampling technique to select a sample of NHIS dwelling units to make each month's sample nationally representative.
3.3.Data Analysis
A total of 29,482 adults (18 years and older) in the NHIS sample households were interviewed by telephone or at home. Table 2 shows that after constraining the data to single-adult families, 10366 sample data were obtained. This allowed us to assume that the sample follows a normal distribution and satisfies the consistency estimator. Table 1 provides the distribution of single-adult families in terms of demographic characteristics, health factors, and factors of work and income.
The appendix shows the poverty thresholds include a set of money income thresholds that vary by family size and composition but do not vary geographically [17]. The household income of the sample adults is calculated by multiplying the household poverty rate by the threshold.
Table 1: Description of the individual characteristics of single-family
|
Variable |
Description |
Code |
Number of observations |
Percentage |
|
Novaccine |
Sample adults (SA) were not vaccinated |
nvac=1 |
4520 |
44.39% |
|
Sample adults (SA) were vaccinated |
nvac=0 |
5662 |
55.61% |
|
|
Gender |
Female |
sex=1 |
4285 |
41.34% |
|
Male |
sex=0 |
6080 |
58.66% |
|
|
Insurance |
Not covered by insurance |
insur=1 |
788 |
7.60% |
|
Covered by insurance |
insur=0 |
9578 |
92.40% |
|
|
Hispanic |
Sample adult (SA) is hispanic |
hisp=1 |
1084 |
10.46% |
|
Sample adult (SA) is Nonhispanic |
hisp=0 |
9282 |
89.54% |
|
|
Age |
<65 years old |
age=1 |
6210 |
59.91% |
|
>=65 years old |
age=0 |
4156 |
40.09% |
|
|
Education |
Non bachelor's degree |
edu=1 |
6616 |
63.82% |
|
At least one bachelor's degree |
edu=0 |
3750 |
36.18% |
|
|
Metropolian |
Metropolian (metropolitan statistical area population over 50,000) |
urb=1 |
8778 |
84.68% |
|
Non metropolian (urban cluster population 49999 to 10,000). |
urb=o |
1588 |
15.32% |
|
|
Prat-time |
Single-adult family’ SA are working part-time |
par=1 |
6153 |
59.36 |
|
Single-adult family’ SA are working full-time |
par=0 |
4213 |
40.64% |
|
|
Hypertension |
Had hypertension or hyperlipidemia in the past 12 months |
hyp=1 |
3157 |
30.58% |
|
Hadn’t hypertension or hyperlipidemia in the past 12 months |
hyp=0 |
7166 |
69.42% |
|
|
Asthma |
Still have asthma |
asthstill=1 |
1004 |
9.71% |
|
not still have asthma & never had asthma |
asthstill=0 |
9340 |
90.29% |
|
|
Cancer |
Still under treatment for cancer |
cancer=1 |
152 |
1.47% |
|
Not under treatment or never had cancer |
cancer=0 |
10191 |
98.53% |
|
|
Diabetes |
Ever had diabetes |
diabe=1 |
1260 |
12.17% |
|
Never had diabetes |
diabe=0 |
9090 |
87.83% |
|
|
BMI |
Obese, BMI>=30 |
bmi=1 |
3305 |
32.82% |
|
Not obese, BMI<30 |
bmi=0 |
6766 |
67.18% |
|
|
COPD, |
Ever had been COPD, emphysema, chronic bronchitis |
copd=1 |
814 |
7.87% |
|
Neve had been COPD, emphysema, chronic bronchitis |
copd=0 |
9533 |
92.13% |
|
|
CardiovascularConditions |
Ever had been coronary heart disease, angina pectoris, heart attack, stroke |
cvc=1 |
1366 |
13.22% |
|
Never had been coronary heart disease, angina pectoris, heart attack, stroke |
cvc=0 |
8967 |
86.78% |
|
|
Covid-19 |
Infected covid-19 |
covid=1 |
1061 |
10.32% |
|
Not infected |
covid=0 |
9224 |
89.68% |
Table 2: Describe relate variables of the single-family income
|
Variable |
Description |
Code |
Number of observations |
Mean |
Standard deviation |
Median |
|
Income |
One adult Family Income |
Income |
10366 |
49903.89 |
39013.58 |
38661.39 |
|
Poverty rate |
One adult Family poverty rate |
Poverty |
10366 |
3.507276 |
2.735684 |
2.74 |
4.Results
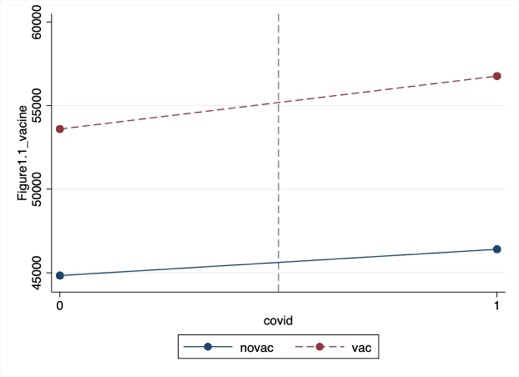
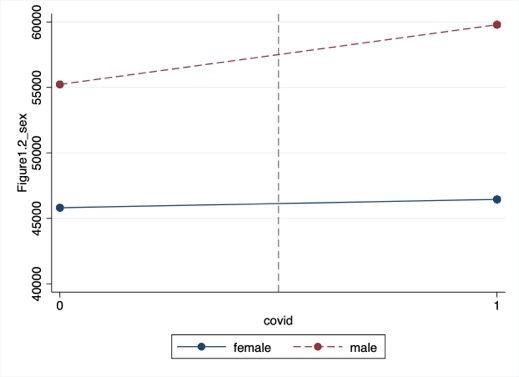
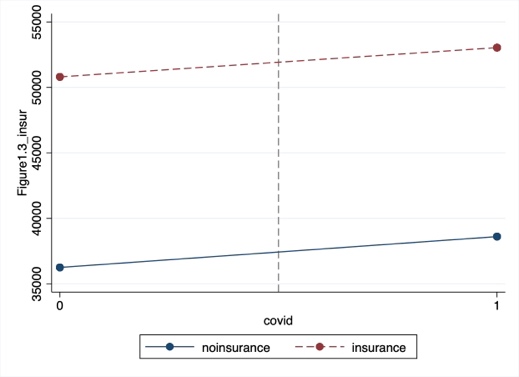
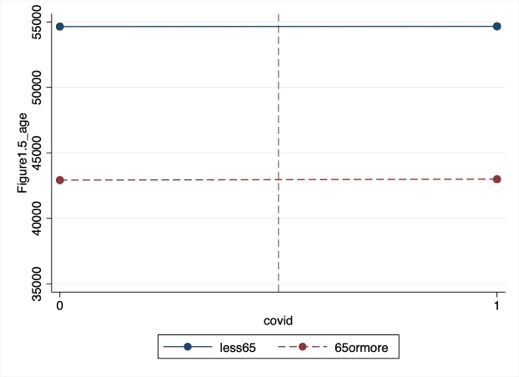
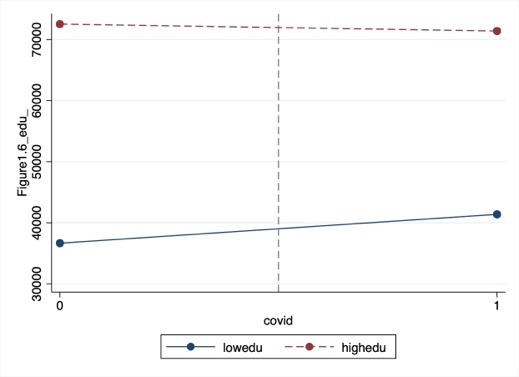
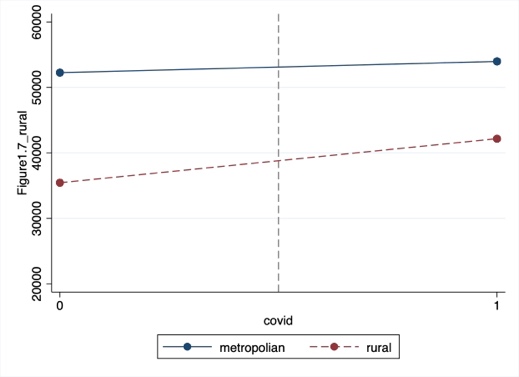
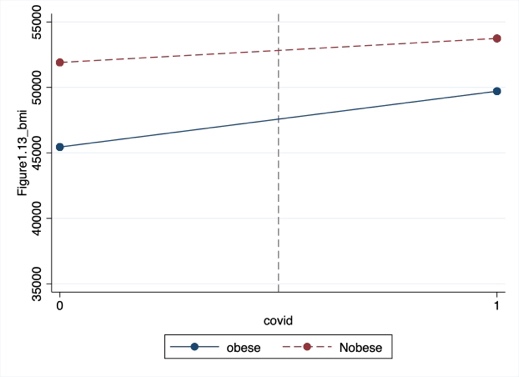
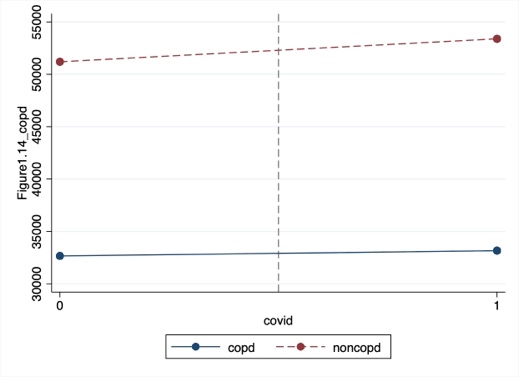
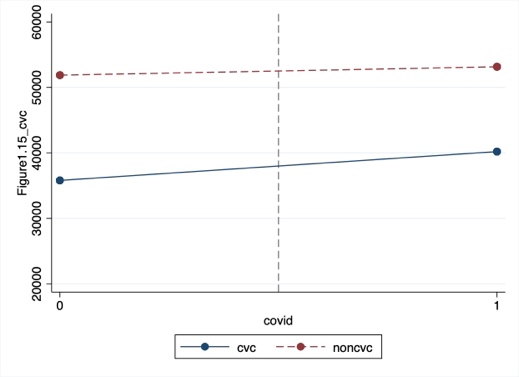
For each of the sub-groups, I first compared the average income between the infected sample adults and the uninfected (Table 3). Additionally, based on the mean value, the difference in the difference graph was generated (Figure 1). To ascertain that the fragile and non-fragile groups have different sizes of mean income gaps, we merged the graphs of differences in differences and the average income gap between the infected and uninfected in each subgroup. Filter out independent variables with comparable income gaps between infected and uninfected individuals within the fragile and non-fragile groups. To demonstrate statistically significant variations in the mean income gap between the fragile and non-fragile groups, the remaining subgroups ran linear regressions.
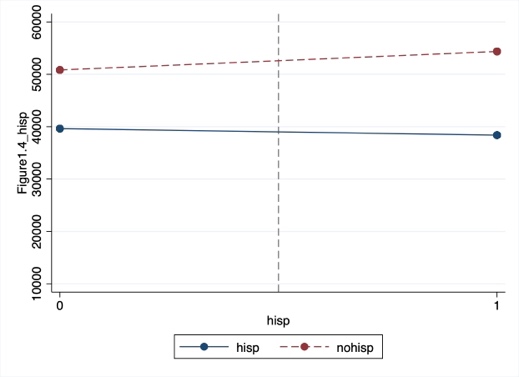
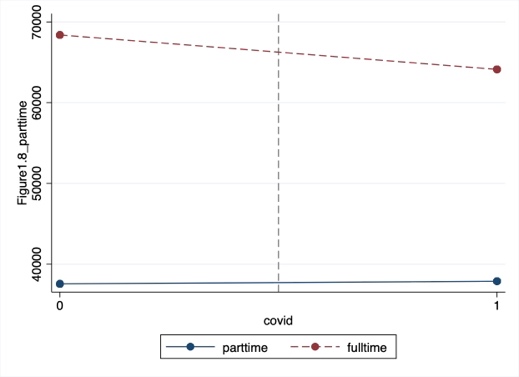
In Figure 3 and Figures 1.1, 1.2, 1.3, and 1.7, we observed that the mean income of the sample adults infected with COVID-19 in both fragile and non-fragile groups was higher than the mean income of the sample adults uninfected with COVID-19. The mean income of sample adults infected with COVID-19 in the unvaccinated group was $1,575 higher than the mean income of sample adults not infected, a smaller gap than in the vaccinated group. The gap in mean income between infected and uninfected sample adults in the females or metropolitan residents’ groups is small. However, the gap between the mean income of infected and uninfected sample adults within the male and nonmetropolitan resident groups was large. Also, the income gap between infected and uninfected sample adults was similar in the insurance coverage and non-insurance coverage groups. Of special interest is that in Table 3 and Figures 1.4, 1.5, 1.6, and 1.8, we find that the mean income of infected COVID-19 sample adults in the Hispanic group is lower than that of uninfected ones, whereas the situation is exactly the opposite in the non-Hispanic group. In addition, the average income of infected sample adults in the low-education (no bachelor's degree) group was $4,727 higher than that of the uninfected, while the average income of infected sample adults in the high-education (at least one bachelor's degree) group was $1,132 lower than that of the uninfected. Although we observed that the average income of infected individuals in the low-education group was higher than uninfected individuals, it was still far lower than the average income of the high-education group. No obvious gap in mean income was observed between infected and non-infected sample adults in the part-time group. In contrast, the mean income of infected sample adults in the full-time group was $4,264 lower than that of uninfected sample adults. Importantly, the decline in mean income was greatest among those with the disease who worked full-time. Additionally, we found that the mean income gap for COVID-19 infection was not significant among the sample adults in the younger and older groups. Also, as observed in Table 3 and Figures 1.9-1.15, in a series of underlying disease groups, the mean income of sample adults infected with COVID-19 was higher than that of uninfected ones.
Finally, we excluded the group with similar gaps in mean income between the infected and uninfected sample adults in the corresponding fragile and not-fragile groups. Regressions were run separately for the remaining 13 groups (non-vaccine, gender, Hispanic, education, metropolitan residence, part-time employment; hypertension, diabetes, cancer, obesity, COPD, and cardiovascular disease). The types of workers, educational levels, and residence groups showed the only statistically significant variations in the findings, which are summarized in Table 4. The results show that the income of the infected sample adults living in non-metropolitan areas was higher than that of the uninfected sample adults. And this gap is larger than the income gap between infected and uninfected living in metropolitan areas. The income of the COVID-19-infected sample adults in the full-time group was lower than that of the uninfected. The gap is also much larger than the income gap between infected and uninfected sample adults in the part-time group. In addition, the income of infected sample adults in the low-education group was higher than that of uninfected ones. In contrast, the income of infected COVID-19 sample adults in the high-education group was slightly below that of uninfected adults. Among the numerous underlying diseases, only the hypertension group showed significant differences. This implies that the direct positive income difference between COVID-19-infected and uninfected hypertensive patients is much greater than the positive income difference within the non-hypertensive group.
Table 3: Descriptive analysis of the difference in the mean one-adult-family income of those with and without COVID-19 infection according to the individual characteristics
|
Non-infected |
Median |
Infected |
Median |
||
|
Vaccine |
Not vaccinated |
44835.56(37174.02) |
33659.64 |
46410.76(34319.33) |
37029.76 |
|
Vaccinated |
53596.32(40208.19) |
41868.09 |
56761.23(41113.09) |
47083.98 |
|
|
Gender |
Female |
45815.01(37089.78) |
34492.98 |
46449.52(36472.92) |
36511.23 |
|
Male |
55228.82(41114.25) |
41868.09 |
59790(39676.75) |
52297.73 |
|
|
Insurance |
Not covered |
36254.03(31326.03) |
29158.45 |
38612.34(31679.3) |
29253.54 |
|
Covered |
50804.64(39451.57) |
39839.87 |
53036.86(38682.41) |
41868.09 |
|
|
Hispanic |
Hispanic |
39638.27(35357.16) |
27850.75 |
38388.03(29785.2) |
27207.21 |
|
Not hispanic |
50830.29(39324.46) |
40176.45 |
54366.07(39244.58) |
45981.03 |
|
|
Age |
Younger<65 |
54645.25(42408.79) |
41868.09 |
54665.16(39403.27) |
47075.01 |
|
Older>=65 |
42921.12(32789.62) |
32360.04 |
42990.43(33349.22) |
31320.36 |
|
|
Education |
No bachelor's degree |
36661.47(29288.77) |
28201.32 |
41388.7(32104.13) |
32309.88 |
|
At least one bachelor's degree |
72527.75(43369.35) |
62770.68 |
71395.76(41332.79) |
62770.68 |
|
|
Residence |
Metropolitan |
52252.33(40091.16) |
41847.12 |
53973.64(39805.87) |
41868.09 |
|
Non-metropolitan |
35440.21(29011.25) |
27161.64 |
42165.11(28904.21) |
35524.44 |
|
|
Part-time |
Part-time job |
37557.62(32092.31) |
26121.96 |
37886.37(34102.68) |
26079.45 |
|
Full-time job |
68384.2(41442.2) |
57572.28 |
64120.63(37704.82) |
52793.27 |
|
|
Hypertension |
Hypertention |
40756.22(33578.2) |
31295.34 |
48527.05(38512.9) |
36518.76 |
|
No hypertension |
53685.42(40693.8) |
41868.09 |
53262.78(38250.13) |
41868.09 |
|
|
Asthma |
Still have asthma |
41957.56(36591.58) |
31218.33 |
44308.02(38397.27) |
31218.33 |
|
Not still have asthma |
50505.58(39232.6) |
39760.65 |
52971.26(38265) |
41868.09 |
|
|
Cancer |
Under treatment for cancer |
42356.1(30832.02) |
37663.7 |
55850.24(45663.06) |
47900.75 |
|
Not under treatment |
49799.94(39170.79) |
38598.12 |
51820.5(38256.51) |
41868.09 |
|
|
Diabet |
Ever had diabetes |
37048.3(32343.96) |
25978.89 |
37567.03(32871.59) |
26121.96 |
|
Never had diabetes |
51472.22(39615.89) |
41836.48 |
53746.87(38674.29) |
41868.09 |
|
|
Bmi |
Obese |
45447.39(36345.04) |
35479.08 |
49712.79(36233.07) |
41836.48 |
|
Not obese |
51905.58(40223.36) |
41847.12 |
53740.11(39871.89) |
41868.09 |
|
|
Copd |
COPD, emphysema, chronic bronchitis |
32664.09(28615.21) |
22696.17 |
33174.24(31469.39) |
20273.76 |
|
Not COPD, emphysema, chronic bronchitis |
51195.59(39518.93) |
41697.21 |
53388.47(38496.88) |
41868.09 |
|
|
CardiovascularConditions |
Ever had been coronary heart disease |
35794.76(31006.06) |
25087.47 |
40195.67(32662.6) |
30085.74 |
|
Never had been coronary heart disease |
51872.74(39731.07) |
41847.12 |
53152.09(38756.02) |
41868.09 |
Table 4: Preliminary regression results
|
variables |
N |
Std.Err. |
T |
difference in difference effect |
P>ItI |
95% conf. intrtval |
|
vaccine*covid |
10148 |
2471.169 |
-0.64 |
-1589.705 |
0.520 |
-6433.685 3254.275 |
|
sex*covid |
10,284 |
2539.053 |
-1.55 |
-3926.676 |
0.122 |
-8903.714 1050.362 |
|
Hispanic*covid |
10,285 |
2935.689 |
-1.63 |
-4786.026 |
0.103 |
-10540.55 968.4952 |
|
Education*covid |
10,285 |
2606.276 |
2.25 |
5859.219 |
0.025 |
750.4096 10968.03 |
|
metropolian*covid |
10,285 |
2654.613 |
-1.88 |
-5003.593 |
0.059 |
-10207.15 199.9655 |
|
part-time*covid |
10,285 |
2347.403 |
1.96 |
4592.319 |
0.050 |
-9.048202 9193.687 |
|
Hypertension*covid |
10,244 |
2753.976 |
2.98 |
8193.466 |
0.003 |
2795.134 13591.8 |
|
cancer*covid |
10,268 |
11433.82 |
1.00 |
11473.57 |
0.316 |
-10938.96 33886.1 |
|
diabete*covid |
10,269 |
3401.887 |
-0.52 |
-1755.91 |
0.606 |
-8424.272 4912.452 |
|
bmi*covid |
10,000 |
2561.84 |
0.95 |
2430.877 |
0.343 |
-2590.846 7452.599 |
|
COPD*covid |
10,267 |
3897.69 |
-0.43 |
-1682.733 |
0.666 |
-9322.967 5957.5 |
|
CVC*covid |
10,253 |
3563.93 |
0.88 |
3121.546 |
0.381 |
-3864.454 10107.55 |
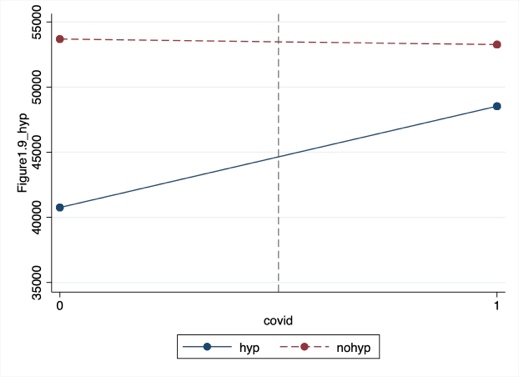
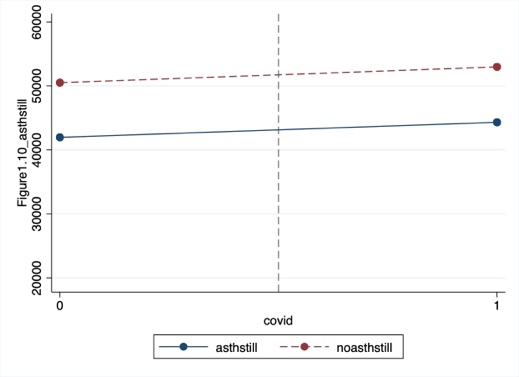
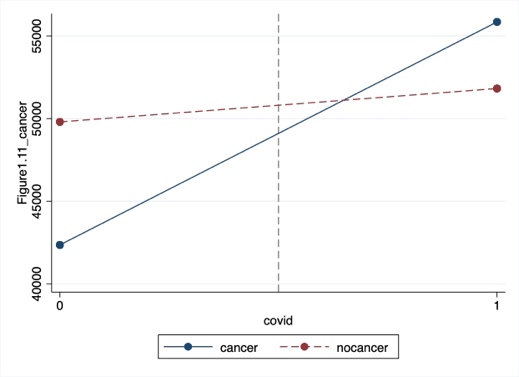
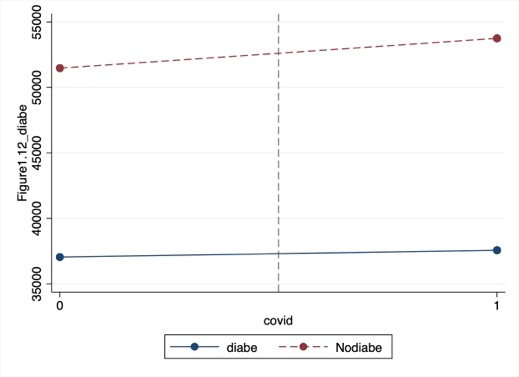
Figures1.1-1.15: The difference in difference graph based on the mean values.
5.Conclusion and Discussion
Our results show that full-time workers infected with COVID-19 have significantly lower incomes than uninfected full-time workers. This is consistent with our assumption 1 that the infected group is relatively disadvantaged in terms of income compared with the uninfected group. This proves that infection with COVID-19 incurs a time cost that is associated with reduced income. In particular, we observed that the income of full-time workers was much higher than the income of part-time workers. Therefore, the time cost of absenteeism due to infected COVID-19 was also higher for full-time workers. This also explains why the negative mean income gap between infected and uninfected workers was larger in the full-time worker group. In contrast, no obvious income gap due to infection in the part-time worker group. This can be attributed to the income of part-time workers being lower, and the time cost of health recovery is also lower. The result is inconsistent with assumption 2 and a prior study, that pandemics expose precarious workers to worse financial hardship [4].In addition, the results also showed that the income of the infected COVID-19 sample adults was higher than the uninfected sample adults in the low-education, living non-metropolitan, hypertension group. Inconsistent with previous findings, there was no obvious gap in income between the infected COVID-19 sample adults and the uninfected sample adults in the metropolitan group. To summarize adults in the COVID-19-uninfected sample of low-educated, non-metropolitan residents, part-time workers, or hypertensive patients were the most economically disadvantaged.
To interpret the results, we examined the sample size within each group that was participating in the work. Therefore, we have two possibilities, one being that the sample size in these groups was too small, leading to a bias in the results. Another hypothesis is that individuals in these groups were already economically vulnerable before the pandemic [18-23]. The relatively low average income of low-education and non-urban residents is evidence of the economic vulnerability of these groups. Since low-skilled precarious workers are easily replaced, precarious workers infected covid-19 may lose their jobs. This also explains part of the rise in unemployment. Although the sample adults in the hypertensive, low-education, non-metropolitan population incur the cost of time to recover due to infection, they receive adequate unemployment benefits from the government. This also coincides with a sharp rise in the number of people receiving unemployment benefits. Unemployment led to eligibility for unemployment benefits under the CARES Act during the pandemic, resulting in an unintended effect [ 24-27]. Also, it can explain why the low-education, non-metropolitan, and hypertension sample adults uninfected with COVID-19 suffered the most severe economic hardship. Since they are not unemployed, they cannot receive unemployment benefits either. We must be aware that those individuals in vulnerable groups who are not infected with COVID-19 are also experiencing economic hardship. These groups, already struggling to provide necessities for themselves and their families before the pandemic, have been faced with reduced opportunities for earning wages and lack sufficient public support to buffer the impact of this public health crisis.
Finally, due to data limitations, our results hold only in the context of single-adult households and do not apply to households with two or more adults. Although we also conducted the same regression for all household income, unlike single-adult households, we found statistical significance in the vaccine, sex, Hispanic, COPD, and cardiovascular disease groups. Although it is difficult to explain the reason for the difference, it may be evidence that the infection status of other household members also had an impact on the household income of the sample adults. Moreover, it is impossible to determine whether this financial hardship is temporary or will increase over time. Unemployment benefits can only improve financial hardship for the period of receiving the benefit. This does not address the root of the problem. The government needs more policies to help individuals through the economic crisis and stimulate labor force recall. Future research should examine the long-term impact of the COVID-19 pandemic on household finances and the extent to which financial difficulties are likely to persist or intensify as unemployment benefits end.
References
[1]. Chi-Wei Su, Ke Dai, Sana Ullah & Zubaria Andlib (2022) COVID-19 pandemic and unemployment dynamics in European economies, Economic Research-Ekonomska Istraživanja, 35:1, 1752-1764, DOI: 10.1080/1331677X.2021.1912627
[2]. Rakesh Kochhar, JUNE 11, 2020, Unemployment rose higher in three months of COVID-19 than it did in two years of the Great Recession, https://pewrsr.ch/2UADTTZ
[3]. Ayşegül Şahin, Murat Tascı, and Jın Yan*, Number 2020-09 May 7, 2020, The Unemployment Cost of COVID-19: How High and How Long, Economic Commentary DOI: 10.26509/frbc-ec-202009
[4]. Courtney L. McNamara1, Martin McKee2, David Stuckler, 2021, Precarious employment and health in the context of COVID-19: a rapid scoping umbrella review, European Journal of Public Health, Vol. 31, Supplement 4, iv40–iv49
[5]. Meghan R. Owens, Francilia Brito-Silva, Tracie Kirkland, Carolyn E. Moore, Kathleen E. Davis, Mindy A. Patterson, Derek C. Miketinas and Wesley J. Tucker,28 July 2020; Prevalence and Social Determinants of Food Insecurity among College Students during the COVID-19 Pandemic, Nutrients 2020, 12, 2515; doi:10.3390/nu12092515
[6]. Gerald E. Daniels Jr., Ph.D. a, and Matthew H. Morton, D.Phil, January 11, 2022, COVID-19 Recession: Young Adult Food Insecurity, Racial Disparities, and Correlates, Journal of Adolescent Health xxx (2022) 1e9
[7]. Carol Bruce, Maeve E. GearingI, Jill DeMatteis, Kerry Levin, Timothy Mulcahy, Jocelyn Newsome, Jonathan Wivagg, May 12, 2021, Financial vulnerability and the impact of COVID-19 on American households, https://doi.org/10.1371/journal.pone.0262301
[8]. Institute for Women's Policy Research (2020), Women lost more jobs than men in almost all sectors of the economy, https://iwpr.org/wp-content/uploads/2020/07/QF-Jobs-Day-April-FINAL.pdf
[9]. Kate Bahn, Jennifer Cohen, Yana van der Meulen Rodgers, First published: 07 May 2020, A feminist perspective on COVID-19 and the value of care work globally, https://doi.org/10.1111/gwao.12459
[10]. Amber N. W. Raile, Elizabeth A. Shanahan, Eric D. Raile, David C. W. Parker, Pavielle Haines, Accepted: 11 November 2020, Women and the weight of a pandemic: A survey of four Western US states early in the Coronavirus outbreak, Gender Work Organ. 2021;28(S2):554–565.
[11]. Fast Company,03-20-20, https://www.fastcompany.com/90479204/why-women-will-be-hardest-hit-by-a-coronavirus-driven-recession
[12]. CATALYST WORKPLACES THAT WORK FOR WOMEN, Aug 29, 2022, Women in the Workforce: United States (Quick Take), https://www.catalyst.org/research/women-in-the-workforce-united-states/
[13]. Okechukwu D. Anyamele, Saundra M. McFarland, Kenneth Fiakofi, 2020, The Disparities on Loss of Employment Income by US Households During the COVID‐19 Pandemic, Journal of Economics, Race, and Policy (2022) 5:115–133, https://doi.org/10.1007/s41996-021-00086-1
[14]. Kenneth A. Couch a, 5 August 2020, Robert W. Fairlie b,c,d, Huanan Xu, Early evidence of the impacts of COVID-19 on minority unemployment, Journal of Public Economics 192 (2020) 104287
[15]. Hai-Anh H.Dangab Cuong Viet Nguyencd, 2020, Gender inequality during the COVID-19 pandemic: Income, expenditure, savings, and job loss, J16J21O12, https://www.sciencedirect.com/science/article/pii/S0305750X2030423X?casa_token=YJdGIMAWlUcAAAAA:dNYfikohMI9XJ20OlG1B6hxgrkj5ceWVSlPvG2Elw2f19dLjTegZ7oJz3-tHi3tdJUMVSWd52LGg
[16]. World Health Organization, World Health Statistics 2022, ISBN: 9789240051157; 9789240051140 (electronic version),https://www.who.int/data/gho/publications/world-health statistics
[17]. CDC, poverty rate, https://www.cdc.gov/nchs/hus/sources-definitions/poverty.htm
[18]. Alexander W. Bartik, Marianne Bertrand, Zoe Cullen, and Christopher Stanton, July 10, 2020, The impact of COVID-19 on small business outcomes and expectations, 117 (30) 17656-17666,https://www.pnas.org/doi/10.1073/pnas.2006991117
[19]. Lauren Bauer, Kristen Broady, Wendy Edelberg, and Jimmy O’Donnell, ECONOMIC FACTS | SEPTEMBER 2020, Ten Facts about COVID-19 and the U.S. Economy
[20]. Dimitris Papanikolaou, Lawrence D W Schmidt,15 November 2021, Working Remotely and the Supply-Side Impact of COVID-19,https://academic.oup.com/raps/article-abstract/12/1/53/6428551?login=false
[21]. .Robert W. Fairlie, Ph.D. Economic Consulting Santa Cruz, CA 95060, August 16, 2022, The Impacts of COVID-19 on Racial Disparities in Small Business Earnings, 73351021R0008, https://cdn.advocacy.sba.gov/wp-content/uploads/2022/08/16104005/Report_COVID-and-Racial-Disparities_508c.pdf
[22]. Ayşegül Şahin, Murat Tascı, and Jın Yan*, Number 2020-09 May 7, 2020, The Unemployment Cost of COVID-19: How High and How Long? , Economic Commentary DOI: 10.26509/frbc-ec-202009
[23]. Alexander W. Bartik, Marianne Bertrand, Feng Lin, Jesse Rothstein & Matt Unrath, July 2020, Measuring the labor market at the onset of the COVID-19 crisis, DOI 10.3386/w27613
[24]. THE INVESTOPEDIA TEAM, Updated September 03, 2022, What Is the CARES Act? , Government & Policy , https://www.investopedia.com/coronavirus-aid-relief-and-economic-security-cares-act-4800707
[25]. Julia Raifman, Jacob Bor, and Atheendar Venkataramani, July 2020, Unemployment insurance and food insecurity among people who lost employment in the wake of COVID-19, medRxiv preprint doi: https://doi.org/10.1101/2020.07.28.20163618.t
[26]. Peter Ganong, Pascal Noel, Joseph Vavra, 13 May 2020, US unemployment insurance replacement rates during the pandemic, Journal of Public Economics 191 (2020) 104273
[27]. Shikha Garg et al., March 1–30, 2020, Morbidity and Mortality Weekly Report, Hospitalization Rates and Characteristics of Patients Hospitalized with Laboratory-Confirmed Coronavirus Disease 2019 — COVID-NET, 14 States, MMWR / April 17, 2020 / Vol. 69 / No.
Cite this article
Nan,Z. (2024). Evidence from Empirical Studies: Which Groups of Individuals Experience More Severe Income Hardship Due to COVID-19 Infection?. Advances in Economics, Management and Political Sciences,70,18-30.
Data availability
The datasets used and/or analyzed during the current study will be available from the authors upon reasonable request.
Disclaimer/Publisher's Note
The statements, opinions and data contained in all publications are solely those of the individual author(s) and contributor(s) and not of EWA Publishing and/or the editor(s). EWA Publishing and/or the editor(s) disclaim responsibility for any injury to people or property resulting from any ideas, methods, instructions or products referred to in the content.
About volume
Volume title: Proceedings of the 2nd International Conference on Financial Technology and Business Analysis
© 2024 by the author(s). Licensee EWA Publishing, Oxford, UK. This article is an open access article distributed under the terms and
conditions of the Creative Commons Attribution (CC BY) license. Authors who
publish this series agree to the following terms:
1. Authors retain copyright and grant the series right of first publication with the work simultaneously licensed under a Creative Commons
Attribution License that allows others to share the work with an acknowledgment of the work's authorship and initial publication in this
series.
2. Authors are able to enter into separate, additional contractual arrangements for the non-exclusive distribution of the series's published
version of the work (e.g., post it to an institutional repository or publish it in a book), with an acknowledgment of its initial
publication in this series.
3. Authors are permitted and encouraged to post their work online (e.g., in institutional repositories or on their website) prior to and
during the submission process, as it can lead to productive exchanges, as well as earlier and greater citation of published work (See
Open access policy for details).
References
[1]. Chi-Wei Su, Ke Dai, Sana Ullah & Zubaria Andlib (2022) COVID-19 pandemic and unemployment dynamics in European economies, Economic Research-Ekonomska Istraživanja, 35:1, 1752-1764, DOI: 10.1080/1331677X.2021.1912627
[2]. Rakesh Kochhar, JUNE 11, 2020, Unemployment rose higher in three months of COVID-19 than it did in two years of the Great Recession, https://pewrsr.ch/2UADTTZ
[3]. Ayşegül Şahin, Murat Tascı, and Jın Yan*, Number 2020-09 May 7, 2020, The Unemployment Cost of COVID-19: How High and How Long, Economic Commentary DOI: 10.26509/frbc-ec-202009
[4]. Courtney L. McNamara1, Martin McKee2, David Stuckler, 2021, Precarious employment and health in the context of COVID-19: a rapid scoping umbrella review, European Journal of Public Health, Vol. 31, Supplement 4, iv40–iv49
[5]. Meghan R. Owens, Francilia Brito-Silva, Tracie Kirkland, Carolyn E. Moore, Kathleen E. Davis, Mindy A. Patterson, Derek C. Miketinas and Wesley J. Tucker,28 July 2020; Prevalence and Social Determinants of Food Insecurity among College Students during the COVID-19 Pandemic, Nutrients 2020, 12, 2515; doi:10.3390/nu12092515
[6]. Gerald E. Daniels Jr., Ph.D. a, and Matthew H. Morton, D.Phil, January 11, 2022, COVID-19 Recession: Young Adult Food Insecurity, Racial Disparities, and Correlates, Journal of Adolescent Health xxx (2022) 1e9
[7]. Carol Bruce, Maeve E. GearingI, Jill DeMatteis, Kerry Levin, Timothy Mulcahy, Jocelyn Newsome, Jonathan Wivagg, May 12, 2021, Financial vulnerability and the impact of COVID-19 on American households, https://doi.org/10.1371/journal.pone.0262301
[8]. Institute for Women's Policy Research (2020), Women lost more jobs than men in almost all sectors of the economy, https://iwpr.org/wp-content/uploads/2020/07/QF-Jobs-Day-April-FINAL.pdf
[9]. Kate Bahn, Jennifer Cohen, Yana van der Meulen Rodgers, First published: 07 May 2020, A feminist perspective on COVID-19 and the value of care work globally, https://doi.org/10.1111/gwao.12459
[10]. Amber N. W. Raile, Elizabeth A. Shanahan, Eric D. Raile, David C. W. Parker, Pavielle Haines, Accepted: 11 November 2020, Women and the weight of a pandemic: A survey of four Western US states early in the Coronavirus outbreak, Gender Work Organ. 2021;28(S2):554–565.
[11]. Fast Company,03-20-20, https://www.fastcompany.com/90479204/why-women-will-be-hardest-hit-by-a-coronavirus-driven-recession
[12]. CATALYST WORKPLACES THAT WORK FOR WOMEN, Aug 29, 2022, Women in the Workforce: United States (Quick Take), https://www.catalyst.org/research/women-in-the-workforce-united-states/
[13]. Okechukwu D. Anyamele, Saundra M. McFarland, Kenneth Fiakofi, 2020, The Disparities on Loss of Employment Income by US Households During the COVID‐19 Pandemic, Journal of Economics, Race, and Policy (2022) 5:115–133, https://doi.org/10.1007/s41996-021-00086-1
[14]. Kenneth A. Couch a, 5 August 2020, Robert W. Fairlie b,c,d, Huanan Xu, Early evidence of the impacts of COVID-19 on minority unemployment, Journal of Public Economics 192 (2020) 104287
[15]. Hai-Anh H.Dangab Cuong Viet Nguyencd, 2020, Gender inequality during the COVID-19 pandemic: Income, expenditure, savings, and job loss, J16J21O12, https://www.sciencedirect.com/science/article/pii/S0305750X2030423X?casa_token=YJdGIMAWlUcAAAAA:dNYfikohMI9XJ20OlG1B6hxgrkj5ceWVSlPvG2Elw2f19dLjTegZ7oJz3-tHi3tdJUMVSWd52LGg
[16]. World Health Organization, World Health Statistics 2022, ISBN: 9789240051157; 9789240051140 (electronic version),https://www.who.int/data/gho/publications/world-health statistics
[17]. CDC, poverty rate, https://www.cdc.gov/nchs/hus/sources-definitions/poverty.htm
[18]. Alexander W. Bartik, Marianne Bertrand, Zoe Cullen, and Christopher Stanton, July 10, 2020, The impact of COVID-19 on small business outcomes and expectations, 117 (30) 17656-17666,https://www.pnas.org/doi/10.1073/pnas.2006991117
[19]. Lauren Bauer, Kristen Broady, Wendy Edelberg, and Jimmy O’Donnell, ECONOMIC FACTS | SEPTEMBER 2020, Ten Facts about COVID-19 and the U.S. Economy
[20]. Dimitris Papanikolaou, Lawrence D W Schmidt,15 November 2021, Working Remotely and the Supply-Side Impact of COVID-19,https://academic.oup.com/raps/article-abstract/12/1/53/6428551?login=false
[21]. .Robert W. Fairlie, Ph.D. Economic Consulting Santa Cruz, CA 95060, August 16, 2022, The Impacts of COVID-19 on Racial Disparities in Small Business Earnings, 73351021R0008, https://cdn.advocacy.sba.gov/wp-content/uploads/2022/08/16104005/Report_COVID-and-Racial-Disparities_508c.pdf
[22]. Ayşegül Şahin, Murat Tascı, and Jın Yan*, Number 2020-09 May 7, 2020, The Unemployment Cost of COVID-19: How High and How Long? , Economic Commentary DOI: 10.26509/frbc-ec-202009
[23]. Alexander W. Bartik, Marianne Bertrand, Feng Lin, Jesse Rothstein & Matt Unrath, July 2020, Measuring the labor market at the onset of the COVID-19 crisis, DOI 10.3386/w27613
[24]. THE INVESTOPEDIA TEAM, Updated September 03, 2022, What Is the CARES Act? , Government & Policy , https://www.investopedia.com/coronavirus-aid-relief-and-economic-security-cares-act-4800707
[25]. Julia Raifman, Jacob Bor, and Atheendar Venkataramani, July 2020, Unemployment insurance and food insecurity among people who lost employment in the wake of COVID-19, medRxiv preprint doi: https://doi.org/10.1101/2020.07.28.20163618.t
[26]. Peter Ganong, Pascal Noel, Joseph Vavra, 13 May 2020, US unemployment insurance replacement rates during the pandemic, Journal of Public Economics 191 (2020) 104273
[27]. Shikha Garg et al., March 1–30, 2020, Morbidity and Mortality Weekly Report, Hospitalization Rates and Characteristics of Patients Hospitalized with Laboratory-Confirmed Coronavirus Disease 2019 — COVID-NET, 14 States, MMWR / April 17, 2020 / Vol. 69 / No.