


1. Introduction
In the field of portfolio optimization, the Markowitz mean-variance model has been widely recognized and utilized for constructing optimal investment portfolios since the famous work Portfolio Selection published in 1955. H. Markowitz [1] illustrated the typical econometric method which has been applied to the investing field. The model takes into account the trade-off between expected return and risk by considering the mean (expected return) and variance (risk) of asset returns.
This study aims to investigate the utilization of the constrained Markowitz mean-variance model in portfolio optimization. The study intends to explore how the incorporation of different constraints in the traditional Markowitz model affects the portfolio optimization process. By considering these constraints and analyzing their implications, the purpose is to provide insights into the effective utilization of the constrained Markowitz mean-variance model, thus enhancing the practical relevance and applicability of portfolio optimization techniques.
To accomplish the research objectives, this study will adopt a quantitative research approach. The research will involve data collection and analysis, taking into account historical asset returns, risk measures, and relevant constraint parameters. Mathematical techniques, such as quadratic programming, will be employed to solve the optimization problem and identify the optimal portfolio allocations under different constraints. The analysis will consider various scenarios by varying the weights assigned to different constraints, enabling a comprehensive understanding of the trade-offs involved in constrained portfolio optimization.
This paper is organized as follows. Section 2 provides a comprehensive literature review of existing studies on portfolio optimization under constraints, highlighting the contributions and limitations of prior research in this field. Section 3 presents the theoretical foundation of the Markowitz mean-variance model, explaining its key assumptions and mathematical formulation. At the same time. the methodology employed in this study is introduced, including the data collection process, the selection of constraints, and the optimization techniques utilized. Section 4 presents the empirical results and discusses the implications of incorporating constraints in the Markowitz mean-variance model. Finally, Section 5 concludes the paper by summarizing the findings, discussing their implications, and suggesting avenues for future research.
2. Literature review
However, in real-world investment scenarios, there are often various constraints that need to be considered, such as budget restrictions, bounding constraints, and cardinality constraints. The incorporation of constraints in the Markowitz mean-variance model enhances its applicability and relevance in practical portfolio management. By optimizing the Markowitz mean-variance model under these constraints, the investors can achieve an optimal portfolio allocation that strikes a balance between risk and return, while meeting the specific requirements and limitations imposed by the real-world constraints.
To solve this problem, many researchers have contributed themselves to this research. In 2008, Hamed Soleimani and Hamid Reza Golmakani [2] proposed a new portfolio selection model including three constraints, using the method of mixed-integer nonlinear programming (NP-Hard) and a corresponding genetic algorithm (GA).
Then, in 2012, Guang-Feng Deng, Woo-Tsong Lin and Chih-Chung Lo [3] presented particle swarm optimization (PSO), a collaborative population-based meta-heuristic algorithm for solving the Cardinality Constraints Markowitz Portfolio Optimization problem (CCMPO problem). C Czichowsky and M Schweizer [4] also studied the Markowitz problem in continuous time in a general semimartingale model and under cone constraints with stochastic control methods.
Later, Xun Li and Zuo Quan Xu [5] proposed a semi-analytical expression for the precommitted efficient mean-variance policy without the viscosity solution technique (2016). martingale's theory is used during the process and is developed to solve the continuous-time Markowitz’s model with bankruptcy prohibition and convex cone portfolio constraints.
Three years later,in 2019, Otken, Celen N., Organ, Z. Batuhan and Yildirim, E. Ceren[6] found a portfolio that maximizes the risk-adjusted returns subject to constraints frequently faced during portfolio management(three additional constraints: upper and lower limits on the cardinality, active share, and tracking error.). The research finds that the method generates solutions satisfying nearly all of the constraints within reasonable computational time (under an hour), at the expense of a 13% reduction in the annual return of the portfolio.
Recently, a generalized Markowitz model, which is a convex kurtosis minimization under mean and variance constraints, has been proposed by Hu, Shenglong and Wang, Qun[7] in 2022. A numerical method with an alternating minimization framework is used to solve the problem with linear and quadratic constraints. In the same year, Deliktas, Derya and Ustun, Ozden[8] presented an integrated approach including the fuzzy MULTIMOORA based on(CCSD) method and the mean-variance-ranking cardinality constrained portfolio optimization (MVRCCPO) for solving the cardinality constrained portfolio optimization.
3. Methodology
The Markowitz Optimization technique, also known as Modern Portfolio Theory (MPT), is an investment portfolio optimization method developed by Harry Markowitz in the 1950s. It is a mathematical approach that seeks to find the optimal allocation of investment assets in a portfolio based on their expected returns, risks (typically measured by variances or standard deviations), and the correlation between their returns.
The main goal of Markowitz Optimization is to achieve the highest possible return for a given level of risk or to minimize the risk for a given level of return. It aims to find the "efficient frontier," which represents the set of optimal portfolios that offer the highest expected returns at each level of risk or the lowest risk at each level of expected return.
This study aims to optimize a stock portfolio model using the Markowitz Optimization technique. The methodology employed can be divided into the following steps.
3.1. Data Collection
The stock data of four representative real estate developers called Poly Development Holding Group Co., Ltd. Greenland Holdings Corporation Limited, CCCG Real Estate Corporation Limited and China Vanke Co., Ltd. (which are abbreviated to BL, LD, ZJ, and WK respectively in this paper) in the past three years were selected as the analysis object. All stock data is from the RISE database, and all four stocks are listed on the China Shenzhen Stock Exchange and Shanghai Stock Exchange, and the data source is reliable and true. These data reflect the daily closing prices of the four real estate companies from January 4, 2021, to June 28, 2023, having strong research value. The sample data is as follows:
Table 1: Stock sample data
Close price | WK | BL | ZJ | LD |
2021-01-04 | 27.78 | 15.29 | 6.61 | 5.72 |
2021-01-05 | 27.91 | 15.1 | 6.55 | 5.72 |
…… | …… | …… | …… | …… |
2023-6-27 | 14.22 | 13.43 | 14.36 | 2.74 |
2023-6-28 | 14.01 | 13.4 | 14.35 | 2.75 |
3.2. Calculation of Returns
Daily returns were computed using the Shift Returns method. For each stock, the returns were calculated as the ratio between the current price and the price shifted by a specified number of days (shift), minus one.
3.3. Calculation of Mean and Variance
To estimate the expected returns and risk of the stocks, the Exponential Weighted Moving Average (EWMA) method was utilized. It computes the mean and variance of the returns over a defined length, with more recent data weighted more heavily.
3.4. Calculation of Covariance
The covariance between stock pairs was calculated using the EWMA-based covariance formula. This involved iterating through each pair of stocks and computing their covariance using the specified filter length.
3.5. Markowitz Optimization
A Markowitz Optimization was designed to determine the optimal allocation of weights for the stocks in the portfolio. At each date, the mean returns, variance-covariance matrix, fixed interest rate, and minimum desired return were provided as inputs to the MarkowitzOpt function. The function then returned the optimal allocation of weights for the stocks.
3.6. Portfolio Performance Evaluation
The distribution data frame was used to record the weight allocation for each stock at different dates. The total portfolio value and daily returns were calculated using the obtained weight allocation and the corresponding stock prices. The portfolio performance metrics, such as cumulative returns and risk-adjusted returns, were analyzed based on the calculated values. After that, the income on both the interest and the portfolio are calculated and compared.
Finally, the results are visualized to obtain different charts. By following this methodology, the study optimized the stock portfolio using the Markowitz Optimization technique. The use of historical stock data, return calculations, estimation of mean and variance, covariance computation, and implementation of the MarkowitzOpt function allowed for the determination of the optimal stock weight allocation. The resulting portfolio performance was evaluated based on various performance metrics, aiding in investment decision-making.
4. Result
In this study, the stock data of four relatively typical Chinese real estate listed companies were selected as a sample for analysis, specifically the daily composite data from January 4, 2021, to June 28, 2023. At the beginning of the experiment, set the annual interest rate at 2.65% (Since in this experiment the next day's earnings are predicted based on the closing price of 20 days, the interest rate in the program is calculated at a monthly interest rate of 2.65%/12), maintain a minimum rate of return of 2%, and choose 20 days as the number of days of the cycle.
In the code, min_return is used as a constraint to ensure that the expected return of an optimized portfolio does not fall below this threshold. In the experiment, different values can be assigned to different investment groups, and the annual return of 2% is relatively objective and true. At the same time, the shift is set to 20, which means that the price information for the last 20 days will be taken into account when calculating the yield. Choosing the right shift value depends on the understanding and assumptions of market volatility and portfolio returns. Longer shift values smooth the data and provide longer-term trends The following results are obtained by performing calculations through the already designed program.
According to the observations depicted in Figure 1, it is apparent that WK exhibited the highest share price among the four stocks until April 2022. From January 4, 2021, WK's share price gradually declined from 27.78 yuan per share, reaching approximately 20 yuan per share by April 2022. Subsequently, the price stabilized and remained at 20 yuan per share until June 28, 2023. In contrast, BL experienced a slight increase in share price from January 4, 2021, starting at an initial value of $15.29 per share and reaching around $20 per share in April 2022. Since then, the value has been fluctuating around this level.
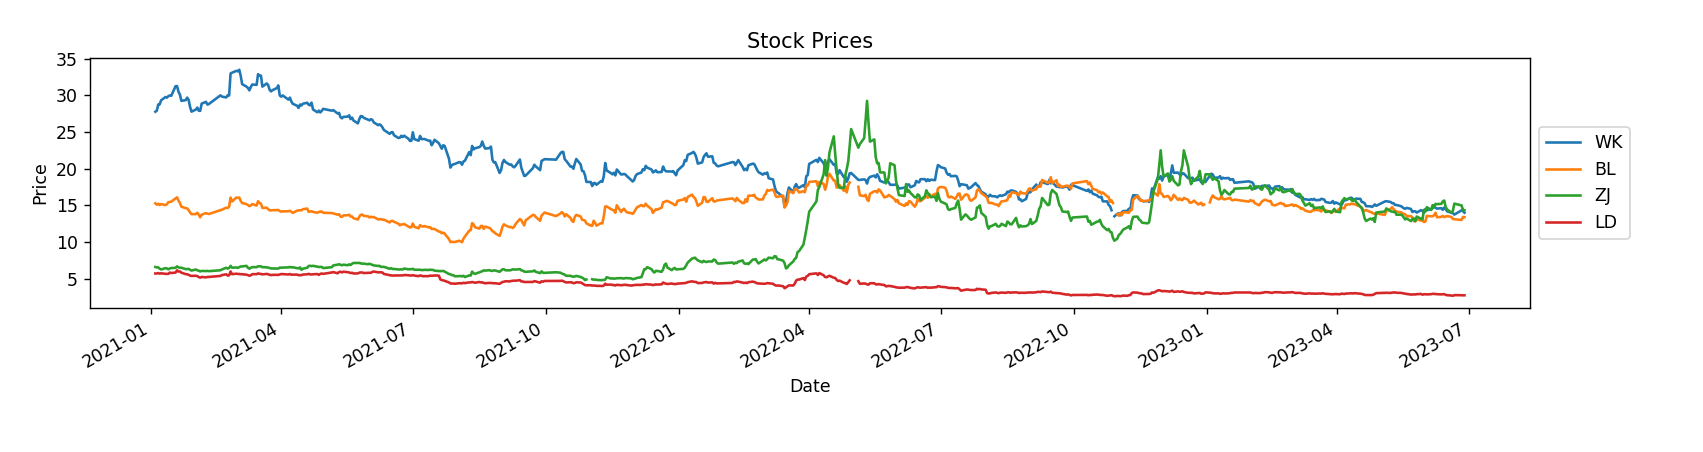
Figure 1: Stock price chart from January 4, 2021 to June 28, 2023
Throughout the period from 2021 to April 2022, ZJ and LD maintained stable share prices at $6.5 per share and $5.7 per share, respectively. Nevertheless, ZJ's share price witnessed a significant surge after April 2022, reaching a peak of nearly $30 per share. Following the peak, it underwent a subsequent downtrend before stabilizing within the range of $20 per share to $15 per share. It is worth noting that LD's share price displayed minimal changes from January 4, 2021, to June 28, 2023, persistently remaining below $5 per share, the lowest among the four stocks.
Based on the findings presented in Figure 2, it is evident that ZJ exhibited substantial growth in forecasted returns over a 20-day cycle between March 2022 and May 2022. During this period, the annual returns were projected to exceed 2.5%. Additionally, there was a brief spike in returns of approximately 1% between November and December 2022. However, for the remaining periods, all four stocks yielded returns below the desired level, consistently hovering around 0%.
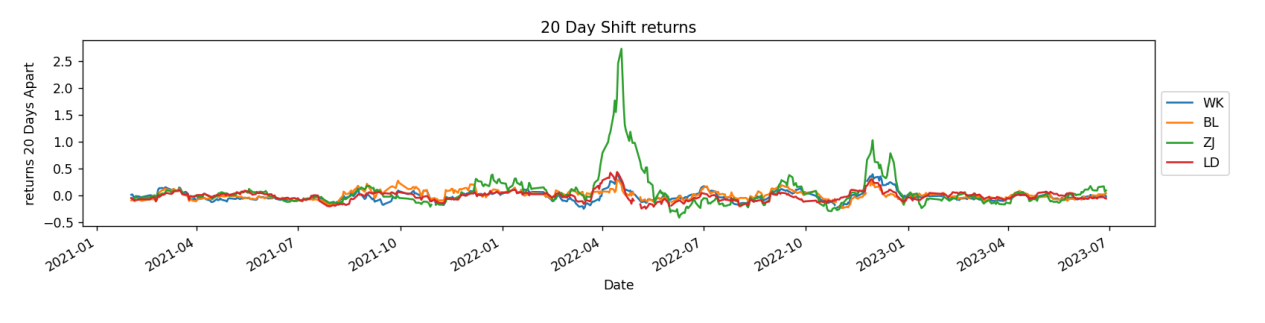
Figure 2: Shifted returns of every 20 days
The trends depicted in Figure 3 illustrate the predicted portfolio returns over time. It is noteworthy that the value of portfolio returns experienced rapid growth, surging from 1.0 in January 2022 to around 1.075 in April 2022, reaching the peak of expected returns. Subsequently, the figure declined steeply, reaching a low of 0.90 in February 2023, and has since remained fluctuating around this trough.
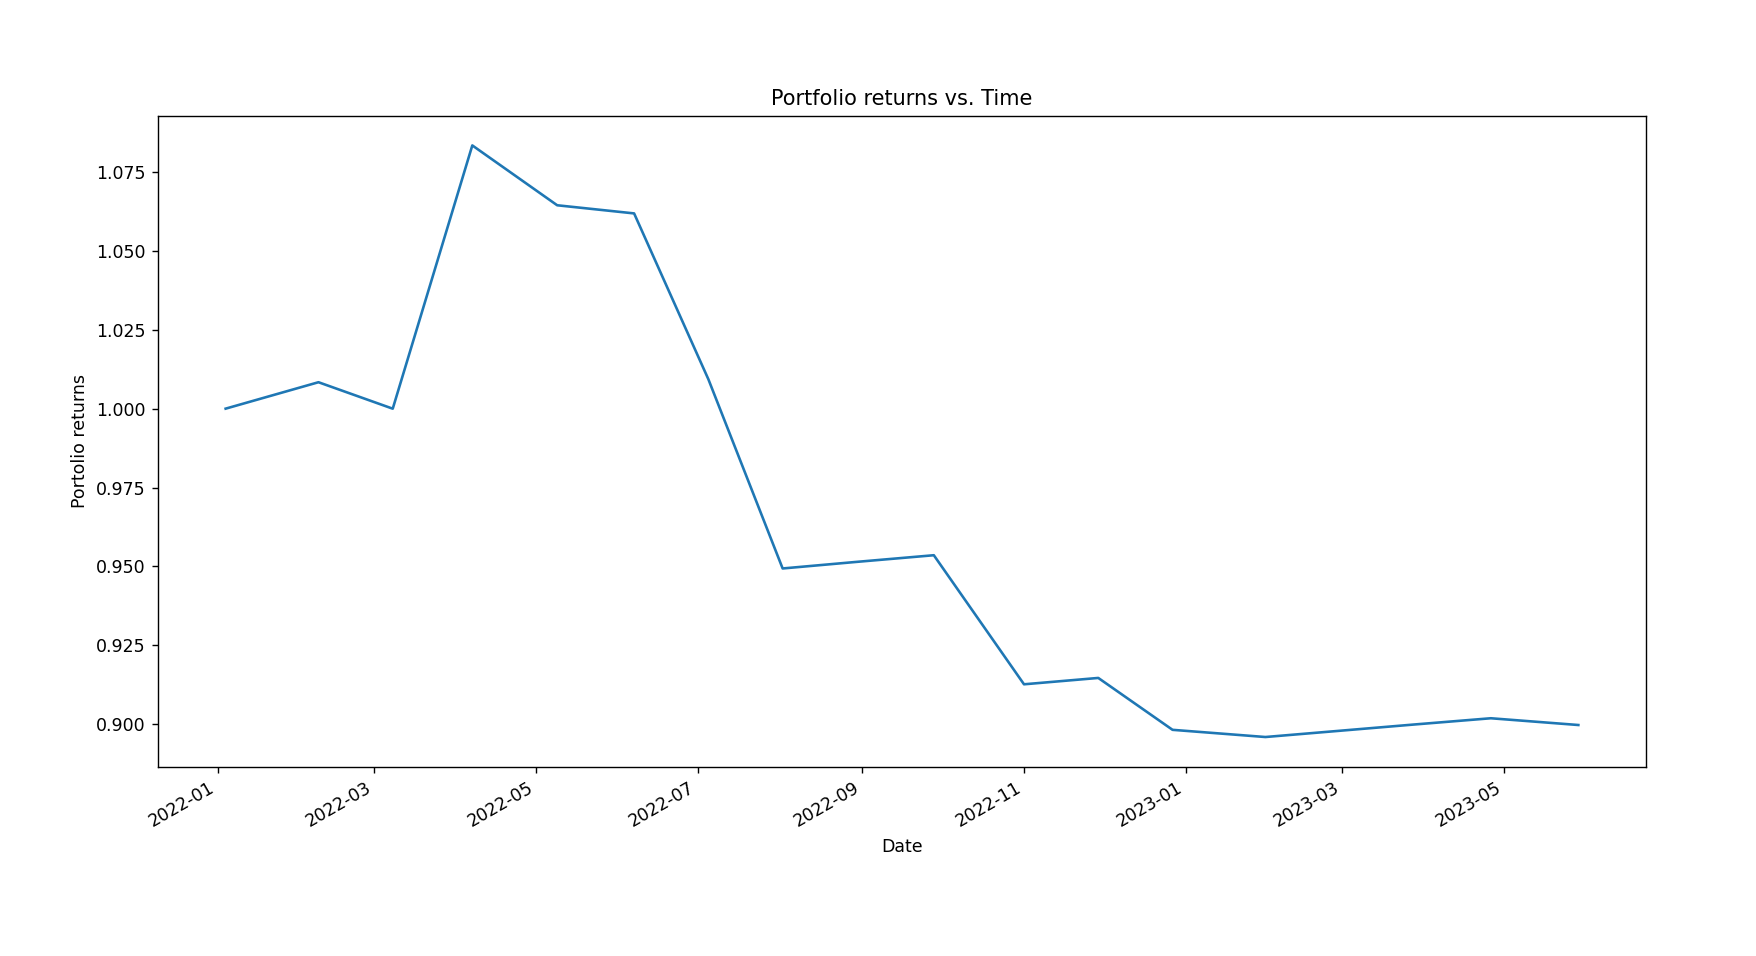
Figure 3: the predicted portfolio returns over time
According to the Figures 4, we find that the existence of the stocks has little impact on portfolio composition. The portfolios were essentially the same in both cases, with investments of 1.7%, BL 18.3% and ZJ 3.2% on September 28, 2022, LD 20% and WK 5.3% on November 29, 2022, and ZJ 3.7% on December 27, 2022, respectively. The remaining funds will be either idle or invested in risk-free markets.
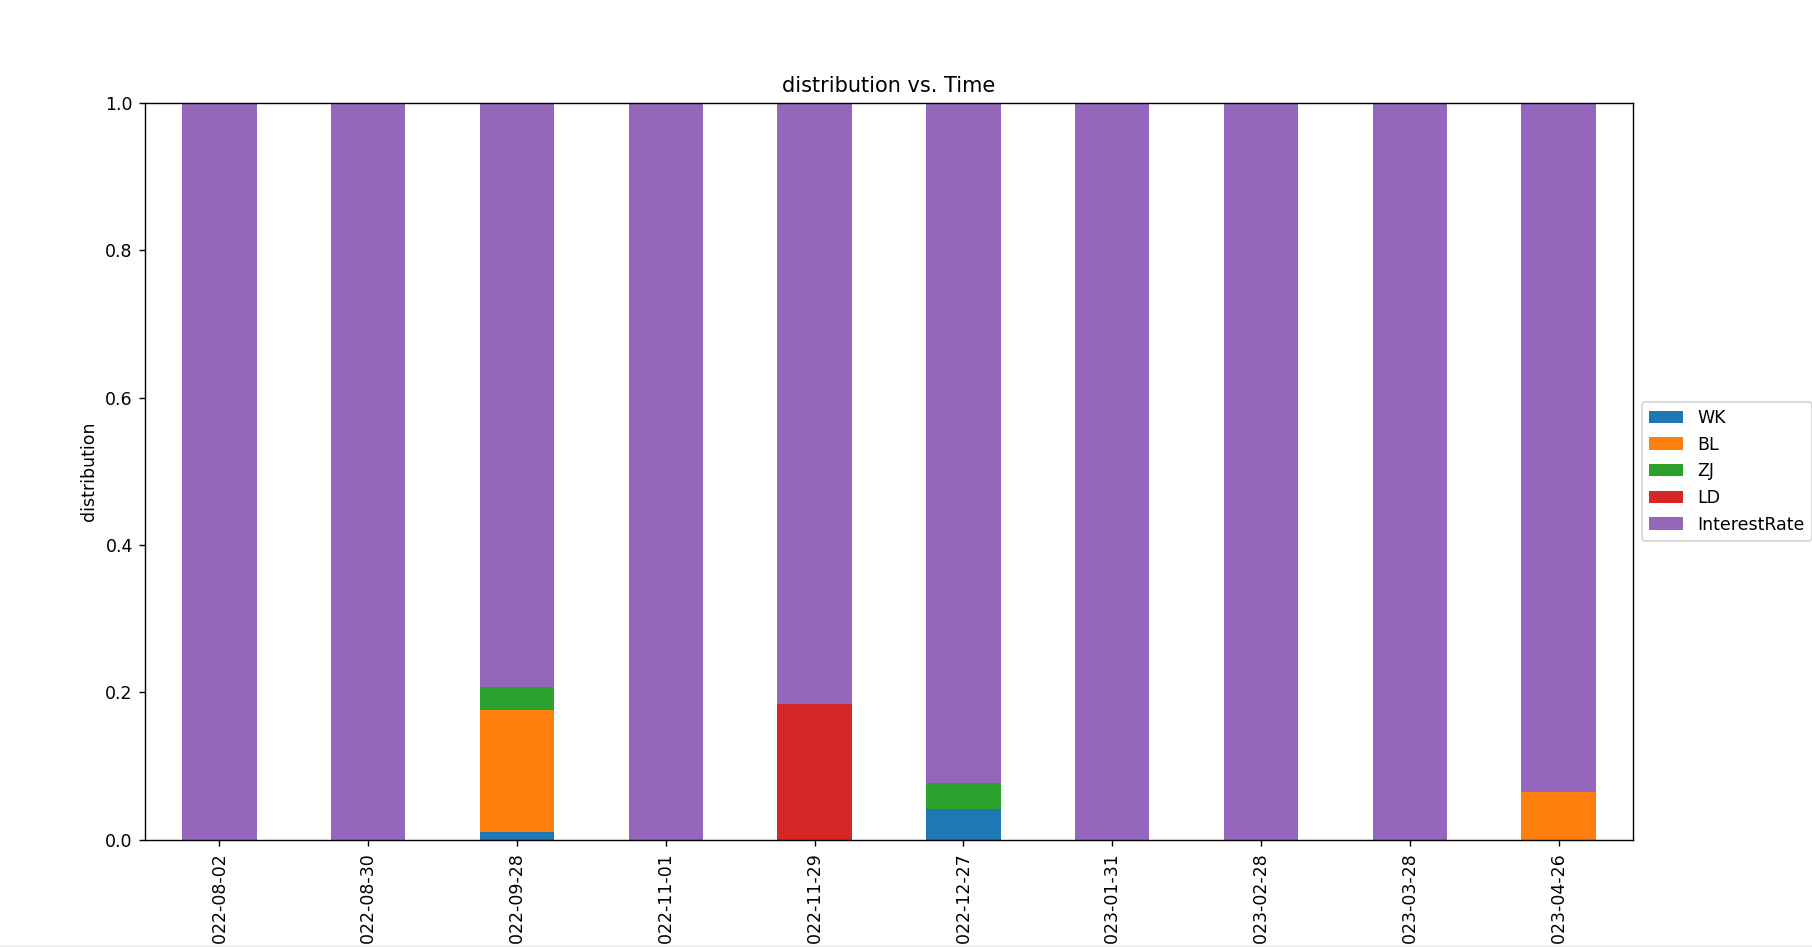
Figure 4: The proportion of various stocks in the investment considering risk-free investing over time
Based on our analysis, the observed phenomena can be attributed to the sluggishness of the real estate market in recent years. This has led to high investment costs and meager returns, with some instances even yielding better outcomes compared to not investing at all. Consequently, the presence or absence of risk-free market investments does not appear to significantly influence the overall investment strategy. Considering these circumstances, the most prudent course of action at this juncture would be to promptly exit the market to mitigate the risk of incurring larger losses.
The post-pandemic environment, economic conditions, and declining consumer sentiment have collectively contributed to the challenges faced by the real estate sector. Reduced demand, weakened economic conditions, and cautious consumer behavior have led to financial strain on real estate companies, resulting in defaults. Consequently, investors are advised to exercise caution when considering investments in the Chinese real estate market due to the uncertainties and potential risks associated with the current situation. It is important to stay updated with the latest market information and conduct thorough research before making any investment decisions.
5. Conclusion
In conclusion, this study aimed to investigate the application of the constrained Markowitz mean-variance model in portfolio optimization. Specifically, we explored how the inclusion of constraints within the conventional Markowitz model influences the optimization process of portfolio construction. Stock data from four listed real estate companies were used as research subjects. Mathematical techniques were then employed to solve optimization problems and determine the optimal portfolio allocations. At the same time, we also designed the corresponding program for experimental verification. By considering these constraints and analyzing their impacts, the purpose was to provide insights into effectively utilizing the constrained Markowitz mean-variance model and enhancing the practical relevance and applicability of portfolio optimization techniques.
In summary, this study explores the application of the constrained Markowitz mean-variance model in portfolio optimization. The findings offer valuable insights into the impact of various constraints on the optimization process and highlight effective ways of utilizing this model. The research emphasizes the practical relevance and applicability of constrained portfolio optimization techniques, guiding for investors to construct balanced portfolios that consider both risk and expected returns.
References
[1]. Markowitz, H. M. . (1952). Portfolio selection. The Journal of Finance, 7(1), 77.
[2]. Soleimani, H. , Golmakani, H. R. , & Salimi, M. H. . (2009). Markowitz-based portfolio selection with minimum transaction lots, cardinality constraints and regarding sector capitalization using genetic algorithm. Expert Systems with Applications, 36(3p1), 5058-5063.
[3]. Deng, G. F. , Lin, W. T. , & Lo, C. C. . (2012). Markowitz-based portfolio selection with cardinality constraints using improved particle swarm optimization. Expert Systems with Applications, 39(4), 4558-4566.
[4]. Czichowsky, C. , & Schweizer, M. . (2012). Cone-constrained continuous-time markowitz problems. The Annals of Applied Probability, 23(2), 764-810.
[5]. Li, X. , & Xu, Z. Q. . (2016). Continuous-time markowitz's model with constraints on wealth and portfolio. Operations Research Letters, 44(6), 729-736.
[6]. Economist, T. E. . (2019). An extension to the classical mean–variance portfolio optimization model. The Engineering Economist, 64(3), 310-321.
[7]. Hu, S. , & Wang, Q. . (2022). A globally convergent method for solving a quartic generalized markowitz portfolio problem. Applied Numerical Mathematics: Transactions of IMACS, 179.
[8]. Delikta, D. , & Ustun, O. . (2022). Multi-objective genetic algorithm based on the fuzzy multimoora method for solving the cardinality constrained portfolio optimization. Applied Intelligence, 1-27.
Cite this article
Xu,J. (2024). Exploring the Application of Quadratic Programming Within the Markowitz Economic Model: An Empirical Analysis of the Chinese Real Estate Market. Advances in Economics, Management and Political Sciences,70,31-37.
Data availability
The datasets used and/or analyzed during the current study will be available from the authors upon reasonable request.
Disclaimer/Publisher's Note
The statements, opinions and data contained in all publications are solely those of the individual author(s) and contributor(s) and not of EWA Publishing and/or the editor(s). EWA Publishing and/or the editor(s) disclaim responsibility for any injury to people or property resulting from any ideas, methods, instructions or products referred to in the content.
About volume
Volume title: Proceedings of the 2nd International Conference on Financial Technology and Business Analysis
© 2024 by the author(s). Licensee EWA Publishing, Oxford, UK. This article is an open access article distributed under the terms and
conditions of the Creative Commons Attribution (CC BY) license. Authors who
publish this series agree to the following terms:
1. Authors retain copyright and grant the series right of first publication with the work simultaneously licensed under a Creative Commons
Attribution License that allows others to share the work with an acknowledgment of the work's authorship and initial publication in this
series.
2. Authors are able to enter into separate, additional contractual arrangements for the non-exclusive distribution of the series's published
version of the work (e.g., post it to an institutional repository or publish it in a book), with an acknowledgment of its initial
publication in this series.
3. Authors are permitted and encouraged to post their work online (e.g., in institutional repositories or on their website) prior to and
during the submission process, as it can lead to productive exchanges, as well as earlier and greater citation of published work (See
Open access policy for details).
References
[1]. Markowitz, H. M. . (1952). Portfolio selection. The Journal of Finance, 7(1), 77.
[2]. Soleimani, H. , Golmakani, H. R. , & Salimi, M. H. . (2009). Markowitz-based portfolio selection with minimum transaction lots, cardinality constraints and regarding sector capitalization using genetic algorithm. Expert Systems with Applications, 36(3p1), 5058-5063.
[3]. Deng, G. F. , Lin, W. T. , & Lo, C. C. . (2012). Markowitz-based portfolio selection with cardinality constraints using improved particle swarm optimization. Expert Systems with Applications, 39(4), 4558-4566.
[4]. Czichowsky, C. , & Schweizer, M. . (2012). Cone-constrained continuous-time markowitz problems. The Annals of Applied Probability, 23(2), 764-810.
[5]. Li, X. , & Xu, Z. Q. . (2016). Continuous-time markowitz's model with constraints on wealth and portfolio. Operations Research Letters, 44(6), 729-736.
[6]. Economist, T. E. . (2019). An extension to the classical mean–variance portfolio optimization model. The Engineering Economist, 64(3), 310-321.
[7]. Hu, S. , & Wang, Q. . (2022). A globally convergent method for solving a quartic generalized markowitz portfolio problem. Applied Numerical Mathematics: Transactions of IMACS, 179.
[8]. Delikta, D. , & Ustun, O. . (2022). Multi-objective genetic algorithm based on the fuzzy multimoora method for solving the cardinality constrained portfolio optimization. Applied Intelligence, 1-27.