


1. Introduction
The analysis on customers is of great significance to the mastery of the market situation. With the rapid development of information technology in this modern era, for large enterprises, there is significant reference in the different purchasing needs of customers at different times. The purchasing behaviour collected during several years, including order amount, purchasing times, etc., has certain reference in the whole analysis[1]. The model of purchase behaviour summarized from it has a good reference for the subsequent adjustment of production in response to market changes.
The application of PCA in database processing and analysis has been widely used in most fields. The objects analyzed involved in this paper is a group of customer consumption records collected in a period of years, including order number, order content, order amount and customer origin. Many studies are related to the PCA on the market. Take the research on the development of private economy as an example[2]. The developing environment of private enterprises is analyzed from multiple dimensions (including market demand, industrial policy, human resources, etc.). Similar studies are started from various industries and provide a very meaningful reference for the research process of this paper[3].
However, it should be noted that the analysis object of this paper is the customer group of one purchase, so the classification of customers is also very important. Research on customer classification is mostly based on cluster analysis and k-means algorithm, relating studies concluded the model of customer-purchasing during the analysis of data.[4][5] We can see that, ACO is used in most situation of optimizing the model.[6] While this paper focuses on the consumption factors of a single purchase customer group.
2. Data and Method
2.1. Data
2.1.1. The object of study
This data is from F. Daniel (September 2017). The raw data is processed and analyzed by multiple people, and former analysis will be performed in this article.
The original database comes from the data of 4000 customers from December 01, 2010 to December 09, 2011, aiming to analyze the specific market purchase characteristics. There are eight types of relevant factors in this database.
In the original database, the InvoiceNo of part of the data has a serial number beginning with C, which means that this part of the order has been canceled. Among the Number of products, the customer recorded as 1 indicates that he only came to make one purchase. In addition, it is worth noting that some customers purchased a large number of products at one time with many repeated purchases. (such as CustomerID 12347). This analysis will focus on this kind of special customer group, analyzing the differences between one-time purchasing customers and multiple purchasing customers, and briefly finds out the underlying influencing factors.
2.1.2. Data cleaning and classification
The original data analysis separately analyzed the above eight types of influencing factors, but it should be noted that there were some data errors, such as the loss of customerID, Description, etc., so additional operations were carried out on this type of data.
Because the data without CustomerID is not invalid data, which still has the specific order number and other information, and this type of customer may be the first time to purchase customers with no ID information to be left. Instead of discarding this data directly, the data without CustomerID is specially marked and filtered.
For some orders without Description, the corresponding order amount is 0 in these orders. Because it is unavailable to confirm whether there is data loss in the process of data collection, this part of the order is cleared in order not to affect the subsequent analysis.
2.1.3. Analysis of canceled orders
Canceled orders are started with the order number of C. For the convenience of subsequent analysis, the canceled orders are sorted out to be analyzed.
It can be seen that the cancellation of orders still accounts for a large proportion of all orders, with a proportion of nearly 16%. In the analysis of canceled orders, it can be seen that the records of canceled orders under the same number have significant characteristics. Take the two orders in Table 1 as an example:
Table 1: Canceled orders
C581484 | 23843 | PAPER CRAFT LITTLE BIRDIE | 2012/9/11 9:27 | 2.08 | 16446 |
581483 | 23843 | PAPER CRAFT LITTLE BIRDIE | 2012/9/11 9:15 | 2.08 | 16446 |
The two orders were the same in Description, UnitPrice and country, placed only a few minutes apart, and were conducted by the same person, but the status of the quantity data for the cancelled order was negative. So it can be guessed that maybe the reason for the cancellation has something to do with description, unitprice, and customerID. To test this conjecture, we query for pairs of positive and negative corresponding quantity values and close order numbers in the order. However, the screening results found that some orders named DISCOUNT did not meet such circumstances. It can be possible that the order status of DISCOUNT affects the data entry, so we choose to remove this part of order.
However, after the removal of this part of order, there are still some orders that cannot be consistent with the previous hypothesis. So the cancellation of the order may not be related to factors such as quantity. In order to facilitate the analysis of a subsequent purchase customer, this part of order is cleared.
2.2. Method
The data analysis method used in this paper is principal component analysis.[7] The main idea of PCA is to map N-dimensional features to K-dimensional features. The work of PCA is to find a set of mutually orthogonal coordinate axes sequentially from the original space, and the choice of new coordinate axes is closely related to the data itself.[8] PCA is a technology used to simplify the database in the area of statistics. It is a linear transformation which transforms the data into a new coordinate system such that the first variance of any data projection is on the first coordinate (called the first principal component), the second variance is on the second coordinate (the second principal component), and so on. PCA can reduce the dimensionality of a database while maintaining the features that contribute the most to the variance of the database. This is done by keeping the lower principal components and ignoring the higher principal components. The lower one often preserves the most important aspects of the data. In fact, this is equivalent to retaining only the dimensional features that contain most of the variance, while ignoring the feature dimensions that contain almost zero variance, so as to achieve dimensionality reduction processing of data features.
The result of PCA can be shown in the table of KMO, Bartlett and some other forms. The KMO and Bartlett table often show the relation of the features between the object, which can be reflected in the number. Some other tables also reflect how huge it may be for the single feature relating to the object.
3. Results
3.1. The results of KMO and Bartlett
In this paper, KMO sample measure and Bartlett sphere test are used to test the correlation degree of each variable in the sample data. Noted that because the variables included in this database are string variables, description, country, InvoiceDate, and InvoiceNo cannot be counted for primary component analysis. In this paper, only quantity, invoicedate, and unitprice are considered in the principal component analysis. The analysis of strings such as description will be presented later.
The results of three factors are shown in table 2:
Table 2: KMO and Bartlett | ||
Kaiser-Meyer-Olkin Measure of Sampling Adequacy. | .499 | |
Bartlett's Test of Sphericity | Approx. Chi-Square | 16.468 |
df | 3 | |
Sig. | <.001 | |
The KMO value is only 0.499. Considering the variability of the date in the variable, the InvoiceDate variable is excluded, and the KMO quantity value is obtained as shown in table 3:
Table 3: New KMO and Bartlett | ||
Kaiser-Meyer-Olkin Measure of Sampling Adequacy. | .500 | |
Bartlett's Test of Sphericity | Approx. Chi-Square | .062 |
df | 1 | |
Sig. | .803 | |
The KMO magnitude is 5, which has a certain correlation.
3.2. The result of variance contribution
For the variance contribution rate of the remaining two variables, the following results can be obtained as table 4:
Table 4: Total Variance Explained | ||||||
Component | Initial Eigenvalues | Extraction Sums of Squared Loadings | ||||
Total | % of Variance | Cumulative % | Total | % of Variance | Cumulative % | |
1 | 1.001 | 50.034 | 50.034 | 1.001 | 50.034 | 50.034 |
2 | .999 | 49.966 | 100.000 | |||
Extraction Method: Principal Component Analysis. | ||||||
It can be seen that the corresponding variance contribution rates of the two principal components are 50.034% and 49.966% respectively, and the impact contribution rates of the two principal components on the data are relatively large, and the results are reasonable to a certain extent. As shown in the table 5, the extraction degree of common factors of the two principal components is 0.5, so the extraction degree of common factors of the two principal components is better.
Table 5: Communalities
Initial | Extraction | |
UnitPrice | 1.000 | .500 |
Quantity | 1.000 | .500 |
Extraction Method: Principal Component Analysis. | ||
3.3. Component load analysis
Table 6: Component Matrixa | |
Component | |
1 | |
UnitPrice | .707 |
Quantity | -.707 |
a. 1 components extracted. | |
It can be seen that unitprice has a major impact on the customers who make one purchase (table 6).
3.4. The analysis on the result of PCA
From the above principal component analysis, it can be concluded that among the one-purchasing customers, the most influential factor is the UnitPrice part. Based on the conclusions drawn, the orientation of UnitPrice is particularly important for the subsequent development of the product.
For marketing, customer retention plays a very important role.[9] How to transform the customers who buy for the first time and consume for a single time into multiple or even long-term ‘regular customers’ is a very important means of long-term development. As a factor affecting customer loyalty and enterprise benefit, switching cost has become a focus issue. Conversion costs include not only economic costs, but also time, emotion, risk and other factors. The database analyzed in this paper only includes price-related factors, but does not take customer preferences into account, so there are still shortcomings in data collection.
According to Liu Chen's research results, the analytical conversion cost based on this paper has eight components: economic risk cost, evaluation cost, learning cost, organizational adjustment cost, benefit loss cost, money loss cost, personal relationship loss cost, and brand relationship loss cost. However, due to the lack of data, a comprehensive analysis may be a little impossible to made.
4. Discussion
4.1. Discussion on the PCA results
According to the results of principal component analysis only, it can be seen that UnitPrice does affect the choice of most customers for single and multiple purchases. The reason why customers do not renew orders after a single purchase may be due to the unreasonable price, which means customers can’t afford the price of goods.
In addition, the needs for large orders and brand considerations should also be taken into account. If the customer only needs a single purchase for emergency, it is reasonable that there are no multiple purchases. In this case, the adaptability of products can be improved to meet the long-term needs of customers and stabilize the purchase intention of customers.
The appeal of a brand to customers can be reflected by the heterogeneity and complexity of its products.[9] Since there are no more details about the product in the database, this article can only make general suggestions to enhance the distinguishing features of the product from other products of the same type. Customers tend to compare similar products when choosing purchase objects, and strong differences will increase the time for customers to change purchase objects, thus reducing conversion costs. In order to stabilize customers, the increased heterogeneity of products can make it more difficult for customers to choose other brands of products.
The complexity of the product can provide customers with more uses under the same product, thus avoiding customers from choosing other products to meet additional needs.
4.2. Other factors
In the principal component analysis, some variables are difficult to be incorporated into the analysis process, including country, description, etc. Now the country part is selected separately to reflect in figure 1:
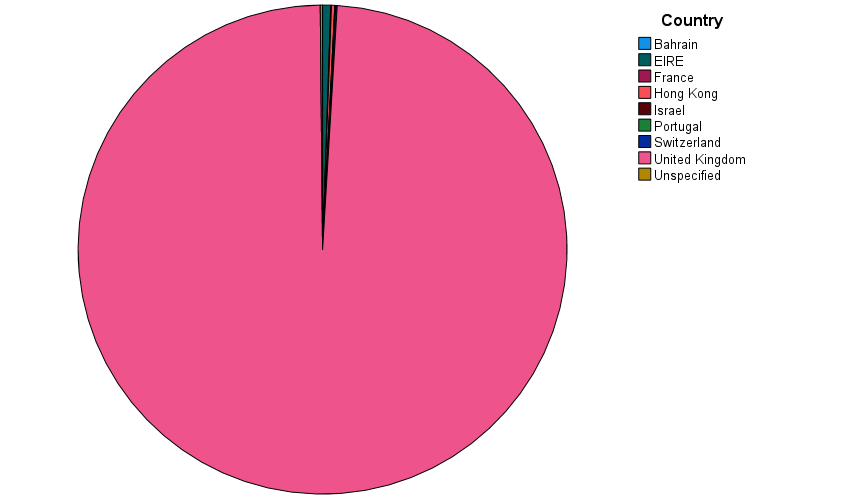
Figure 1: Country distribution
As can be seen from figure 1, most of the customers who purchase one time are from the UK. For the sake of product circulation and popularity, it is suggested to develop business in other countries and regions, so as to attract more first-time customers and increase the probability of stabilizing customer sources.
5. Conclusion
In this paper, PCA is used to analyzing the influencing factors in the customer group of onepurchaser [10]. Due to the data defects of the database itself, only a limited part of the conclusions on the factors affecting customer stability can be obtained, that is, to enhance the heterogeneity and complexity of products and re-evaluate the rationality of pricing. There are still some short-comings in the processing and analysis of the data, and further analysis and verification are still needed. For the parts that cannot be included in the principal component analysis, they are listed separately for brief analysis, and further operations are needed to convert them into variables that can be analyzed and included in the measurement range.
References
[1]. Qianxuan Liu Market impact strategy analysis considering customer value (Times of Future, 2021,(11),134-135)
[2]. Jianbin Chen Research on the Evaluation of the Development Environment of Private Economy Based on PCA(China: Nanchang Social Sciences Academy,Nanchang Jiangxi 330039)
[3]. Tingting Tian Application of PCA in Financial Analysis of GEM listed enterprises (Oriental Enterprise Culture, 2011(20))
[4]. Qiuyi Zhai Research on Customer Classification of Private Education Customers in China Based on Cluster Analysis (Mathematics in Practice and Theory,2022,52(02))
[5]. Ting Zhang Application of ant colony clustering optimization algorithm in retail customer classification (Journal of Guiyang University (Natural Sciences),2021,16(02))
[6]. Siyu Yao Improved Ant Colony Clustering Algorithm in Customer Classification Research and Application (Dalian Maritime University)
[7]. Yi Qin Research on the Influencing Factors of Researchers’ Cooperation in Virtual Academic Communities Based on Principal Component Analysis: Case Study of ‘MuChong’ BBS (Information Research, 2020(05))
[8]. Zhihao Zhuo Innovation Capability Evaluation of High-tech Enterprises in Guangxi Based on PCA (Sci-Tech & Development of Enterprise, 2021(01))
[9]. Chen Liu Research on the Influencing Factors of Customer Switching Cost in Online Shopping (Economic & Trade, 2015(08))
[10]. Haiping Shen Comprehensive Evaluation of Small and Medium-sized listed Companies based on Interval PCA (Journal of Fujian Institute of Financial, 2011(02))
Cite this article
Li,Z. (2024). Research on Influencing Factors of Customer Purchasing Behavior Based on PCA . Advances in Economics, Management and Political Sciences,70,45-51.
Data availability
The datasets used and/or analyzed during the current study will be available from the authors upon reasonable request.
Disclaimer/Publisher's Note
The statements, opinions and data contained in all publications are solely those of the individual author(s) and contributor(s) and not of EWA Publishing and/or the editor(s). EWA Publishing and/or the editor(s) disclaim responsibility for any injury to people or property resulting from any ideas, methods, instructions or products referred to in the content.
About volume
Volume title: Proceedings of the 2nd International Conference on Financial Technology and Business Analysis
© 2024 by the author(s). Licensee EWA Publishing, Oxford, UK. This article is an open access article distributed under the terms and
conditions of the Creative Commons Attribution (CC BY) license. Authors who
publish this series agree to the following terms:
1. Authors retain copyright and grant the series right of first publication with the work simultaneously licensed under a Creative Commons
Attribution License that allows others to share the work with an acknowledgment of the work's authorship and initial publication in this
series.
2. Authors are able to enter into separate, additional contractual arrangements for the non-exclusive distribution of the series's published
version of the work (e.g., post it to an institutional repository or publish it in a book), with an acknowledgment of its initial
publication in this series.
3. Authors are permitted and encouraged to post their work online (e.g., in institutional repositories or on their website) prior to and
during the submission process, as it can lead to productive exchanges, as well as earlier and greater citation of published work (See
Open access policy for details).
References
[1]. Qianxuan Liu Market impact strategy analysis considering customer value (Times of Future, 2021,(11),134-135)
[2]. Jianbin Chen Research on the Evaluation of the Development Environment of Private Economy Based on PCA(China: Nanchang Social Sciences Academy,Nanchang Jiangxi 330039)
[3]. Tingting Tian Application of PCA in Financial Analysis of GEM listed enterprises (Oriental Enterprise Culture, 2011(20))
[4]. Qiuyi Zhai Research on Customer Classification of Private Education Customers in China Based on Cluster Analysis (Mathematics in Practice and Theory,2022,52(02))
[5]. Ting Zhang Application of ant colony clustering optimization algorithm in retail customer classification (Journal of Guiyang University (Natural Sciences),2021,16(02))
[6]. Siyu Yao Improved Ant Colony Clustering Algorithm in Customer Classification Research and Application (Dalian Maritime University)
[7]. Yi Qin Research on the Influencing Factors of Researchers’ Cooperation in Virtual Academic Communities Based on Principal Component Analysis: Case Study of ‘MuChong’ BBS (Information Research, 2020(05))
[8]. Zhihao Zhuo Innovation Capability Evaluation of High-tech Enterprises in Guangxi Based on PCA (Sci-Tech & Development of Enterprise, 2021(01))
[9]. Chen Liu Research on the Influencing Factors of Customer Switching Cost in Online Shopping (Economic & Trade, 2015(08))
[10]. Haiping Shen Comprehensive Evaluation of Small and Medium-sized listed Companies based on Interval PCA (Journal of Fujian Institute of Financial, 2011(02))