


1. Introduction
The field of asset management revolves around the efficient allocation of resources to achieve the optimal risk-return trade-off. The Capital Asset Pricing Model (CAPM) is a fundamental tool that assists asset managers in understanding and quantifying this trade-off. Developed by William Sharpe, John Lintner, and Jan Mossin, the CAPM gives bits of knowledge into the connection between the gamble of a resource and its normal return inside an enhanced portfolio [1]. This article delves into the application of the CAPM in asset management, examining its theoretical underpinnings, its relevance, and its practical implications.
2. Theoretical Foundations of CAPM
The CAPM is based on several key assumptions: (1) investors are rational and risk-averse, (2) there exists a risk-free rate, (3) investors hold well-diversified portfolios, (4) all investors have access to the same information, and (5) markets are efficient. These assumptions facilitate the derivation of the CAPM equation [2]:
\( E(Ri)=Rf+βi×(E(Rm)-Rf) \) (1)
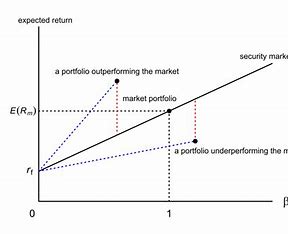 Figure1: Definition[3]
Where: E(Ri) is the expected return of asset i. Rf is the risk-free rate. βi is the systematic risk (beta) of asset i. E(Rm) is the expected return of the market.
3. Practical Application in Asset Management
3.1. Portfolio Construction
The CAPM aids asset managers in constructing efficient portfolios by guiding the allocation of assets based on their expected returns and risk levels. The concept of the efficient frontier, which represents the optimal combination of assets to maximize returns for a given level of risk, is a cornerstone of modern portfolio theory. The CAPM provides a methodology to determine the optimal portfolio mix by considering the risk-free rate, the expected market return, and the systematic risk of individual assets.
Consider an asset manager aiming to construct a portfolio with a target level of risk. By utilizing the CAPM's formula, the manager can calculate the expected return required to meet that risk level, incorporating the risk-free rate and the market risk premium. This enables the asset manager to determine the optimal mix of assets that maximizes return for the given risk tolerance. For instance, if the manager has a client seeking moderate risk exposure, the CAPM aids in selecting assets with suitable betas to create a diversified portfolio that aligns with the client's risk-return preferences [4].
Example: Asset A has an expected return of 10% and a beta of 1.2. Asset B has an expected return of 8% and a beta of 0.9. Asset C has an expected return of 12% and a beta of 1.5. The risk-free rate is 4%, and the market risk premium is 6%. Using the CAPM, the asset manager can calculate the expected return required to meet the client's desired risk level. Let's say the client is comfortable with a portfolio beta of 1.0. The CAPM formula allows the asset manager to calculate the expected return:
\( E(Ri)=Rf+βi×(E(Rm)-Rf) \) (1)
Hence. A=0.04+1.2×(0.06) =0.04+0.072=0.112E(RA)=0.04+1.2×(0.06)=0.04+0.072=0.112 or 11.2%. B=0.04+0.9×(0.06) =0.04+0.054=0.094E(RB)=0.04+0.9×(0.06)=0.04+0.054=0.094 or 9.4%. C=0.04+1.5×(0.06) =0.04+0.09=0.13E(RC)=0.04+1.5×(0.06)=0.04+0.09=0.13 or 13%.
In this example, the asset manager can select a combination of assets to create a portfolio with a beta of approximately 1.0, meeting the client's risk tolerance. They might allocate more to Asset B, which has a lower beta, and less to Asset C, which has a higher beta, to achieve the desired risk-return profile.
This demonstrates how the CAPM guides asset managers in selecting assets and determining their allocation to build portfolios that align with clients' risk preferences and financial goals. Additionally, the CAPM can be used to periodically rebalance portfolios to ensure they continue to meet the desired risk-return targets as market conditions change.
3.2. Risk Assessment
In the domain of corporate finance, the CAPM remains the preferred method in practice for assessing investments with risk [5]. Asset managers employ the CAPM to assess and quantify the systematic risk of assets within their portfolios. Beta, a measure of an asset's sensitivity to market movements, is a crucial tool in evaluating risk. Assets with higher betas are expected to experience larger fluctuations in returns in response to market changes, thus helping asset managers understand the potential risks associated with each asset.
Due to risk aversion, a rational investment valuation system should assign a higher value to projects that contribute more to the aggregate risk, i.e., those with a larger income elasticity of net benefits. In theory, this is achieved by modifying discount rates to align with consumption betas [6]. Imagine an asset manager responsible for managing a portfolio of technology stocks. Among the stocks in the portfolio, two prominent holdings are (1). Stock X with a beta of 1.3. (2). Stock Y with a beta of 0.8
Stock X has a beta of 1.3, which means it's expected to be 30% more volatile than
the overall market. If the market experiences a 10% increase, Stock X is expected to rise by 13%.
Stock Y, with a beta of 0.8, is expected to be 20% less volatile than the market. If the market increases by 10%, Stock Y is expected to rise by 8%.
Now, suppose the asset manager expects the overall market to have an annual return of 12%, and the risk-free rate is 3%.
Using the CAPM, the asset manager can assess the systematic risk of these stocks by comparing their expected returns to their beta values. The formula is:
E(Ri)=Rf+βi×(E(Rm)−Rf)(1)
For X=0.03+1.3×(0.12−0.03)=0.03+0.117=0.147E(RX)=0.03+1.3×(0.12−0.03)
=0.03+0.117=0.147 or 14.7%.
ForY=0.03+0.8×(0.12−0.03)=0.03+0.072=0.102E(RY)=0.03+0.8×(0.12−0.03)
=0.03+0.072=0.102 or 10.2%.
The asset manager can now assess the risk of these stocks relative to their expected returns. Stock X is expected to provide a higher return (14.7%) but with more risk due to its higher beta. Stock Y offers a lower expected return (10.2%) but with lower risk due to its lower beta.
This risk assessment helps the asset manager make informed decisions about how much of each stock to hold in the portfolio based on the client's risk tolerance and investment goals. If the client is risk-averse, the manager might recommend a larger allocation to Stock Y to reduce overall portfolio risk.
In this way, the CAPM provides a quantitative framework for evaluating the risk-return trade-offs of individual assets within a portfolio, aiding asset managers in optimizing risk-adjusted returns.
3.3. Performance Evaluation
The CAPM serves as a benchmark for evaluating the performance of both individual assets and entire portfolios [7]. The model enables asset managers to compare an asset's actual return to its expected return, given its systematic risk. This comparison helps identify overperforming or underperforming assets, providing insights into the effectiveness of investment decisions.
Suppose an asset manager constructed a portfolio consisting of several stocks over the last year. To evaluate the performance of this portfolio, the manager decides to use the CAPM as a benchmark.
The portfolio's average beta, calculated as a weighted average of the betas of the individual stocks, is 1.2.
The risk-free rate (Rf) is 3%.
The expected return of the overall market (Rm) is 10%.
The CAPM formula is as follows:
\( E(Ri)=Rf+βi×(E(Rm)-Rf) \) (1)
For the portfolio=0.03+1.2×(0.10−0.03)=0.03+0.084=0.114
E(Portfolio)=0.03+1.2×(0.10−0.03)=0.03+0.084=0.114 or 11.4%.
Now, let's say the actual return of the portfolio over the past year was 12%. The manager can compare this actual return (12%) to the expected return as per the CAPM (11.4%).
If the actual return exceeds the CAPM-based expected return, it suggests that the portfolio has outperformed given its level of systematic risk. Conversely, if the actual return is less than the CAPM-based expected return, it indicates underperformance relative to the expected return based on systematic risk.
In this case, with an actual return of 12% exceeding the CAPM-based expected return of 11.4%, the asset manager can conclude that the portfolio has performed well about its systematic risk. This information is valuable for both assessing the manager's performance and communicating the portfolio's performance to clients.
Furthermore, the CAPM can be used to evaluate the performance of individual assets within the portfolio. If an asset within the portfolio consistently underperforms its expected return as per the CAPM, it may warrant closer scrutiny or potential replacement.
Overall, the CAPM serves as a valuable tool for performance evaluation by providing a systematic and risk-adjusted benchmark against which asset managers can measure the returns generated by portfolios and individual assets.
4. Limitations and Criticisms
While the CAPM is an incredible asset, it has confronted reactions and limits. One huge study is the supposition of a direct connection between a resource's beta and its normal return [8]. Empirical evidence suggests that the actual relationship may be more complex, particularly in markets with small-cap stocks or during periods of economic turmoil. Additionally, the reliance on historical data for beta estimation may lead to inaccurate risk assessments in rapidly changing environments.
An illustration of the CAPM's limitations can be found in the context of a market crash. During an economic crisis, asset correlations may deviate from historical averages challenging the assumption of constant beta. For instance, if certain asset classes suddenly become highly correlated due to systemic shocks [9], the CAPM might underestimate the portfolio's risk. This illustrates the challenge of using historical data to estimate future risk in volatile market conditions, as emphasized by Black Swan events like the 2008 financial crisis.
In the context of market mechanisms and policies, the relative risk aversion coefficient model is a commonly applied mechanism. However, it still falls short of effectively guiding rational decisions, primarily due to its reliance on the expansion of capital investment behavior and its limited support for the proper functioning of the CAPM [10].
5. Empirical Evidence and Practical Implications
Numerous empirical studies have examined the application of the CAPM in asset management. While some studies have confirmed the model's usefulness in guiding investment decisions and portfolio construction, others have highlighted its limitations in capturing the complexities of real-world markets [11]. Asset managers must exercise caution and supplement CAPM-based analysis with other tools, such as factor models or alternative risk measures, to ensure more robust decision-making.
Consider a study analyzing the performance of small-cap stocks during economic downturns. Researchers find that the relationship between beta and expected return is less reliable for small-cap stocks compared to large-cap stocks, indicating that the CAPM's assumptions might not hold uniformly across different market segments. This empirical evidence highlights the need for asset managers to incorporate additional factors or alternative models when making investment decisions in specific market contexts.
6. Future Directions
The CAPM remains a valuable framework in the field of asset management, offering insights into risk and return relationships. As the financial landscape evolves, asset managers should adapt their approaches to accommodate the limitations and assumptions of the CAPM. Future research may focus on refining the model by incorporating factors that capture additional sources of risk or developing alternative approaches to estimate systematic risk. Despite its limitations, the CAPM continues to serve as a guiding principle in the pursuit of optimal asset management strategies.
Looking ahead, researchers might explore augmenting the CAPM with factors beyond beta to capture nuances in asset pricing. For example, the Fama-French Three-Factor Model incorporates market, size, and value factors to better explain asset returns. This evolution reflects the field's acknowledgment of the CAPM's limitations and the ongoing effort to refine asset pricing models. In conclusion, the CAPM remains a vital tool in asset management, guiding decisions even as researchers strive to enhance its applicability.
7. Conclusion
The Capital Resource Valuing Model (CAPM) has fundamentally influenced the field of resource executives by giving an organized system for grasping the connection between hazards and return. While the model's suspicions and restrictions should be recognized, its reasonable applications in portfolio development, risk appraisal, and execution assessment can't be put into words. As the field of money keeps on developing, the CAPM remains an important device that guides resource chiefs in pursuing educated and compelling speculation choices. By incorporating the experiences from the CAPM with other contemporary procedures, resource directors can explore the intricacies of the cutting-edge monetary scene and keep on accomplishing their clients' monetary targets.
References
[1]. Prombutr, W., Lockwood, L., & Sabherwal, S. (2020). The Q-theory Model: Evidence from the U.S. Market and non-U.S. Markets[J]. Quarterly Journal of Finance and Accounting, 58(4), 1–34.https://www.jstor.org/stable/27159071.
[2]. KaiXun, L.(2022). Capital Asset Pricing Model (CAPM)[J]. Research on the applicability of the Chinese stock market. 2022.04.029.
[3]. Jennie Bai;Turan G. Bali;Quan Wen; (2021). Is there a risk-return tradeoff in the corporate bond market? Time-series and cross-sectional evidence[J]. Journal of Financial Economics.
[4]. Han S Z. An Empirical Study On Consumption-Based Capital Asset Pricing Model: Evidence From The Chinese Stock Market [J]. International Economic Cooperation,2019(01):145-158.
[5]. Abada, I., De Maere D’Aertrycke, G., Ehrenmann, A., & Smeers, Y. (2019). What Models Tell Us About Long-Term Contracts[J]. Times Of The Energy Transition. Economics Of Energy & Environmental Policy, 8(1), 163–182.
[6]. Li Kaixuan. Applicability of Capital Asset Pricing Model (CAPM) in the Chinese stock market [J]. Bohai Sea Economic Outlook, 2022, (4): 157-160. The DOI: 10.16457 / j.carol carroll nki HBHJJLW. 2022.04.029
[7]. Locke, R. R. (2019). Economics And The Shop Floor[J]. Reflections Of An Octogenarian. Management Revue, 30(4), 371–388. Https://Www.Jstor.Org/Stable/26996559
[8]. Li J Y. Empirical analysis on the effectiveness of multi-factor asset pricing model in Chinese stock market [D]. Huaibei normal university, 2022.
[9]. Brincks, S., Haddad, K. M., Lotfaliei, B., & Trombley, T. E. (2020). A Synthesis Of Capital Budgeting Techniques Around The World[J]. Quarterly Journal Of Finance And Accounting, 58(4), 105–130.Https://Www.Jstor.Org/Stable/27159073.
[10]. Liu, X., & Li, W. (2019). Investor’s Selective Deviation On High Equity Premium: An Empirical Study Of The Listed Companies In Bohai Coast Region [J]. Journal Of Coastal Research, 992–996.
[11]. Hu Zhihao; Li Xiaohua. Research on Capital asset pricing Model under different capital cost: Based on Chinese bond market [J]. Journal of University of Chinese Academy of Social Sciences, 2019,43(09):64-82+138-139+141.
Cite this article
Zhao,X. (2024). The Application of the Capital Asset Pricing Model (CAPM) in the Field of Asset Management. Advances in Economics, Management and Political Sciences,71,144-149.
Data availability
The datasets used and/or analyzed during the current study will be available from the authors upon reasonable request.
Disclaimer/Publisher's Note
The statements, opinions and data contained in all publications are solely those of the individual author(s) and contributor(s) and not of EWA Publishing and/or the editor(s). EWA Publishing and/or the editor(s) disclaim responsibility for any injury to people or property resulting from any ideas, methods, instructions or products referred to in the content.
About volume
Volume title: Proceedings of the 3rd International Conference on Business and Policy Studies
© 2024 by the author(s). Licensee EWA Publishing, Oxford, UK. This article is an open access article distributed under the terms and
conditions of the Creative Commons Attribution (CC BY) license. Authors who
publish this series agree to the following terms:
1. Authors retain copyright and grant the series right of first publication with the work simultaneously licensed under a Creative Commons
Attribution License that allows others to share the work with an acknowledgment of the work's authorship and initial publication in this
series.
2. Authors are able to enter into separate, additional contractual arrangements for the non-exclusive distribution of the series's published
version of the work (e.g., post it to an institutional repository or publish it in a book), with an acknowledgment of its initial
publication in this series.
3. Authors are permitted and encouraged to post their work online (e.g., in institutional repositories or on their website) prior to and
during the submission process, as it can lead to productive exchanges, as well as earlier and greater citation of published work (See
Open access policy for details).
References
[1]. Prombutr, W., Lockwood, L., & Sabherwal, S. (2020). The Q-theory Model: Evidence from the U.S. Market and non-U.S. Markets[J]. Quarterly Journal of Finance and Accounting, 58(4), 1–34.https://www.jstor.org/stable/27159071.
[2]. KaiXun, L.(2022). Capital Asset Pricing Model (CAPM)[J]. Research on the applicability of the Chinese stock market. 2022.04.029.
[3]. Jennie Bai;Turan G. Bali;Quan Wen; (2021). Is there a risk-return tradeoff in the corporate bond market? Time-series and cross-sectional evidence[J]. Journal of Financial Economics.
[4]. Han S Z. An Empirical Study On Consumption-Based Capital Asset Pricing Model: Evidence From The Chinese Stock Market [J]. International Economic Cooperation,2019(01):145-158.
[5]. Abada, I., De Maere D’Aertrycke, G., Ehrenmann, A., & Smeers, Y. (2019). What Models Tell Us About Long-Term Contracts[J]. Times Of The Energy Transition. Economics Of Energy & Environmental Policy, 8(1), 163–182.
[6]. Li Kaixuan. Applicability of Capital Asset Pricing Model (CAPM) in the Chinese stock market [J]. Bohai Sea Economic Outlook, 2022, (4): 157-160. The DOI: 10.16457 / j.carol carroll nki HBHJJLW. 2022.04.029
[7]. Locke, R. R. (2019). Economics And The Shop Floor[J]. Reflections Of An Octogenarian. Management Revue, 30(4), 371–388. Https://Www.Jstor.Org/Stable/26996559
[8]. Li J Y. Empirical analysis on the effectiveness of multi-factor asset pricing model in Chinese stock market [D]. Huaibei normal university, 2022.
[9]. Brincks, S., Haddad, K. M., Lotfaliei, B., & Trombley, T. E. (2020). A Synthesis Of Capital Budgeting Techniques Around The World[J]. Quarterly Journal Of Finance And Accounting, 58(4), 105–130.Https://Www.Jstor.Org/Stable/27159073.
[10]. Liu, X., & Li, W. (2019). Investor’s Selective Deviation On High Equity Premium: An Empirical Study Of The Listed Companies In Bohai Coast Region [J]. Journal Of Coastal Research, 992–996.
[11]. Hu Zhihao; Li Xiaohua. Research on Capital asset pricing Model under different capital cost: Based on Chinese bond market [J]. Journal of University of Chinese Academy of Social Sciences, 2019,43(09):64-82+138-139+141.