


1. Introduction
As a new form of digital communication that integrates entertainment, interaction, and consumption, live streaming has rapidly changed the media consumption pattern of audiences. TikTok live streaming has attracted the attention of a large number of audiences around the world based on its short video ecosystem and real-time interactive features. Live-streaming platforms provide space for content dissemination and in-depth interaction between audiences, streamers, and brands. Compared with traditional e-commerce, the core advantage of live streaming is its real-time interactivity. Audiences interact with streamers in real time and get timely feedback through comments, likes, etc., significantly increasing audience engagement, user stickiness, and consumer purchase intention. Although audience interaction is considered a key factor in the success of live streaming, the existing research mainly focuses on the overall performance of live streaming e-commerce, and there still needs to be more in-depth discussion on the mechanism of how specific interaction behaviors drive traffic and sales. In addition, communication theory still deserves further refinement in explaining the impact of audience interaction on consumer behavior. This study takes the TikTok live-streaming platform as the object, combined with the social presence theory of communication, and explores the impact of audience interaction from theoretical and empirical levels. The study aims to explore the key factors that drive TikTok live streaming traffic and sales conversion in audience engagement and the underlying mechanism of the impact of user interaction behavior based on social presence theory. By exploring these issues, this study provides theoretical and empirical support for optimizing live-streaming platforms, adjusting interaction mechanisms, and brand marketing.
2. Social presence theory and audience engagement
Social presence theory emphasizes the sense of "presence" and "presence of others" experienced by the audience in the process of media interaction [1], providing an essential perspective for understanding audience interaction. Through real-time interactions, live streaming enables the audience to become active participants in content dissemination, and real-time interaction enhances the sense of social presence and willingness to participate. The effect of real-time interaction on audience behavior has been extensively explored in existing research, and audience interaction is a key factor driving traffic and sales. Research has shown that live-streaming features significantly increase consumers' overall perceived value and purchase intention while reducing consumers' overall perceived uncertainty [2]. Social interaction, including interactivity, presence, and social status display, positively influences audiences' intention to continue watching and their purchase behavior across various live-streaming formats such as events, education, and personal sharing [3]. Additionally, social cues, including social presence and synchronous interaction, have been found to influence authentic consumer viewing experiences and behavioral intentions, such as searching, subscribing, and purchasing[4].The role of audience perceptions in personal branding during interactions on short video platforms has also been explored, with perceived warmth being more influential in fostering emotional interaction, while perceived competence has a greater impact on cognitive and behavioral interactions [5]. Interactive responses from streamers have been shown to increase consumer trust, which, in turn, leads to higher purchase conversion rates [6]. Personalized interactions contribute to a sense of belonging among audiences, and this loyalty is beneficial to both streamers and platforms [7, 8]. Furthermore, studies have found that consumers place high value on real-time interaction with creators, underscoring the importance of the live aspect of live-streaming [9]. Based on the above research, this study takes the TikTok live-streaming platform as the object and analyzes the specific impact of audience interaction behavior on traffic and sales through data analysis and theoretical elaboration.
3. Data and Methodology
3.1. Datasets
This study explored the impact of audience interaction in live streaming on traffic and sales based on two datasets from the TikTok platform, covering key metrics to measure interaction, traffic, and sales (Table 1). The first dataset includes 13,884 observations covering live streams between March 27, 2021, and September 23, 2021, recording sales, interaction metrics, and descriptive metrics for live streams. The second dataset (1048,576 real-time observations) is specific data at different timestamps during different live streams on the above 13884 real-time observations, covering behavior metrics (enter_number and leave_number), descriptive metrics, and date-time. The study categorized live-streaming accounts and product categories to analyze the impact of different variables on traffic and sales. Based on "brand" and "lifetitle," live-streaming accounts are divided into four categories: well-known brand accounts, ordinary brand accounts, celebrity accounts, and personal accounts [10]. In addition, the study categorized live-streaming based on product categories, including beauty, electronics, fashion (shoes, clothes, and bags), food, jewelry, household goods, study supplies, and "other" product types. The "other" category refers to live-streaming, where a streamer sells two or more product categories simultaneously.
Table 1: Key variables and description.
Metric | Variable | Description |
Descriptive metrics | Brand | Streamer or store name |
Life_title | The theme, featured products, or promotion of live streams | |
Start_time | The start time of the live-streaming | |
Duration(s) | The duration of the live-streaming, in seconds | |
Date-time | different timestamps during live-streaming | |
Interaction metrics | Word_of_mouth | The scope of the share or discussion of live streams |
Bullet_screen_count | The number of "bullet comments" by viewers | |
Share_count | The number of shares per live-streaming | |
Like_count | Indicating audience interaction and support | |
Average_online_count | The average number of viewers present at given time | |
Average_stay_time | The average length of time a viewer spends | |
Average_stay_index | Shows the average length of stay of the audience | |
Gift_count | Virtual gifts received reflects the audience's support and love for the streamer | |
Views | the total number of views per live-streaming, which is the core metric for evaluating live-streaming reach | |
Peaknumber | The highest number of people who watched at the same time at a time | |
New_fans | The number of new followers acquired during live streams | |
New_fans_group | The number of followers who joined a specific fan group | |
Behavior metrics | Enter_number | The total number of viewers who entered the room during the live-streaming |
Leave_number | The total number of viewers who left the room | |
Account Type | Well-known brand accounts | Have a wide audience coverage through multi-channel promotion |
Ordinary brand accounts | Have a single promotion channel and limited influence | |
Celebrity accounts | Run by public figures who have accumulated popularity in the traditional media field | |
Personal accounts | Operated by streamers or personal brands that have accumulated followers through the internet |
3.2. Data preprocessing
The median filling method was used for the first dataset to fill in the missing values. The median has a solid ability to resist outliers and maintain the robustness of data distribution. For the second dataset, due to the time-series nature of the dataset, the study resampled the observations for each live stream at 10-minute intervals based on the variable "date-time." During the resampling process, the study used the linear interpolation method to fill in the missing values in the time series to ensure a smooth data transition and preserve the overall trend. On this basis, the study calculated the key interaction metric net_flow (net _flow = enter_number - leave_number) and the duration of each live stream. In order to further reveal the temporal distribution of traffic peaks, the maximum net flow and its position (max_net_flow_quartile) of each live stream were statistically evaluated using quartile analysis. The study normalized the time variable "start_time" into the hour (0-23) at the start of live streaming and calculated the average of sales and traffic grouped by hour to reveal the fluctuation of sales and traffic throughout the day. Categorical variables, such as brand, account type, and product category, are converted into numerical data through LabelEncoder to ensure the model can handle categorical variables.
3.3. Model selection and construction
The datasets are divided into a training set (80%) and a test set (20%) to ensure the reliability of model training and the independence of performance evaluation. In order to understand the effects of different indicators on the dependent variables sales and max_net_flow_quartile, three models were used: linear regression (LR), random forest regression (RF), and support vector regression (SVR), and the predictive ability of the models was evaluated by root mean square evaluation (RMSE). The interaction metrics, start_time, and duration(s) in the first dataset were used as independent variables to forecast sales. Brand, account type, product category, start_time, and duration(s) in the second dataset are used as independent variables to predict max_net_flow_quartile. The relative contribution of each independent variable to the target variable was evaluated, and the permutation importance analysis method was used to determine the feature importance by scrambling the variable values and observing the changes in the model performance.
4. Results and analysis
4.1. Descriptive statistics of key variables
Descriptive statistics (Table 2) show a significant long-tail effect in live-streaming. The mean sales value is 2,223,106, but the standard deviation is 6,432,933. A large standard deviation (7,021) indicates a significant fluctuation in max_net_flow. The traffic of most live streams is concentrated in the lower range, but a few live streams may have very high traffic. The results show a typical long-tail distribution in live-streaming traffic and sales performance, reflecting the dominant role of top accounts and popular content on the TikTok live-streaming platform's overall traffic and sales. Regarding interaction indicators, the mean number of views is 802,251, with a standard deviation of 1,931,576, indicating that a small number of live streams attract the majority of viewers. The maximum values of bullet_screen_count, share_count, like_count, and gift_count are notably high. However, the substantial difference between the mean and median values for these variables suggests that the level of audience interaction in most live streams remains relatively limited.
Table 2: Descriptive statistics of the study variables.
Variable | Min | Max | Mean | SD | Median |
Sales | 0 | 225979076.6 | 2223106.291 | 6432933.291 | 713454.7 |
Max_net_flow | 0 | 214624 | 2007.187482 | 7021.460577 | 344 |
Word_of_mouth | 4.05 | 5 | 4.771 | 0.182 | 4.79 |
Views | 0 | 41109725 | 802251.413 | 1931576.315 | 219334 |
Peaknumber | 0 | 1030899 | 15834.259 | 43030.908 | 2927 |
Average_online_count | 0 | 355000 | 8221.364 | 22876.07 | 1449 |
Average_stay_time | 0 | 2952 | 137.658 | 123.828 | 101 |
Average_stay_index | 0 | 39.369 | 2.348 | 2.336 | 1.761 |
Like_count | 0 | 244589418 | 2020102.03 | 8286944.78 | 73628 |
New_fans_group | -2292 | 530987 | 2978.853 | 15124.032 | 218 |
New_fans | -2419770 | 8128113 | 22030.309 | 191648.471 | 1215 |
Gift_count | 0 | 698437 | 7709.007 | 26692.703 | 877.5 |
Bullet_screen_count | 1 | 47908473 | 199119.968 | 1350161.439 | 17706 |
Share_count | 1 | 369574 | 1214.194 | 7028.848 | 137 |
Duration(s) | 1 | 159838 | 20444.98 | 15700.031 | 18475 |
4.2. Model performance and feature importance
4.2.1. Sales forecasting models
In comparing sales forecasting models (Table 3), the SVR model performed best, with the lowest RMSE of 3262906.89, showing its strength in dealing with complex nonlinear relationships. The performance of the RF model was slightly weaker, with an RMSE of 4124883.99. The LR model performed the worst with an RMSE of 6,394,829.12, showing its limitations in dealing with complex nonlinear data. From the perspective of model feature importance analysis, views (0.531), gift_count (0.07), and new_fans_group (0.05) are the three core variables that drive sales. The variable "views" holds the highest weight, reflecting the reach of live-streaming, which directly determines its ability to convert sales. While metrics "duration" (0.00004) and "start_time" (0.016842) are less influential compared to viewer-related variables, they nonetheless contribute to sales outcomes, indicating their contextual relevance in shaping live-streaming performance.
Table 3: The comparison of sales and max_net_flow_quartile prediction model.
Model | Sales RMSE | Max_net_flow_quartile RMSE |
Support Vector Regression (SVR) | 3,262,906.89 | 0.2775 |
Random Forest (RF) | 4,124,883.99 | 0.2905 |
Linear Regression (LR) | 6,394,829.12 | 0.2928 |
4.2.2. Max_net_flow_quartile prediction model
In comparing max_net_flow_quartile prediction models (Table 3), the SVR model also performed well, with the lowest RMSE of 0.2775, showing high adaptability in predicting complex traffic distributions. Overall, the RMSE differences between the three models are insignificant, indicating that the selected variables have relatively consistent explanatory power for the target variables. The feature importance analysis shows the dominance of duration (0.026), account type (0.0059), and brand (0.0057) influence in predicting max_net_flow_quartile. "Duration" is the most influential factor and significantly better than the other variables, which indicates that the length of live streaming is closely correlated with net traffic quartile results. "Account type" ranks as the second most important factor, reflecting that different account types are aimed at different audience groups and have different influences. The third most important feature, brand, highlights the importance of brand recognition and trust in attracting and retaining audiences. Although the variable "product category" (0.0051) exhibits relatively lower importance, it remains relevant as it reflects audience preferences for different types of products. The star_time is the least important of all the characteristics, but it is still relevant.
4.3. Impact of Account Type and Product Category
A cross-variate analysis was conducted to examine the relationship between categorical independent variables (e.g., account type and product category) and their impact on the dependent variables max_net_flow_quartile and sales. The results (Table 4) showed that the impact of different account types on sales was statistically significant (F = 437.16, P < 0.05). Among the "accounts type," the performance of celebrity accounts was the most prominent (M = 9013409.850), which may be related to their fan base, strong influence, and high brand trust. Personal accounts ranked second in average sales; compared to celebrity accounts, they may rely on personalized content and community interaction. In contrast, ordinary and well-known brand accounts exhibited relatively lower average sales, which may reflect the limitations of brand accounts in terms of traffic conversions. The impact of product category on sales was also significant (F = 56.70, P < 0.05). The "other" category achieved the highest average sales (M = 4,077,343.304), indicating that diversified product marketing strategies more effectively capture audience attention. The beauty product category ranked second (M = 2,265,227), likely due to its broad audience base and high market demand. In comparison, the food and household goods categories showed lower average sales, indicating limited appeal or market reach for these products.
Table 4: Influence of Account Type and Product Category on max_net_flow_quartile and sales.
Variables | Max_net_flow_quartile | Sales | |
Account Type | Celebrity Account | 0.397 ± 0.283 | 9013409.850 |
Well-Known Brand Account | 0.389 ± 0.297 | 823534.307 | |
Ordinary Brand Account | 0.362 ± 0.290 | 1126216.630 | |
Personal Account | 0.332 ± 0.286 | 2638060.807 | |
Product Category | Other | 0.347±0.284 | 4077343.304 |
Beauty | 0.382±0.311 | 2265227.06 | |
Study supplies | 0.349±0.293 | 2117059.216 | |
Jewelry | 0.345±0.292 | 1932099.795 | |
Electronics | 0.429±0.292 | 1873888.255 | |
Fashion | 0.353±0.288 | 1500960.219 | |
food | 0.539±0.287 | 954752.3967 | |
Household Goods | 0.289±0.255 | 782979.5805 |
In terms of measuring max_net_flow_quartile, the results showed that different account types (F = 30.407, P < 0.001) and product categories (F = 25.21, P < 0.001) were statistically significant. Celebrity accounts achieved the highest average quartile performance (M = 0.397 ± 0.283), indicating their strong ability to attract peak traffic during live streams. However, Personal Account performed poorly in the maximum traffic quartile (M = 0.332 ± 0.286), possibly due to a lack of promotion resources or a fan base. Food product accounts (M = 0.539 ± 0.287) and electronics product accounts (M = 0.429 ± 0.292) outperformed other product categories in the maximum traffic quartile, reflecting their ability to generate and sustain high traffic levels during live streams. The "other" product accounts showed average performance, while the household goods account (M = 0.289 ± 0.255) and the fashion product account (M = 0.353 ± 0.288) demonstrated weak traffic performance.
4.4. Temporal distribution of traffic and sales
Live-streaming traffic and sales show a different pattern throughout the day (Figure 1). The traffic peak occurs at 10 pm, indicating that this is the prime time for audience interaction. Another notable peak occurs during lunchtime (12 pm to 1 pm), corresponding to the audience's lunch break. Conversely, traffic levels reach their lowest point between 3 am and 4 am, in line with typical breaks. Sales trends also reflect these daily rhythms, with a noticeable surge at 9 am, marking the beginning of consumer activity. Subsequent sales peaks occur during lunch hours (12 pm to 1 pm) and after hours (5 pm to 6 pm), suggesting that promotions targeted at these periods can improve sales performance. While the peak of the maximum net flow overlaps with some sales peaks, some non-overlapping periods indicate that traffic does not always translate directly into sales.
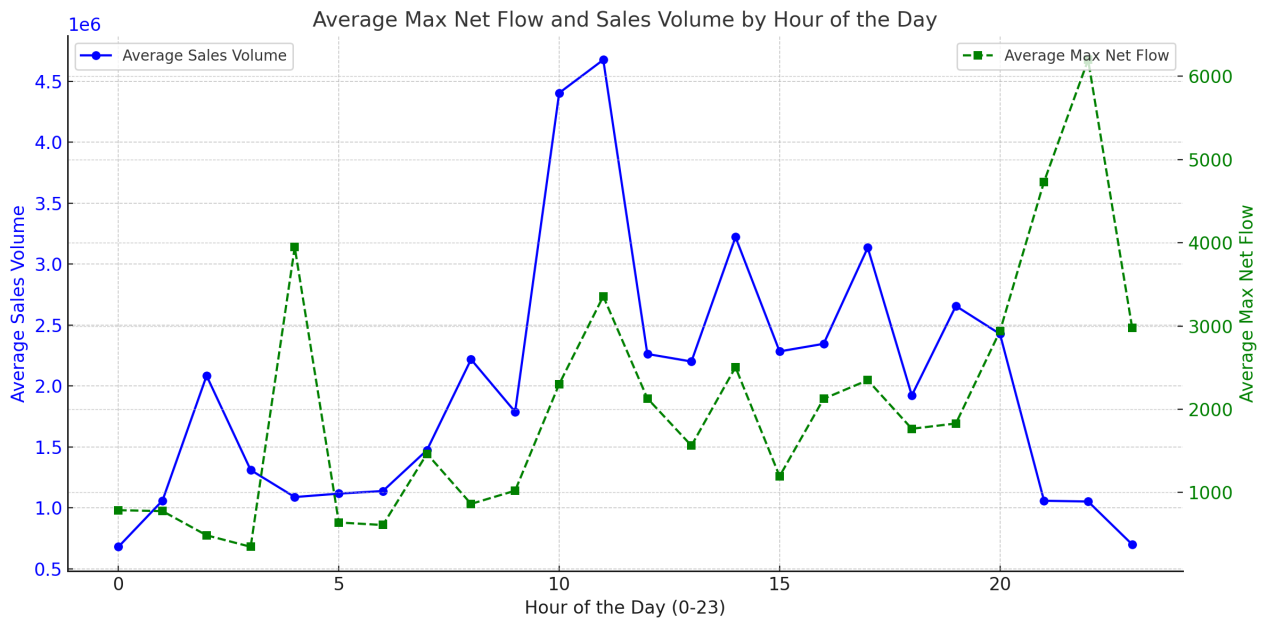
Figure 1: Average max net flow and sales by hour of the day.
5. Discussion and Conclusion
Through an empirical analysis of large-scale data on TikTok's live-streaming platform, this study reveals the significant impact of audience interaction on traffic and sales. The study found that duration is the most important variable affecting live-streaming traffic, which suggests that extending live-streaming duration provides more opportunities to increase audience exposure to content and build social connections, further attaining and sustaining live-streaming traffic. The study also found that audience interaction metrics (e.g., views, gift_count, and new fans) had a great ability to predict sales, supporting previous studies on the positive impact of interactivity and social trust on audiences' purchase decisions [6]. Moreover, the financial contribution (gift_count) provides a means for audiences to directly socialize with streamers and self-disclose themselves among the online community, enhancing audiences' psychological well-being and eliciting their subsequent commitment [11]. In addition, the study reveals that traffic peaks do not always coincide with sales peaks, suggesting that while real-time interactions are key drivers, traffic conversions are also influenced by other factors such as content relevance, promotion strategy, etc.
These findings extend the applicability of social presence theory in live-streaming e-commerce, illustrating how real-time interactions enhance audience engagement and social connection, thereby promoting audience retention and sales conversion. Live-streaming real-time interaction enhances the audience's sense of social presence and belonging by providing a platform for audiences to interact with streamers and other viewers; the development of the parasocial relationship [12] because of direct interactions between live-streamers and audiences facilitates audiences' intention to continue viewing and their willingness to support streamers financially [13]. In addition, the study confirmed the differences in the impact of social presence on traffic and sales conversions among different audience groups based on different account types [14]. For example, celebrity accounts build a high-trust and highly interactive environment based on a large fan base, much higher than other account types regarding traffic attraction and sales conversion; fans interact with their favorite celebrities via online face-to-face settings trigger their perception of social support and psychological well-being [15]. The study further reveals the impact of the temporal structure of media consumption on the differences in audiences' responses to social presence. Prime engagement hours, such as lunch breaks and evenings, provide more opportunities for audiences to interact in real time, demonstrating how closely audience interactions are connected to the rhythm of daily life [16].
In a practical sense, this study's findings show significant differences in live-streaming performance between different account types and product categories, providing practical advice for live-streaming content creators and marketers. Celebrity accounts stand out due to their large fan base and high trust, while personal accounts rely on personalized content and community interaction strategies to generate higher sales. Compared to celebrities and personal accounts, generic and well-known brands performed relatively poorly in traffic and conversions, reflecting their limitations in content appeal and real-time interactive design. Regarding product categories, beauty, and electronics show high traffic and sales potential, which may be closely related to their broad audience base and strong market demand. In contrast, household goods and food categories exhibited low sales performance, and it is recommended that the platform optimize the content display and event design of these categories to increase interaction. Temporal structure analysis shows that prime interaction hours, such as evenings and lunchtime, should be prioritized to maximize audience engagement and sales conversions. In addition, the inconsistencies between traffic and sales peaks suggest that platforms should consider platform optimization from various aspects, such as increasing popularity, content relevance, and interaction mechanism optimization.
There are still some limitations in this study, which deserve further exploration in the future. The reliance on a single platform (TikTok) may limit the generalization of the findings to other social media ecosystems with different audience demographics and interaction norms. In addition, although the quantitative methods used in this study reveal the correlation between variables, the in-depth discussion of audience motivation, perception, and decision-making process still needs to be improved. Future research can further uncover the psychological mechanisms in audience interaction through interviews and biometric recognition such as eye tracking or emotion recognition. In addition, longitudinal studies that track changes in audience interaction patterns over time can provide a deeper understanding of evolving social commerce dynamics.
Based on empirical research, this study deeply explores the key audience interaction factors that affect traffic and sales conversion in live streaming, enriches the theoretical framework in social e-commerce, and provides guidance for live-streaming optimization. By combining data-driven analysis with social presence theory, the study contributes to a broader discussion of the role of digital communication in reshaping audience engagement patterns and subsequent consumer behavior.
References
[1]. Short, J., Williams, E., & Christie, B. (1976). The social psychology of telecommunications. Wiley.
[2]. Guo, J., Li, Y., Xu, Y., & Zeng, K. (2021). How live streaming features impact consumers’ purchase intention in the context of cross-border e-commerce? A research based on SOR theory. Frontiers in Psychology, 12, 767876.
[3]. Hou, F., Guan, Z., Li, B., & Chong, A. Y. L. (2020). Factors influencing people’s continuous watching intention and consumption intention in live streaming: Evidence from China. Internet Research, 30(1), 141–163.
[4]. Ang, K. T., Tan, J. K., & Lim, S. H. (2018). The influence of social interaction on live-streaming viewer behavior: Interactivity, presence, and social status display. Journal of Interactive Media, 35(2), 112–126.
[5]. Wei, Z., Zhang, M., & Qiao, T. (2022). Effect of personal branding stereotypes on user engagement on short-video platforms. Journal of Retailing and Consumer Services, 69, 103121.
[6]. Zou, J., & Fu, X. (2024). Understanding the purchase intention in live streaming from the perspective of social image. Humanities and Social Sciences Communications.
[7]. Suganuma, N. (2018). An ethnography of the Twitch.tv streamer and viewer relationship.
[8]. Cong, Z., Liu, J., & Manchanda, P. (2021). The role of "live" in livestreaming markets: Evidence using orthogonal random forest. arXiv preprint arXiv:2107.01629.
[9]. Widell, M., & Marco, G. (2020). Outcomes of personal branding in a virtual third place: A qualitative study on streamer-viewer relationships on Twitch. Tv.
[10]. Sano, T. (2023). Categorization of live-streaming accounts and product types: Insights from TikTok platform data. Journal of Social Commerce Studies, 18(4), 202–215.
[11]. Wolff, G. H., & Shen, C. (2024). Social live-streaming use and well-being: Examining participation, financial commitment, social capital, and psychological well-being on Twitch.tv. Social Science Computer Review. https://doi.org/10.1177/08944393231224543
[12]. Dibble, J. L., Hartmann, T., & Rosaen, S. F. (2016). Parasocial relationships and media consumption. Journal of Communication, 65(1), 156–172.
[13]. Wohn, D. Y., Freeman, G., & McLaughlin, C. (2018). Explaining viewers’ emotional, instrumental, and financial support provision for live streamers. In Proceedings of the 2018 CHI Conference on Human Factors in Computing Systems, Montreal, QC, Canada. https://doi.org/10.1145/3173574.3174048
[14]. Chen, L.-R., Chen, F.-S., & Chen, D. (2023). Effect of social presence toward livestream e-commerce on consumers’ purchase intention. Sustainability.
[15]. Lakey, B., Cooper, C., Cronin, A., & Whitaker, T. (2014). Symbolic providers help people regulate affect relationally: Implications for perceived support. Personal Relationships, 21(3), 404–419. https://doi.org/10.1111/pere.12038
[16]. Impact of Broadcaster’s Social Presence and Ad Content Persuasiveness on Impulsive Purchase Behaviour in China Live Streaming: A Mediation Analysis of Arousal and Emotion. (2024). International Journal of Business and Technology Management.
Cite this article
Yang,M. (2025). Social Presence in Live-Streaming: Explore the Role of Audience Interaction in Traffic and Sales Conversions on TikTok. Lecture Notes in Education Psychology and Public Media,84,165-173.
Data availability
The datasets used and/or analyzed during the current study will be available from the authors upon reasonable request.
Disclaimer/Publisher's Note
The statements, opinions and data contained in all publications are solely those of the individual author(s) and contributor(s) and not of EWA Publishing and/or the editor(s). EWA Publishing and/or the editor(s) disclaim responsibility for any injury to people or property resulting from any ideas, methods, instructions or products referred to in the content.
About volume
Volume title: Proceedings of the 3rd International Conference on Social Psychology and Humanity Studies
© 2024 by the author(s). Licensee EWA Publishing, Oxford, UK. This article is an open access article distributed under the terms and
conditions of the Creative Commons Attribution (CC BY) license. Authors who
publish this series agree to the following terms:
1. Authors retain copyright and grant the series right of first publication with the work simultaneously licensed under a Creative Commons
Attribution License that allows others to share the work with an acknowledgment of the work's authorship and initial publication in this
series.
2. Authors are able to enter into separate, additional contractual arrangements for the non-exclusive distribution of the series's published
version of the work (e.g., post it to an institutional repository or publish it in a book), with an acknowledgment of its initial
publication in this series.
3. Authors are permitted and encouraged to post their work online (e.g., in institutional repositories or on their website) prior to and
during the submission process, as it can lead to productive exchanges, as well as earlier and greater citation of published work (See
Open access policy for details).
References
[1]. Short, J., Williams, E., & Christie, B. (1976). The social psychology of telecommunications. Wiley.
[2]. Guo, J., Li, Y., Xu, Y., & Zeng, K. (2021). How live streaming features impact consumers’ purchase intention in the context of cross-border e-commerce? A research based on SOR theory. Frontiers in Psychology, 12, 767876.
[3]. Hou, F., Guan, Z., Li, B., & Chong, A. Y. L. (2020). Factors influencing people’s continuous watching intention and consumption intention in live streaming: Evidence from China. Internet Research, 30(1), 141–163.
[4]. Ang, K. T., Tan, J. K., & Lim, S. H. (2018). The influence of social interaction on live-streaming viewer behavior: Interactivity, presence, and social status display. Journal of Interactive Media, 35(2), 112–126.
[5]. Wei, Z., Zhang, M., & Qiao, T. (2022). Effect of personal branding stereotypes on user engagement on short-video platforms. Journal of Retailing and Consumer Services, 69, 103121.
[6]. Zou, J., & Fu, X. (2024). Understanding the purchase intention in live streaming from the perspective of social image. Humanities and Social Sciences Communications.
[7]. Suganuma, N. (2018). An ethnography of the Twitch.tv streamer and viewer relationship.
[8]. Cong, Z., Liu, J., & Manchanda, P. (2021). The role of "live" in livestreaming markets: Evidence using orthogonal random forest. arXiv preprint arXiv:2107.01629.
[9]. Widell, M., & Marco, G. (2020). Outcomes of personal branding in a virtual third place: A qualitative study on streamer-viewer relationships on Twitch. Tv.
[10]. Sano, T. (2023). Categorization of live-streaming accounts and product types: Insights from TikTok platform data. Journal of Social Commerce Studies, 18(4), 202–215.
[11]. Wolff, G. H., & Shen, C. (2024). Social live-streaming use and well-being: Examining participation, financial commitment, social capital, and psychological well-being on Twitch.tv. Social Science Computer Review. https://doi.org/10.1177/08944393231224543
[12]. Dibble, J. L., Hartmann, T., & Rosaen, S. F. (2016). Parasocial relationships and media consumption. Journal of Communication, 65(1), 156–172.
[13]. Wohn, D. Y., Freeman, G., & McLaughlin, C. (2018). Explaining viewers’ emotional, instrumental, and financial support provision for live streamers. In Proceedings of the 2018 CHI Conference on Human Factors in Computing Systems, Montreal, QC, Canada. https://doi.org/10.1145/3173574.3174048
[14]. Chen, L.-R., Chen, F.-S., & Chen, D. (2023). Effect of social presence toward livestream e-commerce on consumers’ purchase intention. Sustainability.
[15]. Lakey, B., Cooper, C., Cronin, A., & Whitaker, T. (2014). Symbolic providers help people regulate affect relationally: Implications for perceived support. Personal Relationships, 21(3), 404–419. https://doi.org/10.1111/pere.12038
[16]. Impact of Broadcaster’s Social Presence and Ad Content Persuasiveness on Impulsive Purchase Behaviour in China Live Streaming: A Mediation Analysis of Arousal and Emotion. (2024). International Journal of Business and Technology Management.