


1. Introduction
Enzymes are macromolecules composed of proteins that function as biocatalysts, enhancing the rate of biological reactions while preserving their structure and integrity [1]. Enzymes decrease the activation energy necessary for a reaction to occur, increasing the rate of the chemical process [2]. Activation energy is a fundamental concept in chemistry that signifies the lowest quantity of energy required for a chemical reaction to take place [1]. Enzymes are essential for the normal functioning of organisms, as they play a crucial role in enhancing the efficiency of biochemical processes [2]. Enzymes exhibit varied roles and activities due to the specificity and uniqueness of their active sites [1]. The active site of an enzyme confers specificity by virtue of its unique shape, which is tailored to accommodate the substrate of the enzyme [3]. Furthermore, the activation energy associated with enzymes refers to the minimum energy required for the successful binding of the enzyme and substrate, leading to the formation of the enzyme-substrate complex [1]. Modifications to the conformation of the active site, enzyme, or substrate have the potential to impact the establishment of the enzyme-substrate complex and impede the interaction between enzymes and substrates [4]. Furthermore, enzyme activity and the formation of the enzyme-substrate complex are influenced by various parameters, such as temperature, environmental pH, and enzyme concentration [1].
The effect of pH on enzyme-catalyzed activity will be explored in this study to research the role of pH in how organisms work. The impact of buffer pH on enzymatic activity will be explored using wheat germ acid phosphatase [5]. Wheat germ acid phosphatase is a protein produced from the germ of wheat plants that is commercially synthesised [6]. It can be utilised as an enzyme to dephosphorylate the reactants and play a part in general metabolic reactions such as ATP and protein phosphate hydrolysis [7].
Wheat germ acid phosphatase is an appropriate enzyme for this investigation due to its stability in tests and its ability to reliably assess its activity [6]. Furthermore, wheat germ acid phosphatase is commonly used in biochemistry laboratories [6]. The dephosphorylation of p-nitrophenyl phosphate (p-NPP) to p-nitrophenol (p-NP) will be evaluated in this work using wheat germ acid phosphatase activity. To examine phosphatase activity, a stopped assay technique will be utilised, in which the reaction proceeds for a predetermined duration before being inactivated. After 10 minutes, sodium hydroxide will be introduced to the reaction to stop it. A high concentration of hydroxide ionises p-NP, resulting in a yellow anion that absorbs light at 405 nm. As a result, the amount of product produced by phosphatase catalysis is proportional to the absorbance at 405nm. This permits the product produced (in nmol) per minute of incubation time to be quantified, producing the rate of acid phosphatase catalysis.
This study includes various goals that have been divided into three sections to aid in the research of the effect of pH on enzyme activity. Part 1 of the study developed a standard curve that shows the relationship between the amount of p-NP present and the corrected absorbance at 405nm. The standard curve would be used in Parts 2 and 3 to calculate how much p-NP (in nmol) was produced by wheat germ acid phosphatase5. Second, the standard curve established in Part 1 was used in Part 2 to determine the ideal incubation period of wheat-germ acid phosphatases required to achieve the maximal product. In particular, quantifying the product generated by wheat germ acid phosphatase at various incubation durations aided in determining the ideal incubation time for exploring the effects of pH on acid phosphatase in Part 3. Finally, the effect of pH on enzyme activity was examined by measuring the initial reaction velocity of the enzyme in various pH settings.
Overall, the results of this study reveal that when the buffer pH was higher or lower than the hypothesised ideal value of 5.5, the rates of catalysis reduced. The decrease in enzyme activity may be due to changes in protein structure, with denaturation of the enzyme lowering the catalytic rate [1].
2. Materials and Methods
2.1. Preparation of the Standard Curve for p-Nitrophenol
This standard curve should be used for the remaining parts of this experiment.
Materials:
• 0.25 mM p-NP
• 0.4 M NaOH
Methods:
1. With Table 1 as a guide, create a standard curve for p-NP that includes five distinct p-NP concentrations: 0, 8, 16, 24, 32, and 40 (up to a maximum of 40 nmol p-NP).
2. Calculate the volumes of water and p-NP needed so that each well has the right amount of p-NP in a final 160 µL volume.
3. Wells A1 and A2 are employed as the blank, meaning they only have 160 µL of water in them and don’t contain any p-NP. Every dilution must also be made in duplicate.
Table 1. Setup for standard curve
Microtiter Plate Wells | A1/A2 | B1/B2 | C1/C2 | D1/D2 | E1/E2 | F1/F2 |
Volume 0.25 mM p-NP (µL) | 0 | 32 | 64 | 96 | 128 | 160 |
nmol p-NP per well | 0 | 8 | 16 | 24 | 32 | 40 |
Distilled water (µL) | 160 | 128 | 96 | 64 | 32 | 0 |
1. Pour 40 µL of 0.4 M NaOH into each well.
2. After finishing all of the trials, measure the absorbance at 405 nm and record the data in the table of results part.
3. Calculate the average absorbance and deduct the average absorbance value for A1/A2 from the raw average absorbance values for wells B1/B2 to F1/F2.
4. Plot a standard corrected absorbance curve versus nmols of p-NP per well using Excel, another graphing program, or graph paper. The remaining portions of this experiment should be conducted using this standard curve.
2.2. Determining the optimum time of incubation for what type of germ acid phosphatase
When the substrate is used up and the levels of the product rise, the rate of an enzyme-catalyzed reaction varies over time. In order to investigate this phenomenon, we will need to prepare seven distinct wells containing p-nitrophenyl phosphate (pNPP, substrate) and citrate buffer (pH 5.0). The reaction will start when an enzyme is added to a particular well at a given time. At the designated timings, the reaction will be halted, and the p-NP (product) colour will be created by adding an alkali.
Materials:
• 2.5 mM p-NPP (Mr = 371.15; 2.5 mM = 0.928 g/L)
• Acid phosphatase 0.065 mg/mL
• 0.1 M Citrate buffer pH 5.0
• 0.4 M NaOH
Methods:
1. Fill one column out of the microplate wells (A to H) with 50 µL of 0.1M citrate buffer pH 5.0.
2. Transfer 40 µL of the substrate, 2.5 mm p-NPP, into each microplate well. Avoid confusing the product (p-NP) with the substrate (p-NPP).
3. Administer the enzyme (70 µL) and 0.4 M NaOH (40 µL) according to the instructions in Table 3 methodology at the designated times.
Table 2. Summary of the times reaction components are to be added
Well | Enzyme addition time (70 µL) | NaOH addition time (40 µL) | Total incubation time of the well |
B | 0 min | 30 min | 30 min |
C | 1 min | 26 min | 25 min |
D | 2 min | 22 min | 20 min |
E | 3 min | 18 min | 15 min |
F | 4 min | 16 min | 12 min |
G | 5 min | 13 min | 8 min |
H | 6 min | 10 min | 4 min |
1. After the incubation is complete, fill well A (the reaction blank) with 70 µL of distilled water and 40 µL of 0.4 M NaOH.
2. After finishing all the components, measure the absorbance at 405 nm.
3. Enter the results in the box in Table 4 for this section. Determine the freed amounts of p-NP by analysing your standard curve.
4. Use Excel, for example, to plot the release of nmol p-NP vs time.
5. Calculate the initial response velocity using this curve.
6. Determine the specific activity of the enzyme.
2.3. Determine the enzyme activity of Wheat-germ acid phosphatase
Wheat-germ acid phosphatase enzyme activity was examined in Part 3 of this study in relation to buffer pH. The following list of supplies and procedures is utilised to complete the investigation in Part 3.
Materials
• 1 microtiter plate
• 2.5 mM p-nitrophenyl phosphate (p-NPP) (Mr = 371.15; 2.5 mM = 0.928 g/L)
• Wheat-germ acid phosphatase 0.065 mg/mL
• 0.1M Citrate buffers at pH 3.0, 4.5, 5.0, 5.5 and 6.0
• 0.1M Tris buffers at pH 7.0 and 9.0
• 0.4 M NaOH
• Distilled water
• P100 and P200 pipettes with appropriate tips
• Timer/stopwatch
• Multiskan MS microtiter plate reader
Method
1. As shown in Table 3, wells A1A2-F1F2 and G1G2-H1H2 received 50 L of 0.1 M Citrate buffers at pH 3.0, 4.5, 5.0, 5.5, and 6.0, and 0.1 M Tris buffers at pH 7.0 and 9.0, respectively.
2. A1A2 are designated as blank wells, and 5.0 was the pH of the buffer used.
3. 3. 40 µL of 2.5 mM p-NPP was applied to wells A1A2-H1H2.
4. Table 4 shows that 70 L of 0.065 mg/mL wheat-germ acid phosphate and 0.4M NaOH were given to the wells at various times. This would ensure that each well would incubate for 10 minutes.
5. Wells A1A2 were used as blank wells, and 70 µL of distilled water and 40 µL of 0.4 M NaOH were added.
6. The Multiskan MS microtiter plate reader was used to read the microtiter plate at an absorbance of 405 nm.
7. The amount (in nmol) of p-NP generated in wells A through H was determined using the standard curve created in Part 1.
Table 3. pH of buffers and volumes of reagents per well
Well | pH of the buffer | Volume of buffer (L) | Volume of 2.5 mM p-NPP (L) | Volume of 0.065 mg/mL Acid Phosphate (L) | Volume of 0.4M NaOH ((L) |
A1 A2 (Blank) | 5.0 | 50 | 40 | 70 distilled water | 40 |
B1 B2 | 3.0 | 50 | 40 | 70 | 40 |
C1 C2 | 4.5 | 50 | 40 | 70 | 40 |
D1 D2 | 5.0 | 50 | 40 | 70 | 40 |
E1 E2 | 5.5 | 50 | 40 | 70 | 40 |
F1 F2 | 6.0 | 50 | 40 | 70 | 40 |
G1 G2 | 7.0 | 50 | 40 | 70 | 40 |
H1 H2 | 9.0 | 50 | 40 | 70 | 40 |
Table 4. Addition times for wheat-germ acid phosphatase and NaOH (min)
Well | Enzyme addition time (70L) | NaOH addition time (40L) | Total incubation time of the well |
A1 A2 (Blank) | Water 70L | - | - |
B1 B2 | 0 min | 10min | 10min |
C1 C2 | 1min | 11min | 10min |
D1 D2 | 2min | 12min | 10min |
E1 E2 | 3min | 13min | 10min |
F1 F2 | 4min | 14min | 10min |
G1 G2 | 5min | 15min | 10min |
H1 H2 | 6min | 16min | 10min |
3. Results
3.1. Part 1
Table 5. Absorbance readings of the standard curve
Microtiter Plate Wells | A1 A2 | B1 B2 | C1 C2 | D1 D2 | E1 E2 | F1 F2 |
Amount of p-NP per well (nmol) | 0 | 8 | 16 | 24 | 32 | 40 |
Raw Absorbance at 405 nm | 0.051 | 0.370 | 0.750 | 1.077 | 1.412 | 1.729 |
0.046 | 0.323 | 0.709 | 1.115 | 1.437 | 1.737 | |
Mean Absorbance at 405 nm | 0.048 | 0.347 | 0.729 | 1.096 | 1.425 | 1.733 |
Corrected Absorbance at 405nm | 0 | 0.299 | 0.681 | 1.048 | 1.377 | 1.685 |
The raw and corrected absorbance values at 405 nm are included in Table 5, together with the amounts of p-NP in nmol applied to each well. The standard curve displayed in Figure 1 was created using this data.
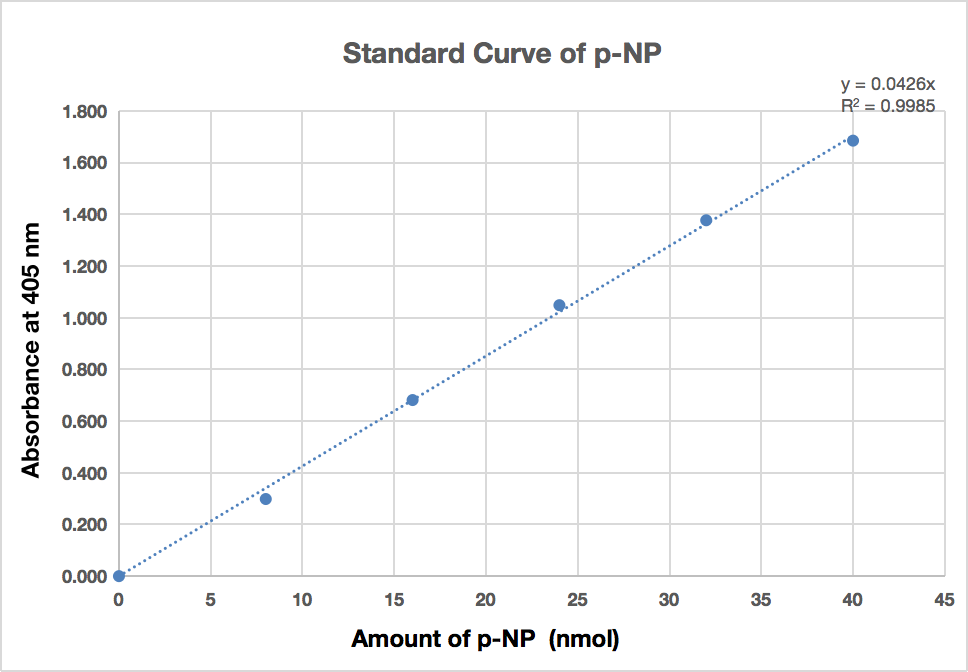
Figure 1. Standard curve of absorbance against the amount of p-NP per well
The corrected absorbance at 405 nm and the quantity of n-NP generated in the wells have a strong, positive, linear relationship, as shown by the standard curve in this graph. With a \( { R^{2}} \) = 0.9985, the equation of the best-fit line selected for the data is y = 0.0426x. The origin (0,0) is also traversed by the linear trendline.
3.2. Part 2
Table 6. The measured absorbance at 405nm and the amount of product formed for different incubation time
Well | Incubation Time (min) | Raw Absorbance at 405 nm | Corrected Absorbance at 405 nm | p-NP (nmol per well) |
A3 (Blank) | - | 0.042 | 0.000 | 0.000 |
B3 | 30 | 0.804 | 0.762 | 19.897 |
C3 | 25 | 0.757 | 0.715 | 16.786 |
D3 | 20 | 0.628 | 0.586 | 13.763 |
E3 | 15 | 0.512 | 0.470 | 11.021 |
F3 | 12 | 0.435 | 0.393 | 9.230 |
G3 | 8 | 0.275 | 0.233 | 5.467 |
H3 | 4 | 0.201 | 0.159 | 3.735 |
Table 6 displays the absorbance at 405 nm as well as the quantity of the product p-NP (in nmol) generated over the various incubation times.
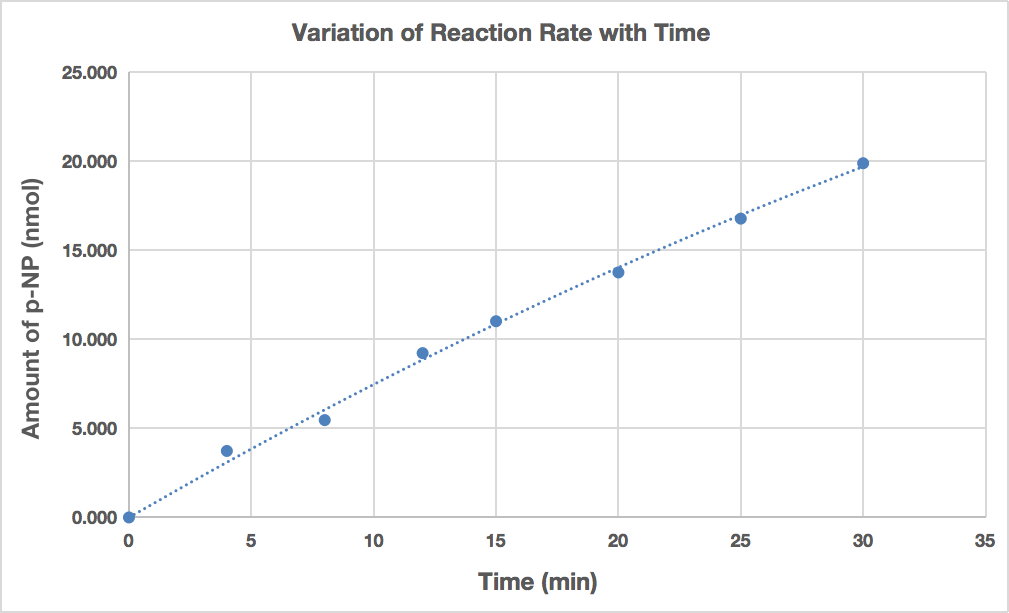
Figure 2. The amount of p-NP produced versus the incubation time of wheat-germ acid phosphatase with p-NPP
Figure 2 displays a graph of the product created for each incubation period. It shows that as incubation time increases, more p-NP (measured in nmol) is created. It does not seem as though there is a direct link between the product and the incubation period, though. A polynomial relationship between the product and the incubation period is suggested in Figure 2. Before 20 minutes, the relationship does seem to be linear, but after this point, it flattens out a little. After incubation ranging from 0 to 4 minutes, the initial reaction velocity was determined and found to be 0.934 nmol/min.
3.3. Part 3
Table 7. Absorbance and the amount of p-NP formed in buffers with different pH levels.
Microtiter Plate Wells | A1 A2 | B1 B2 | C1 C2 | D1 D2 | E1 E2 | F1 F2 | G1 G2 | H1 H2 |
pH of Buffers | 5.0 | 3.0 | 4.5 | 5.0 | 5.5 | 6.0 | 7.0 | 9.0 |
Mean Absorbance at 405nm | 0.054 | 0.125 | 0.324 | 0.376 | 0.398 | 0.383 | 0.232 | 0.094 |
Corrected Absorbance at 405nm | 0 | 0.071 | 0.270 | 0.322 | 0.344 | 0.329 | 0.178 | 0.040 |
Initial reaction velocity (nmol p-NP released/well/10min) | 0 | 1.656 | 6.327 | 7.556 | 8.080 | 7.721 | 4.177 | 0.940 |
Table 7 displays the absorbance at 405 nm and the quantity of p-NP generated at various buffer pH values. The starting velocity of each data point was plotted, as seen in Figure 3.
The impact of pH on wheat germ acid phosphatase activity is graphically depicted in Figure 3. Wheat germ acid phosphatase activity is determined by measuring the amount of P-NP generated in nmol during a 10-minute incubation period, within the pH range of 3 to 5.5. At roughly 8 nmol p-NP released/well/10min, the product is generated, and the reaction rate climbs to pH 5.5. Reduced is the initial response of p-NP at pH values greater than 5.5.
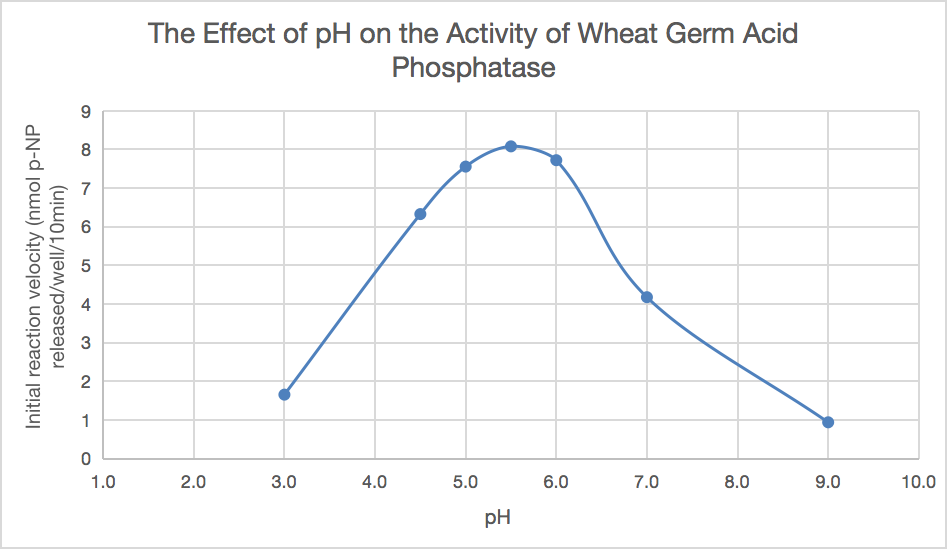
Figure 3. Graph of Wheat Germ Acid Phosphatase Activity against pH of buffers.
4. Calculations
4.1. Corrected Absorbance Values
The mean absorbance is the average of the raw data obtained at 405 nm from microtiter plate wells A1A2 to F1F2. Subtracting the mean absorbance for A1A2 from the mean absorbance values for B1B1 to F1F2 yields the corrected absorbance at 405 nm.
Example Wells: A1A2 and B1B2
Relevant graph: Table 5
Mean Absorbance for A1A2 = \( \frac{(0.051+0.046)}{2} \) = 0.048
Mean Absorbance for B1B2 = \( \frac{(0.370+0.323)}{2}= \) 0.347
Corrected Absorbance for B1B2 = 0.347 – 0.048 = 0.299
For B1B2, the corrected absorbance is 0.299.
The methodology for the adjusted absorbance in Parts 2 and 3 is the same as that of Part 1. The raw absorbance at 405 nm can be used in place of the mean absorbance because Part 2 did not conduct repeated experiments for each well.
4.2. P-NP production amount
The linear trendline of the Standard Curve for p-NP developed in Part 1 Figure 1 can be used to calculate the amount of p-NP produced in each well.
The equation shown in excel is:
y = 0.0426x
This can be rearranged to:
x= \( \frac{y}{0.0426} \)
This equation has two variables: x= Amount of p-NP per well (in nmol) and y= Corrected Absorbance at 405 nm.
The adjusted absorbance at 405 nm needs to be entered into the equation in order to determine the quantity of p-NP. As an illustration, B3, whose corrected absorbance was 0.762 at 405 nm, had a y value equal to y= 0.762. The nmol of p-NP produced was then calculated using the y-value for B3, as indicated below.
x = \( \frac{0.762}{0.0426} \) = 19.897 nmol per well
For the remaining wells in Part 2 Table 6 and the outcomes in Part 3 Table 7, same process was repeated.
4.3. Initial reaction velocity
An appropriate indicator for evaluating the catalytic activity of an enzyme is its specific activity. The enzyme concentration and beginning reaction velocity were calculated.
n= the amount of acid phosphate
c= concentration of the acid phosphate
v= volume of the acid phosphate
n= cv = concentration of the acid phosphate x volume of the acid phosphate
= 0.065 mg/mL x 70 L = 0.065g/L x 70 L = 4.55g = 4.55 \( x {10^{-3}} \) mg
Specific activity= \( \frac{initial reaction velocity }{amount of the enzyme in the well} \)
= \( \frac{0.934 nmol/min}{4.55g} \)
= \( \frac{0.934 x {10^{-3}}mol/min}{4.55x {10^{-3}}mg} \)
= 0.205 mol p-NP released /min/mg protein
Wheat germ acid phosphatase has a specific enzyme activity of 0.205 µmol p-NP released/min/mg protein.
5. Discussion
The purpose of this experiment was to determine the initial reaction velocity for each pH setting that was investigated in order to examine the impact of buffer pH on enzyme activity. Therefore, the objectives of Parts 1 and 2 were to measure the amount of p-NP generated and the optimum time of incubation, respectively.
Part 1 involved creating a standard curve that shows the relationship between the corrected absorbance at 405 nm and the amount of p-NP (in nmol) found. The corrected absorbance and the quantity of p-NP in the wells measured at 405 nm were shown to have a strong, positive, linear relationship with increasing nmol of p-NP, as shown by the standard curve in Figure 1. The standard curve used in this study has a \( {R^{2}} \) of 0.9985, and its closeness to a \( { R^{2}} \) value of 1 indicates a linear relationship between the absorbance and p-NP concentration. The amount of p-NP produced per well is represented by x in the p-NP standard curve equation y = 0.0426x, which was used for analysis in this study. By replacing the y value in Parts 2 and 3 with the corrected absorbance, this equation was utilised to calculate the p-NP generated in those parts. The p-NP generated in blank wells could be set to 0 due to the use of corrected absorbance. This explains why the origin (0,0) of the linear trendline in Figure 1 was crossed by it.
The experiment in Part 3 required guidance on the incubation time based on the ideal duration for wheat germ acid phosphatase catalysis. The amount of time required for the enzyme to reach its maximum catalysis rate is known as the optimum incubation period [1]. Because Part 2 of this study provided the time needed to incubate phosphatase at different pH values, it was crucial in guiding the operations in Part 3. In order to achieve this, the standard curve equation from Part 1 was used in Part 2 to quantify the quantity of p-NP produced by wheat-germ acid phosphatase at various incubation durations. As an alternative to a linear trendline, Figure 2 displays a polynomial curve for the product produced at various incubation times. In particular, after around 20 minutes, the plotted data started to flatten out. Nevertheless, because there was no product at the beginning of the incubation period, the polynomial curve continued to pass through the origin (0,0). The slope of any nearby locations in the linear section of Figure 2 was used to compute the initial reaction velocity of wheat germ acid phosphatase. In Part 3, the wells (A3 and H3) with an incubation duration of 0 to 4 minutes were chosen in order to compute the slope, which represented the wheat germ acid phosphatase activity for each condition examined. After ten minutes of incubation, the maximum rate of catalysis was seen. To assess phosphatase activity, a linear time frame was ensured by the 10-minute duration.
As seen in Figure 3, Part 3 demonstrated that the maximum quantity of p-NP produced was around 8 nmol per well at pH 5.5 and an incubation period of 10 minutes. Consequently, it can be concluded that wheat-germ acid phosphatase was most active at pH 5.5, which is consistent with the behaviour of enzyme activity that is expected. Hans Bisswanger states that most enzyme activity is affected by pH in a bell-shaped curve [8]. Furthermore, Bisswanger demonstrated that around pH 1 and pH 10, there was no product formed [8]. The data displayed in Figure 3 do not depict a fully inactivated phosphatase because the pH range selected for this research was pH 3 to 9. To be more precise, the enzyme product rate reached 0.940 nmol p-NP released/well/10min, which is the lowest initial reaction velocity. In addition to this, the presented results deviate from a previously published study since the reaction velocity of the enzyme was not 0 at pH values of 3 or 9, indicating that complete inactivation was not attained in this investigation.
The effects of pH on enzyme activity are shown in Figure 3. In particular, the charge of the amino acids in the structure of an enzyme can be impacted by pH [9]. Within the enzyme molecule, charged amino acids usually attract one another [10]. This attraction affects how the enzyme molecule folds, thus altering the shape of the active site [10]. Modifications to the active site of the enzyme can also affect its capacity to bind substrate, which may prevent the enzyme-substrate complex from forming [11]. Acidic or basic extremes in pH can lead to permanent denaturation of enzymes, rendering them inactive and causing the catalysing rate to decrease to 0 [4].
Enzymes have a pH range of 7.5, which is optimal for their activity and allows them to work both inside and outside of cells [12]. For instance, the pH of the cells in the digestive system is kept between 7.0 and 7.4. The optimal pH range for several digestive enzymes is 7.44 to 7.7 [1]. On the other hand, pH 2 is ideal for the enzyme activity of the stomach protease pepsin. Because of the hydrochloric acid environment in the stomach, the optimum pH of pepsin is beyond the usual range of enzyme activity [8]. Pepsin is a good illustration of how the environment of an enzyme determines the ideal pH at which it is most active.
A mild acid environment is provided by the scutellum tissue of wheat during germination, which is where the commercial wheat germ acid phosphatase employed in this work is isolated from [6]. Accordingly, the description of the report for wheat germ acid phosphatase indicates that a pH of 5.5 is ideal [12]. The results of this study show that pH is critical for enzyme activity and that it also corresponds with the ideal pH that wheat germ acid phosphatase has been shown to be at previously. Figure 3 illustrates how the rate of enzyme catalysis decreases for pH values that are either higher or lower than the ideal pH. Therefore, maintaining the enzyme at the ideal pH range may be required for the high reaction rate to occur and to support the various biochemical processes that organisms go through.
The optimal pH for wheat germ acid phosphatase could be precisely determined and confirmed in future studies. Its study only looked at pH 5.5; it did not evaluate the ideal range that would have confirmed its activity as being ideal for wheat germ acid phosphatase. A more precise experiment to ascertain the ideal pH might be carried out in the pH range of 5 to 6, monitoring the amount of p-NP product generated at each 0.1 increase. This experiment ought to utilise the same procedures as in Part 3, but it should yield a more precise ideal pH value.
6. Conclusion
In conclusion, this experiment successfully elucidated the relationship between pH levels and the activity of wheat germ acid phosphatase. By employing a methodical approach across different phases, it was possible to establish a direct correlation between pH and enzyme activity, with the highest activity observed at pH 5.5. The findings of the study align with the existing understanding of enzyme behaviour in response to pH variations, supporting the bell-shaped curve theory proposed by Bisswanger. Furthermore, the investigation highlighted the intricate interplay between enzyme structure, substrate binding, and environmental pH, underscoring the critical role pH plays in enzyme functionality. Although the study focused on a narrow pH range and identified pH 5.5 as optimal for wheat germ acid phosphatase activity, it opens avenues for future research to determine a more precise optimal pH range. Such research could help us comprehend more about the activity of this enzyme, leading the path for more targeted and efficient applications in biochemical processes.
References
[1]. P. K. Robinson, “Enzymes: principles and biotechnological applications,” Essays Biochem, vol. 59, pp. 1–41, 2015, doi: 10.1042/bse0590001.
[2]. G. M. Cooper, “The Central Role of Enzymes as Biological Catalysts,” in The Cell: A Molecular Approach. 2nd edition, Sinauer Associates, 2000. Accessed: Nov. 04, 2023. [Online]. Available: https://www.ncbi.nlm.nih.gov/books/NBK9921/
[3]. “How enzyme promiscuity and horizontal gene transfer contribute to metabolic innovation - Glasner - 2020 - The FEBS Journal - Wiley Online Library.” Accessed: Nov. 04, 2023. [Online]. Available: https://febs.onlinelibrary.wiley.com/doi/full/10.1111/febs.15185
[4]. T. Lewis and W. L. Stone, “Biochemistry, Proteins Enzymes,” in StatPearls, Treasure Island (FL): StatPearls Publishing, 2023. Accessed: Nov. 04, 2023. [Online]. Available: http://www.ncbi.nlm.nih.gov/books/NBK554481/
[5]. “Purification and characterization of acid phosphatase from Macrotyloma uiflorum seeds - PMC.” Accessed: Nov. 06, 2023. [Online]. Available: https://www.ncbi.nlm.nih.gov/pmc/articles/PMC5756217/
[6]. V. R. Moorman and A. M. Brayton, “Identification of individual components of a commercial wheat germ acid phosphatase preparation,” PLoS One, vol. 16, no. 3, p. e0248717, 2021, doi: 10.1371/journal.pone.0248717.
[7]. G. M. Cooper, “Metabolic Energy,” in The Cell: A Molecular Approach. 2nd edition, Sinauer Associates, 2000. Accessed: Nov. 06, 2023. [Online]. Available: https://www.ncbi.nlm.nih.gov/books/NBK9903/
[8]. H. Bisswanger, “Enzyme assays,” Perspectives in Science, vol. 1, no. 1–6, pp. 41–55, May 2014, doi: 10.1016/j.pisc.2014.02.005.
[9]. “Enzyme Stability - an overview | ScienceDirect Topics.” Accessed: Nov. 15, 2023. [Online]. Available: https://www.sciencedirect.com/topics/biochemistry-genetics-and-molecular-biology/enzyme-stability
[10]. “Enzymes and the active site (article) | Khan Academy.” Accessed: Nov. 15, 2023. [Online]. Available: https://www.khanacademy.org/_render
[11]. “Enzyme Inhibitor - an overview | ScienceDirect Topics.” Accessed: Nov. 15, 2023. [Online]. Available: https://www.sciencedirect.com/topics/earth-and-planetary-sciences/enzyme-inhibitor
[12]. E. M. Nordwald and J. L. Kaar, “Stabilization of enzymes in ionic liquids via modification of enzyme charge,” Biotechnology and Bioengineering, vol. 110, no. 9, pp. 2352–2360, 2013, doi: 10.1002/bit.24910.
Cite this article
Gu,Y. (2024). The effect of buffer pH on enzyme activity. Theoretical and Natural Science,33,137-147.
Data availability
The datasets used and/or analyzed during the current study will be available from the authors upon reasonable request.
Disclaimer/Publisher's Note
The statements, opinions and data contained in all publications are solely those of the individual author(s) and contributor(s) and not of EWA Publishing and/or the editor(s). EWA Publishing and/or the editor(s) disclaim responsibility for any injury to people or property resulting from any ideas, methods, instructions or products referred to in the content.
About volume
Volume title: Proceedings of the 2nd International Conference on Modern Medicine and Global Health
© 2024 by the author(s). Licensee EWA Publishing, Oxford, UK. This article is an open access article distributed under the terms and
conditions of the Creative Commons Attribution (CC BY) license. Authors who
publish this series agree to the following terms:
1. Authors retain copyright and grant the series right of first publication with the work simultaneously licensed under a Creative Commons
Attribution License that allows others to share the work with an acknowledgment of the work's authorship and initial publication in this
series.
2. Authors are able to enter into separate, additional contractual arrangements for the non-exclusive distribution of the series's published
version of the work (e.g., post it to an institutional repository or publish it in a book), with an acknowledgment of its initial
publication in this series.
3. Authors are permitted and encouraged to post their work online (e.g., in institutional repositories or on their website) prior to and
during the submission process, as it can lead to productive exchanges, as well as earlier and greater citation of published work (See
Open access policy for details).
References
[1]. P. K. Robinson, “Enzymes: principles and biotechnological applications,” Essays Biochem, vol. 59, pp. 1–41, 2015, doi: 10.1042/bse0590001.
[2]. G. M. Cooper, “The Central Role of Enzymes as Biological Catalysts,” in The Cell: A Molecular Approach. 2nd edition, Sinauer Associates, 2000. Accessed: Nov. 04, 2023. [Online]. Available: https://www.ncbi.nlm.nih.gov/books/NBK9921/
[3]. “How enzyme promiscuity and horizontal gene transfer contribute to metabolic innovation - Glasner - 2020 - The FEBS Journal - Wiley Online Library.” Accessed: Nov. 04, 2023. [Online]. Available: https://febs.onlinelibrary.wiley.com/doi/full/10.1111/febs.15185
[4]. T. Lewis and W. L. Stone, “Biochemistry, Proteins Enzymes,” in StatPearls, Treasure Island (FL): StatPearls Publishing, 2023. Accessed: Nov. 04, 2023. [Online]. Available: http://www.ncbi.nlm.nih.gov/books/NBK554481/
[5]. “Purification and characterization of acid phosphatase from Macrotyloma uiflorum seeds - PMC.” Accessed: Nov. 06, 2023. [Online]. Available: https://www.ncbi.nlm.nih.gov/pmc/articles/PMC5756217/
[6]. V. R. Moorman and A. M. Brayton, “Identification of individual components of a commercial wheat germ acid phosphatase preparation,” PLoS One, vol. 16, no. 3, p. e0248717, 2021, doi: 10.1371/journal.pone.0248717.
[7]. G. M. Cooper, “Metabolic Energy,” in The Cell: A Molecular Approach. 2nd edition, Sinauer Associates, 2000. Accessed: Nov. 06, 2023. [Online]. Available: https://www.ncbi.nlm.nih.gov/books/NBK9903/
[8]. H. Bisswanger, “Enzyme assays,” Perspectives in Science, vol. 1, no. 1–6, pp. 41–55, May 2014, doi: 10.1016/j.pisc.2014.02.005.
[9]. “Enzyme Stability - an overview | ScienceDirect Topics.” Accessed: Nov. 15, 2023. [Online]. Available: https://www.sciencedirect.com/topics/biochemistry-genetics-and-molecular-biology/enzyme-stability
[10]. “Enzymes and the active site (article) | Khan Academy.” Accessed: Nov. 15, 2023. [Online]. Available: https://www.khanacademy.org/_render
[11]. “Enzyme Inhibitor - an overview | ScienceDirect Topics.” Accessed: Nov. 15, 2023. [Online]. Available: https://www.sciencedirect.com/topics/earth-and-planetary-sciences/enzyme-inhibitor
[12]. E. M. Nordwald and J. L. Kaar, “Stabilization of enzymes in ionic liquids via modification of enzyme charge,” Biotechnology and Bioengineering, vol. 110, no. 9, pp. 2352–2360, 2013, doi: 10.1002/bit.24910.