


1. Introduction
Horse racing is a captivating sport with a rich history that traces back centuries. It involves horses galloping around an oval track while guided by jockeys, with the goal of being the first to cross the finish line. This thrilling and fast-paced competition combines the raw power of horses with the tactical prowess of jockeys, making it a sport that enthralls millions of spectators and participants worldwide
Horse racing boasts a diverse array of forms, each characterized by its own set of rules and traditions. Thoroughbred racing, arguably the most prestigious, showcases the agility and speed of purebred Thoroughbred horses, with renowned events like the Kentucky Derby capturing the world’s attention. Harness racing introduces a unique twist as horses pull two-wheeled carts (sulkies) while jockeys guide them from behind, exemplified by races such as the Hambletonian Stakes. Quarter horse racing, featuring American Quarter Horses known for their explosive speed, is particularly popular in the United States and Mexico. Arabian racing, on the other hand, centers on purebred Arabian horses and often involves endurance races that test the animals’ stamina over extended distances. Each form of racing offers a distinctive experience for both participants and spectators.
At the heart of horse racing is the thrill of competition and the opportunity for spectators to immerse themselves in the action. Betting, an integral component, adds an extra layer of excitement as spectators analyze a horse’s track record, jockey expertise, and prevailing conditions to place wagers on their favorites. The racing calendar is marked by significant events and seasons, with major races attracting large crowds and avid attention. Horse ownership is also a prevalent aspect, with individuals and syndicates investing in the purchase, training, and care of horses, all in pursuit of glory on the racetrack. The finely tuned coordination between jockeys and their mounts is a marvel to witness, as these skilled athletes navigate the challenges of the racecourse, relying on split-second decisions that can determine victory or defeat. The sport’s integrity is maintained by rigorous horse health and care standards, with trainers, veterinarians, and support staff working tirelessly to ensure the well-being and peak physical condition of the equine competitors.
The weight of a horse in horse racing is a pivotal element influencing race outcomes. Handicapping ensures that each horse carries a weight corresponding to its ability, aiming for a level playing field. The distance and racing surface also play a role, with added weight having a more substantial impact on longer races and certain track types. This nuanced approach to weight assignment is crucial for maintaining fair competition and enhancing the excitement of horse racing. At the same time, different weight standards are also extremely important for racehorses. This factor is so important that equations [1] have been devised to determine the optimum horse weight for different track lengths.
2. Methodology
Collecting data for horse racing analysis is a critical first step. Kaggle.com [2] , a popular data science platform, often hosts datasets related to sports, including horse racing. Begin by selecting a relevant dataset with essential variables such as horse names, race results, weights, and jockey information. After downloading the dataset, pre-processing is essential. This involves addressing missing values, handling outliers, and ensuring data is formatted correctly. Proper data preparation sets the foundation for meaningful analysis.:
Once the data is ready, mathematical modelling using PyMC can begin [3]. Based on the methods and ideas in Bayesian Methods for Hackers [4], we can use Bayesian inference from a computational perspective. Prior to modelling, it’s crucial to explore the dataset through exploratory data analysis (EDA) using Python libraries like Pandas and Matplotlib. EDA helps uncover data distributions, correlations, and potential patterns. Feature engineering is the next step, where you create informative features that capture the relationship between horse weight and race outcomes. These features could include statistics like the average weight of winning horses or jockey success rates with horses of different weights. Then, leverage PyMC’s modeling capabilities, choosing an appropriate algorithm for the dataset’s characteristics and research question.
The core of the analysis revolves around Bernoulli’s analysis, aimed at understanding the connection between horse weight and race outcomes. To do this, frame a specific research question, such as whether heavier horses have a higher likelihood of winning races compared to lighter ones. Transform the data into a suitable format for Bernoulli analysis, where the outcome variable is binary (e.g., 1 for wins, 0 for losses), and the predictor variable is horse weight. Utilize statistical techniques like logistic regression to model the probability of a horse winning based on weight. Hypothesis tests can then determine the statistical significance of weight in predicting race outcomes. The model’s fit and performance can be assessed through log-likelihood, AIC, or BIC metrics.
Interpreting the results is a crucial step. Analyzing the coefficients generated by the logistic regression model to understand the direction and strength of the relationship between horse weight and winning probabilities. Visualization plays a significant role in conveying the findings effectively. Create visual representations, such as scatter plots or bar charts, illustrating the relationship between horse weight and the likelihood of winning. These visuals enhance the comprehension of the analysis and provide valuable insights into the data patterns.
Concluding the analysis involves drawing insights from the Bernoulli analysis results. The methodology and ideas are based on the book Statistics and Data Visualisation with Python, which brought the basis on how to conduct Bernoulli with Python [5]. Determine whether there is a statistically significant association between horse weight and race outcomes based on the model findings. Discuss the practical implications of these results, offering insights for horse racing enthusiasts, trainers, and bettors. Documenting the entire analysis process is essential. This documentation includes details about data sources, pre-processing steps, modeling choices, and the interpretation of results. It ensures transparency in the analysis and facilitates reproducibility, allowing others to understand and build upon the findings.
3. Analysis
During a horse race, there are many factors that can affect the outcome of the race. For example: the weight of the horse, the weight of the jockey, the breed of the horse, the skill of the jockey, and so on. The length of the race also makes a difference in the degree of influence these factors have on the outcome. This article focuses on the effect of horse weight on the results of different races.
The first consideration is a linear relationship, i.e. the horse’s weight is proportional to performance. However, when analyzing the data, we found it difficult to go and see that there was a proportional relationship between the two parameters.
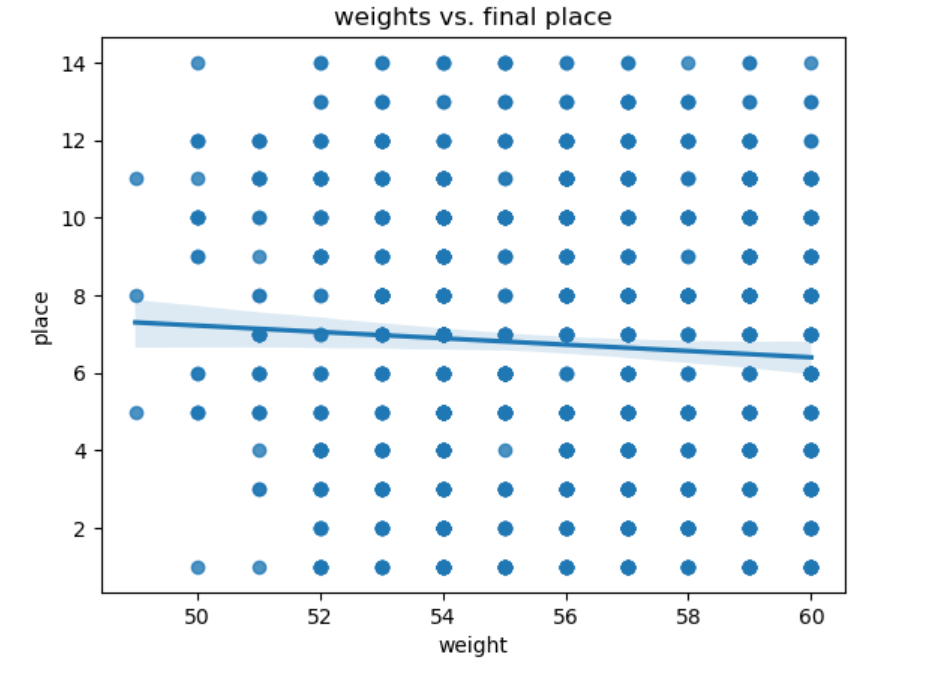
Figure1. Scatter plot between weight and final place of the horse.
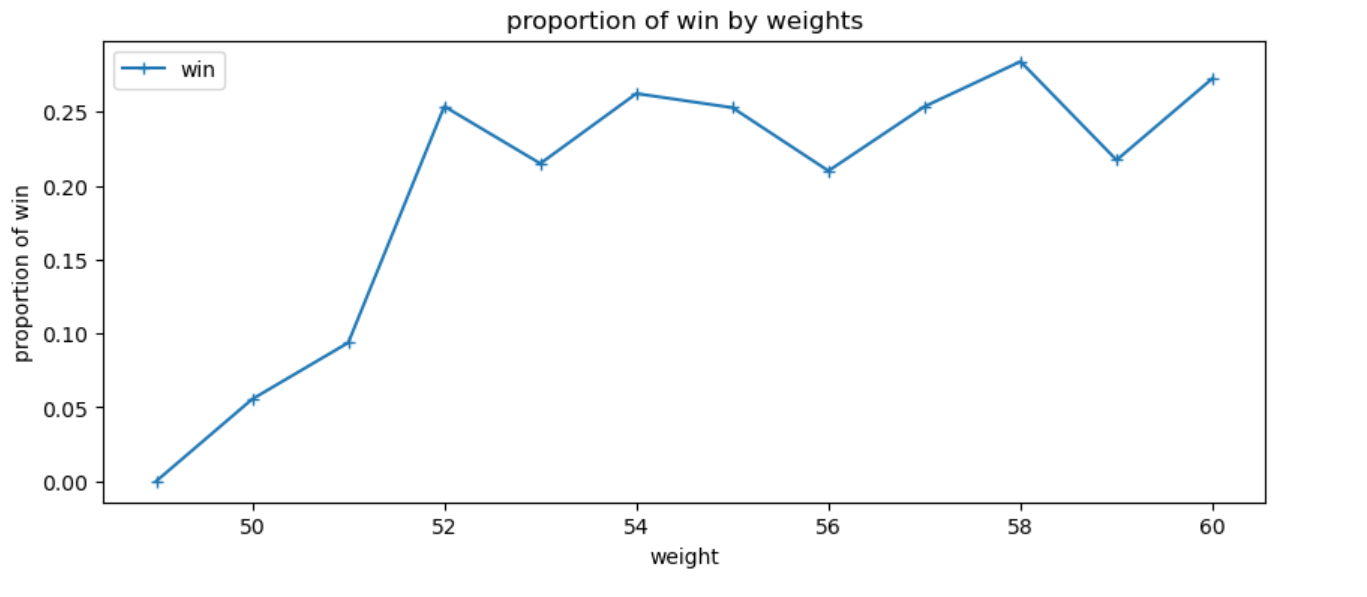
Figure 2. Line Chart between weight and proportion of win (final place ≤ 3)
From Figure 1, we are not able to conclude a linear relationship. Figure 2, on the other hand, gives a more intuitive picture of the relationship between the weight of the horse and winning (being able to get the first three places in a horse race): at weights less than 52, the two parameters show a more pronounced positive correlation, but as the weight increases, the parameters are no longer positively correlated with each other, and therefore we are not able to draw conclusions that prove that the weight of the horse and the results have a linear relationship.
4. Bernoulli Analysis
Since it is impossible to find the linear relationship between the final place of the game and the weight of the horse, we introduced the idea of Bernoulli analysis in order to find whether there is any connection between these two parameters.
By employing Bernoulli analysis, one can investigate whether the probability of a horse winning or achieving a certain rank in a race is influenced by its weight. The technique involves assessing a binary outcome, such as whether a horse’s final place is less than or equal to three (1) or doesn’t win (0), and then determining whether this outcome is associated with a particular predictor variable, in this case, the horse’s weight. Statistical methods like logistic regression or other models can be used to analyze the relationship.
Assuming that the change point (weights threshold) signifies a switch in the underlying Bernoulli process’s probability parameter, we define the prior for the change point and Bernoulli probabilities before and after it. Then we can make the estimation (shown in Table 1):
Table 1. The basic statistic stats of change point, before, and after
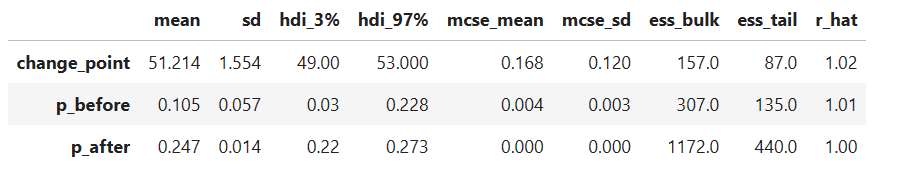
Based on the estimates, on average, the change point is 51.214, the p before change is 0.105, that is, the win probability is 0.105 if the weight is less than 51.214, in other case, the probability is 0.247. However, the intervals for two p are overlapped. Then comes with the trace (shown in Figure 3):
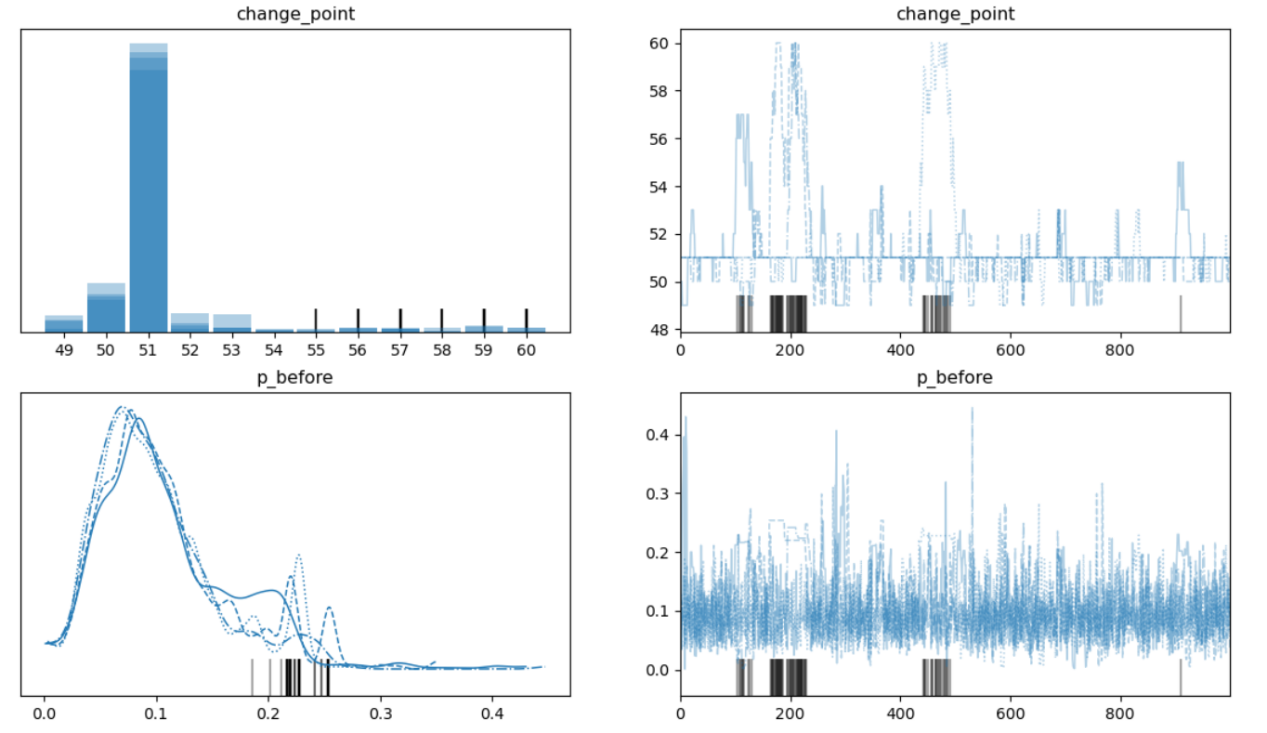
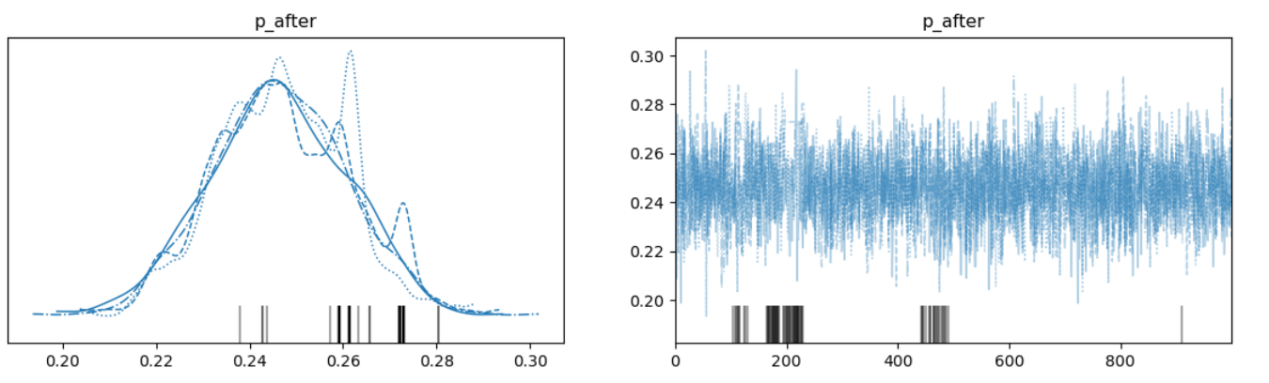
Figure 3. The graph of change point, P before, and P after
Based on the analysis of the Bernoulli distribution, we can get that when the horse’s weight is at 51 pounds (change point) the horse’s weight and the probability of being able to finish in the top three shifts. Also, the probability of winning shows a normal distribution.
5. Discussion
Employing Bernoulli analysis to predict the relationship between a horse’s final place in a race and its weight holds notable significance in the realm of horse racing analysis.
Firstly, Bernoulli analysis is tailored for examining binary or categorical outcomes, making it an ideal statistical method when dealing with horse race results. In the context of predicting a horse’s final place, these outcomes typically revolve around a binary win-or-lose scenario. Bernoulli analysis allows for the precise quantification of the probability of a horse winning based on its weight, offering a tangible and quantifiable measure of relevance.
Another significant advantage lies in hypothesis testing. Bernoulli analysis enables rigorous hypothesis testing to determine whether the observed relationship between horse weight and race results is statistically significant. By separating real patterns from random chance, this statistical approach instills confidence in the findings and ensures that any conclusions drawn are based on sound statistical grounds.
Furthermore, applying Bernoulli analysis periodically, with new data, allows for the tracking of changes in the relationship between horse weight and race performance. Horse racing is a dynamic sport, and factors influencing outcomes can evolve over time. Ongoing analysis ensures that stakeholders remain adaptable to changing conditions and trends.
Lastly, conducting Bernoulli analysis within the context of horse racing holds educational value. It offers an opportunity to educate stakeholders, enthusiasts, and the broader public about the intricacies of the sport. By quantifying the impact of variables like horse weight on race outcomes, Bernoulli’s analysis contributes to a deeper understanding of the sport, fostering a culture of informed and data-driven decision-making within the horse racing community.
6. Conclusion
This analysis can uncover whether weight plays a significant role in a horse’s success on the racetrack. It may reveal patterns that suggest that lighter or heavier horses have an advantage in certain types of races or under specific conditions. Ultimately, Bernoulli’s analysis offers a data-driven approach to understanding the complex interplay between variables in the world of horse racing, potentially leading to more accurate predictions and strategic decisions in the sport.
References
[1]. Mordin, Nick. Mordin on Time. Aesculus Press, 2003.
[2]. Horse Racing in HK. (n.d.). Horse Racing in HK | Kaggle. https:///datasets/gdaley/hkracing
[3]. Home. (n.d.). PyMC Project Website. https://www.pymc.io/welcome.html
[4]. Davidson-Pilon, Cameron. Bayesian Methods for Hackers: Probabilistic Programming and Bayesian Inference. Addison-Wesley, 2016.
[5]. Rogel-Salazar, Jesus. “Chapter 5.3.2.” Statistics and Data Visualisation with Python, CRC Press, Taylor & Francis Group, Boca Raton, 2023.
Cite this article
Zhang,Y. (2024). Using Bernoulli analysis in horse racing game. Theoretical and Natural Science,31,133-138.
Data availability
The datasets used and/or analyzed during the current study will be available from the authors upon reasonable request.
Disclaimer/Publisher's Note
The statements, opinions and data contained in all publications are solely those of the individual author(s) and contributor(s) and not of EWA Publishing and/or the editor(s). EWA Publishing and/or the editor(s) disclaim responsibility for any injury to people or property resulting from any ideas, methods, instructions or products referred to in the content.
About volume
Volume title: Proceedings of the 3rd International Conference on Computing Innovation and Applied Physics
© 2024 by the author(s). Licensee EWA Publishing, Oxford, UK. This article is an open access article distributed under the terms and
conditions of the Creative Commons Attribution (CC BY) license. Authors who
publish this series agree to the following terms:
1. Authors retain copyright and grant the series right of first publication with the work simultaneously licensed under a Creative Commons
Attribution License that allows others to share the work with an acknowledgment of the work's authorship and initial publication in this
series.
2. Authors are able to enter into separate, additional contractual arrangements for the non-exclusive distribution of the series's published
version of the work (e.g., post it to an institutional repository or publish it in a book), with an acknowledgment of its initial
publication in this series.
3. Authors are permitted and encouraged to post their work online (e.g., in institutional repositories or on their website) prior to and
during the submission process, as it can lead to productive exchanges, as well as earlier and greater citation of published work (See
Open access policy for details).
References
[1]. Mordin, Nick. Mordin on Time. Aesculus Press, 2003.
[2]. Horse Racing in HK. (n.d.). Horse Racing in HK | Kaggle. https:///datasets/gdaley/hkracing
[3]. Home. (n.d.). PyMC Project Website. https://www.pymc.io/welcome.html
[4]. Davidson-Pilon, Cameron. Bayesian Methods for Hackers: Probabilistic Programming and Bayesian Inference. Addison-Wesley, 2016.
[5]. Rogel-Salazar, Jesus. “Chapter 5.3.2.” Statistics and Data Visualisation with Python, CRC Press, Taylor & Francis Group, Boca Raton, 2023.