


1. Introduction
In today’s global travel landscape, understanding international flight prices has become essential. This study delves into the factors influencing flight costs, driven by traveller demands and airline strategies. Airlines nowadays implement sophisticated strategies, dynamically adjusting airfare prices based on a multitude of factors such as economic conditions, marketing trends, commercial considerations, and societal influences [1]. These factors intricately intertwine to dictate the final cost of an airline ticket. Such a complex pricing model contributes to the fluctuating nature of ticket prices, making it quite challenging for customers to secure air tickets at the most affordable rates. Thus, the dynamic variability and intricate policies create a landscape where finding the lowest possible price becomes a formidable task for air travellers [2].
This research relies on a dataset from Kaggle, extracted from “Ease My Trip” between February 11th and March 31st, 2022. With over 300,000 flight options, it includes details like airline, flight number, cities, cabin class, duration, and price. This data forms the basis for this analysis and predictions.
This study begins with meticulous data preprocessing, addressing missing values and converting textual data into machine-readable formats. Using Python and libraries like Pandas and Seaborn, this paper analyzed the dataset. Statistical tools uncover correlations, and machine learning algorithms (Linear Regression, Decision Trees, and Random Forest) drive this predictions. Through precise data handling, this study aims to decode existing trends and forecast future flight prices [3-4].
This research blends empirical analysis and advanced computational methods to offer practical insights. It empowers travellers to make informed decisions, potentially saving money, and aids airlines in strategic pricing for profitability. This study serves as a bridge between theory and practice, enabling affordable and profitable international air travel.
2. Data Source and Description
Data gathering is pivotal for this project. Numerous websites serve as repositories of information that aid in training the models. These sites provide details about various routes, schedules, airline options, and ticket prices [5]. The dataset under scrutiny in this research is sourced from Kaggle and is titled “Flight Price Prediction.” Originating from the “Ease My Trip” website, a prominent online platform for booking flight tickets, this dataset encapsulates a plethora of flight booking options collected over 50 days, spanning from February 11th to March 31st, 2022. Distinguished into economy class and business class tickets, it comprises a total of 300,261 distinct flight booking options. These options are defined by 11 vital features: Airline, Flight, Source City, Departure Time, Stops, Arrival Time, Destination City, Class, Duration, Days Left, and Price.
2.1. Data Processing Steps and Performance Metrics
Handling Missing Values: By employing the “df. isnull().sum()” function, columns with missing values were identified and addressed, ensuring data integrity. Appropriate strategies such as data imputation or exclusion were employed, ensuring the dataset’s reliability.
Obtaining Unique Values: Extracting unique values from specific columns provided valuable insights into airlines, flights, departure cities, times, stop counts, arrival times, destination cities, and seat classes. This exploration enhanced the understanding of data diversity, laying the foundation for subsequent analyses.
Label Encoding: Textual data was transformed into numerical representations using LabelEncoder, rendering the dataset interpretable for machine learning algorithms. This transformation preserved essential features while making the data machine-readable.
2.2. Performance Metrics
Performance metrics are statistical measures designed to evaluate the precision of machine learning models developed from various algorithms. The sklearn.metrics module provides functions that assess errors in each model using regression metrics. Several metrics will be applied to determine the accuracy and error rate of each model [6].
MAE stands for Mean Absolute Error. It is a metric used to measure the accuracy of continuous predictions in regression models. In simple terms, MAE provides the average magnitude of errors between predicted and actual observations. Given by:
\( MAE=1/n[∑(y-ý)]\ \ \ (1) \)
Where:
y represents the true values,
ý denotes the estimated values, and
n is the total count of data instances.
A smaller MAE indicates enhanced model efficiency.
The result is a non-negative value, where a smaller MAE suggests a better fit of the model to the data. It is intuitively understood as the average error made by the model in its predictions.
“Accuracy” is a prevalent metric employed to evaluate a classification model’s efficacy. It denotes the proportion of predictions the model gets right out of all its predictions. The computation for accuracy is given by:
\( Accuracy=\frac{Number of Correct Predictions}{Total Number of Predictions}\ \ \ (2) \)
Number of Correct Predictions = The samples that the model accurately predicts in the test dataset
Total Number of Predictions = The total samples predicted by the model on the test dataset.
Accuracy serves as an instinctive performance measure, typically expressed in percentage form. This metric illustrates the extent to which the independent variable aligns with the variance in the model.
\( R²=1-\frac{[∑(ý-y̅)²]}{[∑(y-y̅)²]}\ \ \ (3) \)
R² values range from 0 to 1. A value approaching one indicates a stronger performance of the model in comparison to others.
3. Analysis of Factors Affecting International Flight Prices
3.1. Results Presentation: Revealing Data Relationships
In this paper, the author extensively utilized Python with Pandas and Seaborn libraries. This paper employed the ‘corr()’ function from Pandas to compute correlation coefficients between numerical columns, indicating relationships (Values can range from -1 to 1: -1 denotes an ideal negative relationship, 1 implies an impeccable positive relationship, and 0 indicates the absence of correlation.). The ‘heatmap()’ function from Seaborn was then used to visualize these coefficients. A heatmap is a data visualization technique commonly used to display relative values within a matrix or table. It represents the cells’ values using colors, indicating their intensity or magnitude. This visualization method helps to comprehend complex data structures by showing the density of data or the magnitude of values. In a heatmap, each cell’s data is mapped to a color, typically following a color spectrum (e.g., a gradient from light to dark). Larger values are usually represented with darker colors, while smaller values are depicted with lighter shades. This color coding allows observers to intuitively identify patterns, trends, and anomalies within the data.
3.2. Analysis
As shown in the figure 1, this paper observed a remarkably strong correlation of -0.94 between “class” (cabin class) and prices. As the cabin class increases, ticket prices significantly change. This indicates that higher-level cabin classes are typically associated with higher prices, possibly due to increased demand or the necessity to balance market demand through pricing adjustments. This finding provides essential pricing strategy recommendations for airlines, enabling them to adjust prices based on the demand for various cabin classes to optimize revenue.
Additionally, several other factors exerted notable impacts on ticket prices. For instance, the correlation coefficient for “flight” (flight number) was 0.3, indicating a positive correlation between flight numbers and prices. This could be due to specific flights being favored by more passengers, leading to price increases. Similarly, the correlation coefficient for “airline” was 0.24, suggesting a positive correlation between airlines and prices. Renowned airlines offering higher-quality services might result in relatively higher prices. Furthermore, the correlation coefficient for “duration” (flight duration) was 0.2, indicating a positive correlation between flight duration and prices. Longer flight durations typically require more resources and fuel, leading to price increases. These insights shed light on the intricate dynamics influencing international flight prices and offer valuable guidance for pricing strategies within the aviation industry.
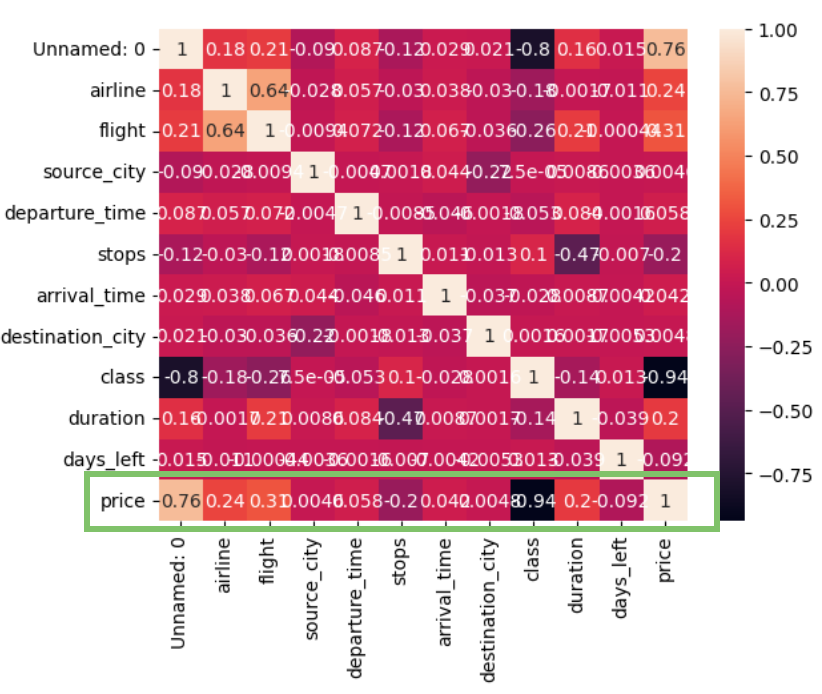
Figure 1. Correlation heat map
4. International Flight Fare Prediction
4.1. Analyzing and Predicting International Flight Prices Based on Linear Regression Models
4.1.1. Model Introduction. Linear regression is a foundational technique in both statistics and machine learning. It aims to decipher the relationship between a target variable and one or more predictors. Using a single predictor, simple linear regression can forecast an outcome. This predictive method identifies the straight-line relationship between input attributes (predictors) and the resulting output [7].
The fundamental assumption of linear regression is the existence of a linear bond between predictors and the target outcome. When reduced to a single predictor scenario, the relationship can be described by the formula:
\( Y=mx+b\ \ \ (4) \)
Where:
• Y represents the target variable,
• x stands for the predictor,
• m denotes the line’s gradient, illustrating the bond between x and Y,
• b is the y-intercept, which is Y’s value when x equals zero.
4.1.2. Analysis of Results. As shown in table 1, the accuracy of the training set is approximately 90.46%. This means the model explains 90.46% of the variance in the training data. The accuracy on the test set, around 90.48%, is very close to the training set accuracy. This indicates that the model generalizes well to new data and does not suffer from overfitting. The MAE is 4621.92, suggesting that, on average, the model’s predictions deviate by approximately 4621.92 from the actual values. A lower MAE indicates a smaller prediction error.
The R^2 value, about 0.905, indicates that the model can explain approximately 90.5% of the variance in the target variable. This is a quite good result, indicating a high level of fit between the model and the data.
Table 1. Prediction result based on Linear Regression
Linear Regression | |
Train Accuracy | 0.904567255050706 |
Accuracy | 0.9047836263477069 |
MAE | 4621.918880696914 |
R² | 0.9047836263477069 |
4.2. Analyzing and Predicting International Flight Prices Based on Decision Trees
4.2.1. Model Introduction. In machine learning for airfare pricing prediction, two methodologies are prevalent. One considers it a regression issue, focusing on predicting continuous ticket prices. Alternatively, it can be viewed as a classification task, categorizing airfares into different levels or groups [8-9].
Decision tree is the second one. At its core, a decision tree is a predictive modeling approach that recursively splits the dataset into subsets, making decisions based on the features that best separate the data points. These decisions are made to minimize a certain criterion, commonly the Gini impurity for classification problems or mean squared error for regression tasks. This recursive partitioning process continues until a stopping condition is met, resulting in a tree-like model that captures intricate patterns within the data.
4.2.2. Analysis of Results. As shown in table 2, the training set accuracy is approximately 99.99%, suggesting an almost perfect fit to the training data. However, this extremely high accuracy might indicate overfitting, where the model fits the training data too closely.
The accuracy on the test set is around 98.26%. Although slightly lower than the training set accuracy, it is still very high.
The MAE is 905.56, indicating that, on average, the model’s predictions deviate by approximately 905.56 from the actual values. While this is a relatively small error considering the scale of the target variable, it’s higher than the MAE of the linear regression model. It suggests that the Decision Tree model has a slightly larger prediction error than the linear regression model.
The R^2 value is about 0.983, indicating that the model can explain approximately 98.3% of the variance in the target variable. This is an excellent result, highlighting the high quality of the model’s fit to the data.
Table 2. Prediction result based on Decision Tree
Decision Tree | |
Train Accuracy | 0.9999046234032417 |
Accuracy | 0.9825645660542592 |
MAE | 905.5586472811917 |
R² | 0.9825645660542592 |
4.3. Analyzing and Predicting International Flight Prices Based on Random Forest
4.3.1. Model Introduction. A Random Forest is a collective method capable of addressing both regression and classification challenges concurrently. It amalgamates multiple decision trees through techniques like Bootstrap, Aggregation, and bagging [10-11]. It goes beyond individual decision trees. Instead of relying on a single tree, Random Forest combines multiple trees to enhance prediction accuracy and reliability. This technique harnesses the principle of collective wisdom, aggregating predictions from various models to mitigate overfitting and boost overall predictive power.
4.3.2. Analysis of Results. As shown in Table 3, the training set accuracy is approximately 99.84%, indicating that the model explains 99.84% of the variance in the training data.
The test set accuracy is around 98.89%, suggesting that the model performs remarkably well on new data, explaining almost 99% of the variance. This high accuracy indicates that the model effectively captures patterns in the data.
The MAE is 888.96, meaning that, on average, the model’s predictions deviate by approximately 888.96 from the actual values. Compared to the previous Decision Tree model, the Random Forest model has a smaller error, indicating a stronger predictive ability.
The R^2 value is about 0.989, indicating that the model can explain approximately 98.9% of the variance in the target variable. This result is excellent, indicating that the Random Forest model fits the data very well and has a high explanatory power for the target variable.
Table 3. Prediction result based on Random Forest
Random forest | |
Train Accuracy | 0.9984213358866272 |
Accuracy | 0.9889004273503582 |
MAE | 888.9628887558364 |
R² | 0.9889004273503582 |
5. Conclusion
This paper commenced with meticulous data preprocessing, addressing missing values and transforming textual data into machine-readable formats. Through innovative statistical analyses and the power of machine learning algorithms, including Linear Regression, Decision Trees, and Random Forest, this paper uncovered intricate correlations among various factors. The study reveals a strong negative correlation (-0.94) between cabin class and prices, indicating higher-class tickets are pricier, likely due to increased demand. Flight numbers (0.3), airline reputation (0.24), and longer durations (0.2) also impact prices. These insights provide crucial airline pricing strategies, allowing adjustments based on various factors to optimize revenue.
The predictive models this paper employed, particularly the Random Forest model, showcased exceptional accuracy, empowering travellers with reliable foresight and assisting airlines in optimizing revenue streams. The harmony of theoretical insights and practical applications in this study not only enhances transparency for consumers but also equips airlines with the tools necessary to navigate the competitive market terrain.
The study conducted in this paper utilized a static approach, implying that the model leveraged historical flight data to understand flight operation patterns. The benefits of this static method include straightforward data acquisition and uncomplicated modeling. Static research has its drawbacks, which are that the chosen influencing factors can change over time. If historical data cannot be updated, it becomes challenging to accurately depict the patterns of flight operations. For instance, during global events like the COVID-19 pandemic, flight frequencies decrease significantly, leading to minimal fluctuations in flight operations. Using the model proposed in this paper to predict flight operations under such circumstances is unscientific. To address this issue and enable the model to adapt to evolving flight operation dynamics, incorporating the latest flight operation data into the training set while removing outdated historical data is essential. This approach allows the training set to be dynamically updated, providing the model with current information to make accurate predictions.
References
[1]. Fadhil, H. M. Abdullah, M. N. Younis, M. I. 2022, A Framework for Predicting Airfare Prices Using Machine Learning, (Iraqi Journal of Computers, Communications, Control & Systems Engineering, vol. 22), no. 3.
[2]. Salehin, I. Islam, M. S. Saha, P. Noman, S. M. Tuni, A. Hasan, M. M. Baten, M. A. AutoML: A Systematic Review on Automated Machine Learning with Neural Architecture Search. (Journal of Information and Intelligence).
[3]. Zhou, H. Li, W. Jiang, Z. Cai, F. Xue, Y. 2022, Flight Departure Time Prediction Based on Deep Learning. (Aerospace, vol. 9), pp. 394.
[4]. Ntemi, M. Kotropoulos, C. 2020, A dynamic dyadic particle filter for price prediction. (Signal Processing, vol. 167), pp. 107334.
[5]. Rajankar, S. Sakharkar, N. 2019, A Survey on Flight Pricing Prediction Using Machine Learning. (International Journal of Engineering Research & Technology vol. 8), no. 6.
[6]. Brueckner, J. K. Zhang, Y. 2001, A Model of Scheduling in Airline Networks: How a Hub-and-Soke System Affects Flight Frequency, Fares, and Welfare. (Journal of Transport Economics and Policy, vol. 35), no. 2, pp. 195-222.
[7]. Kimbhaune, V. Donga, H. Trivedi, A. Mahajan, S. Mahajan, V. 2021, Flight Fare Prediction System. (EasyChair Preprint), no. 5542.
[8]. James, G., Witten, D., Hastie, T., & Tibshirani, R. 2021. An Introduction to Statistical Learning. Springer.
[9]. Biswas, P. Chakraborty, R. Mallik, T. Chakraborty, R. Uddin, S. I. Saha, S. Das, P. Mitra, S. 2022, Flight Price Prediction: A Case Study. (International Journal for Research in Applied Science & Engineering Technology), pp. 10.
[10]. Tziridis, K. Kalampokas, Th. Papakostas, G. A. Diamantaras, K. I. 2017, Airfare Prices Prediction Using Machine Learning Techniques. (EUSIPCO).
[11]. Degife, W. A. Lin, B.-S. 2023, Deep-Learning-Powered GRU Model for Flight Ticket Fare Forecasting. (Applied Sciences, vol. 13), no. 6032.
Cite this article
Deng,T. (2024). International flight fare prediction and analysis of factors impacting flight fare. Theoretical and Natural Science,31,329-335.
Data availability
The datasets used and/or analyzed during the current study will be available from the authors upon reasonable request.
Disclaimer/Publisher's Note
The statements, opinions and data contained in all publications are solely those of the individual author(s) and contributor(s) and not of EWA Publishing and/or the editor(s). EWA Publishing and/or the editor(s) disclaim responsibility for any injury to people or property resulting from any ideas, methods, instructions or products referred to in the content.
About volume
Volume title: Proceedings of the 3rd International Conference on Computing Innovation and Applied Physics
© 2024 by the author(s). Licensee EWA Publishing, Oxford, UK. This article is an open access article distributed under the terms and
conditions of the Creative Commons Attribution (CC BY) license. Authors who
publish this series agree to the following terms:
1. Authors retain copyright and grant the series right of first publication with the work simultaneously licensed under a Creative Commons
Attribution License that allows others to share the work with an acknowledgment of the work's authorship and initial publication in this
series.
2. Authors are able to enter into separate, additional contractual arrangements for the non-exclusive distribution of the series's published
version of the work (e.g., post it to an institutional repository or publish it in a book), with an acknowledgment of its initial
publication in this series.
3. Authors are permitted and encouraged to post their work online (e.g., in institutional repositories or on their website) prior to and
during the submission process, as it can lead to productive exchanges, as well as earlier and greater citation of published work (See
Open access policy for details).
References
[1]. Fadhil, H. M. Abdullah, M. N. Younis, M. I. 2022, A Framework for Predicting Airfare Prices Using Machine Learning, (Iraqi Journal of Computers, Communications, Control & Systems Engineering, vol. 22), no. 3.
[2]. Salehin, I. Islam, M. S. Saha, P. Noman, S. M. Tuni, A. Hasan, M. M. Baten, M. A. AutoML: A Systematic Review on Automated Machine Learning with Neural Architecture Search. (Journal of Information and Intelligence).
[3]. Zhou, H. Li, W. Jiang, Z. Cai, F. Xue, Y. 2022, Flight Departure Time Prediction Based on Deep Learning. (Aerospace, vol. 9), pp. 394.
[4]. Ntemi, M. Kotropoulos, C. 2020, A dynamic dyadic particle filter for price prediction. (Signal Processing, vol. 167), pp. 107334.
[5]. Rajankar, S. Sakharkar, N. 2019, A Survey on Flight Pricing Prediction Using Machine Learning. (International Journal of Engineering Research & Technology vol. 8), no. 6.
[6]. Brueckner, J. K. Zhang, Y. 2001, A Model of Scheduling in Airline Networks: How a Hub-and-Soke System Affects Flight Frequency, Fares, and Welfare. (Journal of Transport Economics and Policy, vol. 35), no. 2, pp. 195-222.
[7]. Kimbhaune, V. Donga, H. Trivedi, A. Mahajan, S. Mahajan, V. 2021, Flight Fare Prediction System. (EasyChair Preprint), no. 5542.
[8]. James, G., Witten, D., Hastie, T., & Tibshirani, R. 2021. An Introduction to Statistical Learning. Springer.
[9]. Biswas, P. Chakraborty, R. Mallik, T. Chakraborty, R. Uddin, S. I. Saha, S. Das, P. Mitra, S. 2022, Flight Price Prediction: A Case Study. (International Journal for Research in Applied Science & Engineering Technology), pp. 10.
[10]. Tziridis, K. Kalampokas, Th. Papakostas, G. A. Diamantaras, K. I. 2017, Airfare Prices Prediction Using Machine Learning Techniques. (EUSIPCO).
[11]. Degife, W. A. Lin, B.-S. 2023, Deep-Learning-Powered GRU Model for Flight Ticket Fare Forecasting. (Applied Sciences, vol. 13), no. 6032.