


1. Introduction
Recently, there has been a concerning global trend in breast cancer diagnoses, showing a shift toward younger demographics. This poses a significant threat to the well-being and lives of women. As breast cancer occurs at lower ages, the emphasis on early diagnosis and prompt treatment becomes notably critical. The rise in breast cancer among young women might be attributed to shifts in lifestyle, environmental influences, genetic predispositions, or other factors that are yet to be fully understood [1]. This trend means that more sensitive and accurate screening and diagnostic tools are needed to meet the challenge of early-onset breast cancer. Digital breast tomosynthesis (DBT), an advanced medical imaging technique that provides clearer and more informative images of the breast, potentially facilitating earlier cancer detection in younger women. Therefore, it is particularly urgent to enhance early diagnosis and treatment in response to the trend of low and young age of breast cancer. DBT is now internationally recognized as the newest and most accurate screening technology for detecting breast cancer [1]. The application of DBT instrumentation is becoming popular, but theoretical studies on its current advantages and future sustainable development are still lacking. The purpose of this study is to combine the existing advantages of DBT instrument, to address its shortcomings, and to analyze the reconstruction of 2D images from DBT 3D datasets, and the direction of sustainable development of DBT fusion deep learning.
2. Introduction to DBT Instruments
Digital Breast Tomosynthesis (DBT) is a three-dimensional imaging technique that reconstructs separate images into a series of high-resolution tomosynthesis images after briefly scanning the breast at multiple angles. DBT devices utilize digital imaging and three-dimensional tomosynthesis technology, integrating components such as an X-ray generator, detector, data acquisition system, three-dimensional imaging system, and a monitor operating system. Breast imaging systems from different companies have their own unique features and functions. For example, Hologic's 3Dimensions system is claimed to be able to improve breast cancer detection rates by 20% to 65%, which means it has a significant advantage in detecting potentially cancerous lesions. The uMammo890i system from UNITED IMAGING claims to reduce radiation doses by up to 41%, which is an extremely important safety advantage for patients. Despite the differences in functionality, there may be no significant outward differences between these systems as far as appearance is concerned. However, despite the similarity in appearance, the differences in technology, performance, and functionality of different systems can have significant implications for medical practices and patients. The varying performance of these systems may have a direct impact on the accuracy and safety of breast cancer screening and the ability to detect lesions. Therefore, it is critical for healthcare professionals and patients to have a more in-depth understanding and evaluation of the functionality and performance of these systems. Figure 1 is exterior views of the 3Dimensions from Hologic and the uMammo890i from UNITED IMAGING.
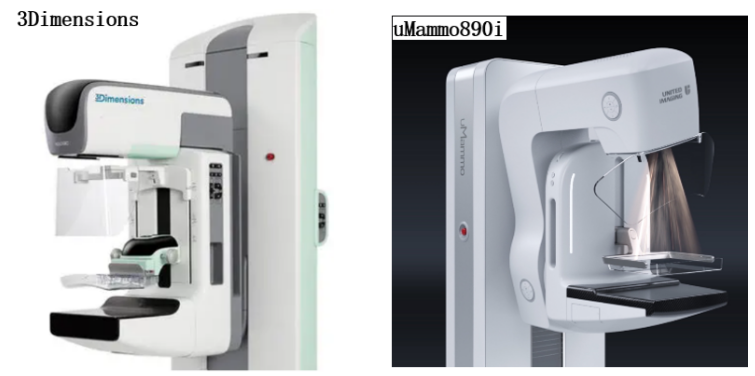
Figure 1. Appearance image of 3Dimensions and uMammo890i
Taking Hologic's 3Dimensions as an example, the device is equipped with a direct digitizing detector, high detective quantum efficiency (DQE), rapid read refresh performance, and HTC high permeability honeycomb filter grid technology, along with a tungsten target combined with rhodium- and silver-filtered bulb tube technology [2]. This amalgamation allows for the detection of 20%-65% more invasive breast cancers compared to traditional two-dimensional mammography, offering greater accuracy in diagnosis.The internal frame of the rack and the internal structure of the bulb tube are shown in Figure 2. The motor power is supplied by the motor control board (assy-1003-0383 rev) plug-in DC90V DC, and a DC capacitor is connected in parallel at both ends of the plug-in [3]. The control board plug-ins WJ3 and WJ1 are supplied to control the up and down and rotary motors respectively. Power control board (assy-1003-0341 rev) plug-in ACJ7 supply plug-in WJ6, plug-in ACP15 supply plug-in ACJ7, plug-in ACJ11 supply plug-in ACP15, rotating anode (assy-1003 -0483 rev) plug-in WJ6, plug-in ACP15, rotating anode (assy-1003 -0483 rev) plug-in ACJ7, plug-in ACJ11, rotating anode (assy-1003) The rotary anode plate plug-in AYJ11 outputs 90V to the power distribution board (assy-1003-0336 rev) plug-in AYJ10, and the power distribution board plug-in MJ1 inputs 90V power to the bulb tube rotary anode. 90V is supplied to the ball tube rotary anode by the power distribution board plug-in MJ1.
DBT, the preferred method for early breast lesion screening, enhances lesion visibility over conventional techniques, particularly boosting sensitivity in detecting invasive cancer [4]. It also improves sensitivity for microcalcifications around breast masses, reduces recalls, and proves more effective in detecting dense glands in Asian women.

Figure 2. Internal structure of the rack and Internal structure of X-ray tube
3. Analysis of the Pros and Cons of DBT
3.1. Advantages of DBT Technology
DBT offers significant advantages over conventional breast imaging techniques. Studies have shown that the use of digital mammography (FFDM) in combination with DBT can dramatically increase the detection rate of breast cancer and significantly reduce the recall rate. According to Friedewald et al. [5], the combination of DBT techniques increased cancer detection from 27% to 91%, an overall increase of 29%. Especially in dense breast tissue, the application of DBT technique resulted in a more significant cancer detection rate. Several DBT studies demonstrate its lower recall rate, but when paired with FFDM, specificity improves, reducing the recall rate by 15% to 63%. In dense breast tissue, DBT outperforms FFDM, enabling better detection of calcifications and reducing tissue obstruction, ultimately enhancing detection rates. Figure 3 demonstrates a comparison between FFDM and DBT detection images, highlighting the greater clarity and informativeness of DBT in breast imaging. This combined use of images shows a clearer and more accurate view of the breast anatomy, helping physicians to more accurately diagnose potential abnormalities.

Figure 3. Images from clinical application of UNITED IMAGING
Ultrasound combined with DBT enhances the diagnostic effectiveness of breast lesions when compared to either ultrasound or DBT alone. The study analyzed 1065 patients with three diagnostic modalities: DBT, ultrasound, and DBT combined with ultrasound, and analyzed differences in the distribution of breast lesion diagnoses using the BI-RADS classification diagnosis. According to the study records, the distribution of breast BI-RADS for the three diagnostic modalities (Table 1 [6]) showed different trends. The BI-RADS classification grade reflects the chance of developing cancer in the breast, and among the three diagnostic modalities, DBT combined with ultrasound diagnosis had the highest rate of grade 5 diagnosis. This suggests that ultrasonography combined with DBT improves the detection of high-risk lesions compared with ultrasound alone. Combining DBT with ultrasound improves lesion diagnosis, especially for high-risk cases, potentially boosting cancer detection rates. This combined approach enhances early breast cancer accuracy for physicians, offering a more comprehensive diagnostic basis.
Table 1. BI-RADS classification in 3 diagnostic models [cases (%)]
BI-RADS grad | DBT | Ultrasound | DBT+Ultrasound |
0 | 28(2.63) | 2(0.19) | 1(0.09) |
1 | 4(0.38) | 21(1.97) | 4(0.38) |
2 | 481(45.16) | 310(29.11) | 443(41.60) |
3 | 213(20.00) | 388(36.43) | 268(25.16) |
4A | 97(9.11) | 178(16.71) | 117(10.99) |
4B | 134(12.58) | 93(8.73) | 123(11.55) |
4C | 54(5.07) | 38(3.57) | 50(4.69) |
5 | 54(5.07) | 35(3.29) | 59(5.53) |
Total | 1065(100) | 1065(100) | 1065(100) |
The diagnostic results were compared with the pathological results as shown in Table 2, and the diagnostic results of the three modes were statistically analyzed by applying the Kruskal-Wallis rank sum test using SPSS software, and the ROC curves of the three diagnostic modes were constructed using pathological diagnosis as a criterion. In diagnosing breast lesions, the area under the curve (AUC) of the DBT diagnostic curve was 0.923 with a 95% CI of 0.890 to 0.956, with a sensitivity of 77.9% and a specificity of 98.1%; the AUC of the ultrasound diagnostic curve was 0.868 with a 95% CI of 0.823 to 0.912, with a sensitivity of 82.0% and a specificity of 82.9%; and the AUC of DBT combined with Ultrasound diagnostic AUC was 0.964, 95% CI 0.942 to 0.985, sensitivity 82.0% and specificity 99.5% [6]. Sensitivity gauges a diagnostic method's accuracy in correctly identifying individuals with the disease, while specificity measures its accuracy in correctly excluding individuals without the disease. High sensitivity ensures accurate identification of those with the disease, while high specificity ensures effective exclusion of those without it, minimizing both misdiagnosis and underdiagnosis. Therefore, the diagnostic modality that combines DBT with ultrasound has higher AUC value, higher sensitivity and specificity. The fusion of DBT and ultrasound results in superior overall diagnostic effectiveness for breast lesions, enabling more precise detection of breast irregularities. This advancement aids in the early and accurate detection and diagnosis of breast cancer.
Table 2. Comparison of diagnostic results and pathological results of 3 diagnostic models [cases (%)]
Diagnostic model | Diagnosis result | Pathological result | Total | Χ2 value | P value | |
Malignant | Benign | |||||
DBT | Malignant | 95(77.9) | 4(1.9) | 99(29.7) | 213.577 | <0.05 |
Benign | 27(22.1) | 207(98.1) | 234(70.0) | |||
Total | 122(100.0) | 211(100.0) | 333(100.0) | |||
Ultrasound | Malignant | 100(82.0) | 36(17.1) | 136(40.8) | 134.786 | <0.05 |
Benign | 22(18.0) | 175(82.9) | 197(59.2) | |||
Total | 122(100.0) | 211(100.0) | 333(100.0) | |||
DBT+Ultrasound | Malignant | 100(82.0) | 1(0.5) | 101(30.3) | 242.952 | <0.05 |
Benign | 22(18.0) | 210(99.5) | 232(69.7) | |||
Total | 122(100.0) | 211(100.0) | 333(100.0) | |||
Based on the results of the ROC curve analysis obtained in the study [6], it was observed that the AUC value for the diagnosis of breast malignancy in the combination of DBT and ultrasound (0.964) was greater than the AUC values for the use of DBT and ultrasound separately (0.923, 0.868). In addition, the specificity of the optimal cut-off point for the combination of DBT and ultrasound (99.5%) was also higher than the specificity of the optimal cut-off point for the use of DBT and ultrasound alone (98.1%, 82.9%). Moreover, the results of the study showed P<0.001, which indicates that there is a statistically significant difference in the specificity of the results of the combination of DBT and ultrasound for diagnosis.
As can be seen from the data and graphical results in Tables 1 and 2, the efficacy of the combination of DBT and ultrasound for diagnosis was superior to that of ultrasound alone or DBT alone, both in terms of sensitivity and specificity. In particular, the diagnostic efficacy of the combination of DBT was significantly higher compared to that of ultrasound alone. This implies that the use of digital breast tomosynthesis (DBT) can play a positive role in improving the diagnostic efficacy of conventional breast screening techniques, especially when combined with ultrasound. This combination of diagnostic modalities has significant advantages in improving the accuracy of breast tumor detection and reducing the rate of missed and misdiagnosed tumors.
3.2. Analysis of existing limitations of DBT
DBT technology is now more widely used for breast screening, however, there are still limitations. The 2020 ECIBC Breast Cancer Screening Initiative Guidelines state that considering cost is crucial when contemplating DBT adoption. The high expenses associated with DBT instruments have hindered certain hospitals from implementing this new technology.Another mandatory consideration is radiation dose. DBT diminishes breast tissue overlap and enhances diagnostic precision. Nevertheless, with denser breast glandular tissue and heightened compression, both the average glandular dose (AGD) and tube current in DBT escalate. Consequently, the radiation dose to breast glands in DBT surpasses that of DM under similar compression conditions [7]. Secondly, although DBT is superior to FFDM in the diagnostic rate of breast lesions, the imaging and reading time of DBT is significantly longer than that of FFDM, and there are certain cognitive errors, which are not favorable for imaging physicians to read the films [8].
4. Analysis of DBT Technology Development
DBT's current limitations might restrict its progress in breast screening, hampering overall technological advancement. To address these, strategies include leveraging DBT's 3D data to reconstruct 2D images, capturing tomosynthesis and plain film images in a single scan to minimize radiation exposure and tissue overlap. DBT's future development should prioritize enhancing deep learning models, expanding databases, and refining film reading accuracy for improved outcomes.
4.1. Reconstruction of 2D images from 3D data
X-ray imaging relies on how X-rays interact with human tissues—differences in permeability, fluorescence, light sensitivity, and tissue density. As X-rays pass through the body, their absorption varies, creating diverse contrasts on the screen or X-ray film, forming distinct black-and-white images. The clarity of X-ray imaging is positively correlated to the intensity of the X-rays. The radiation dose ( \( D \) ) is positively related to the intensity of the radiation source ( \( S \) ) ( \( Q \) is the specific activity of the source, \( r \) is the distance from the source, and \( θ \) is the angle between the incident direction and the vertical direction):
\( D=\frac{SQ}{4π{r^{2}}}·\frac{1-cosθ}{2π}\ \ \ (1) \)
From equation (1) radiation dose formula, it is known that to control the radiation dose, the radiation dose can be reduced by reducing the intensity of the radiation source. In DBT screening, secondary X-ray exposure should be avoided as much as possible in order to reduce the intensity of the radiation source. In breast lesion screening, maintaining radiation exposure below safe levels is crucial. DBT creates a 3D breast dataset, minimizing tissue overlap. However, combining breast tomosynthesis with mammography intensifies the radiation source, elevating patient radiation dosage, potentially compromising their health. Obtaining tomosynthesis images in a single scan and reconstructing 2D images using 3D data reduces the additional radiation dose to the patient, and the reconstructed 2D images are called "virtual mammograms". The TOSYMA Screening Trial Study Group, led by Walter Heindel of the University of Münster, Germany [9], evaluated the diagnostic efficacy of "breast tomosynthesis + virtual mammogram" compared with that of "mammography" in a multicenter, randomized, controlled trial and found that the diagnostic efficacy of using tomosynthesis + virtual mammogram was not as good as that of mammography. In a multicenter, randomized controlled trial, the diagnostic efficacy of "breast tomosynthesis + virtual mammogram" versus "mammography" was evaluated, and it was found that the detection rate of invasive breast cancer using tomosynthesis and reconstructed virtual mammograms was 7.1/1000, which is about 48% higher than that of conventional imaging. Experimental results show that DBT combined with virtual mammograms has a significantly higher detection rate for invasive cancers of pT1 size than DBT alone, and the radiation dose is lower than the reference standard [9]. Comparison of the detection rates between the two groups is shown in Table 3, which shows that the detection rate of invasive cancer in the DBT+s2D group was 7.1/1000, and that in the DBT group was 4.8/1000, with an OR of 1.48 [95% CI 1.25-1.75] and p<0.0001, indicating that the detection rate of invasive cancer in the DBT+s2D group was significantly higher than that in the DBT group. The detection rate of invasive cancers with tumor size pT1 was 5.1/1000 in the DBT+s2D group and 3.0/1000 in the DBT group, OR 1.73 [95%CI 1.41-2.13] indicated that the detection rate of invasive cancers with tumor size pT1 in the DBT+s2D group was significantly higher than that of the DBT group.The OR of DCIS detection was 0.94 [95%CI 0.65-1.35], which indicated that there was no significant difference in DCIS detection rate between the two groups. DCIS detection rate was not significantly different. Recall OR 0.98 [95%CI 0.92-1.03] indicated that there was no significant difference in the recall rate between the two groups. PPV1 was 17.2% in the DBT+s2D group and 12.3% in the DBT group, and OR 1.50 [95%CI 1.28-1.77] indicated that PPV1 in the DBT+s2D group was significantly higher than that in the DBT group. The study indicated that combining DBT with s2D significantly outperformed DBT used alone in diagnostics.
Table 3. Summary of outcomes in the intention-to-treat population
Digital breast tomosynthesis plus s2D mammographyn=(49762) | Digital mammography(n=49796) | Rate difference*(95%CI) | OR*(95%CI) | |||
n/N | Detection rate(per 1000 womenscreened) | n/N | Detection rate(per 1000 womenscreened) | |||
Primary outcome | ||||||
Invasivebreast cancerdetection | 354/49715 | 7.1 | 240/49762 | 4.8 | 2.3 per 1000(1.3 to 3.3) | 1.48(1.25 to 1.75) |
Secondary outcomes | ||||||
pT1detection | 255/49715 | 5.1 | 148/49758 | 3.0 | 2.2 per 1000(1.4 to 2.9) | 1.73(1.1 to 2.13) |
DCISdetection | 62/49715 | 1.2 | 66/49762 | 1.3 | -0.1 per 1000(-0.5 to 0.4) | 0.94(0.65 to 1.35) |
Recall | 2457/49756(4.9%) | / | 2515/49794(5.1%) | / | -0.1(-0.4 to 0.2) | 0.98(0.92 to 1.03) |
PPV1 | 416/2416(17.2%) | / | 306/2483(12.3%) | / | 5.1(3.1 to 7.0) | 1.50(1.28 to 1.77) |
n/N=women with event/total women with evaluable data. OR=odds ratio. pT1=tumour size ≤20 mm in largest dimension. DCIS=ductal carcinoma in situ. s2D=synthesised two dimensional. PPV1=positive predictive value of recall | ||||||
U-View is equipped with an intelligent reconstruction algorithm, which intelligently fuses 2D images in a single 3D shot, significantly improving shooting efficiency and effectively reducing radiation dose. Figure 4 is a comparison of DBT and DBT combined reconstructed 2D images in U-View's clinical applications.
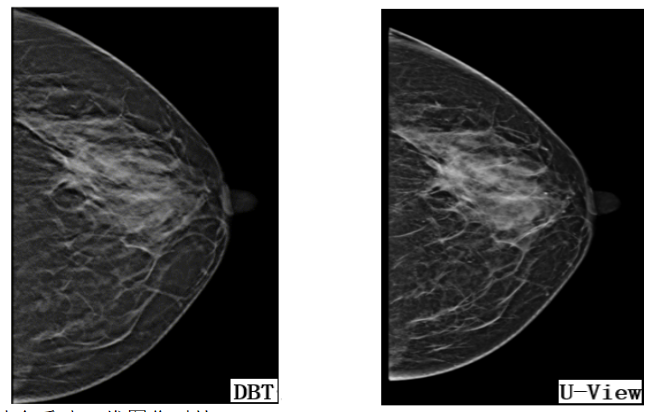
Figure 4. Images from clinical application of UNITED IMAGING
DBT's 3D data reconstruction into 2D planes boosts invasive cancer detection while controlling radiation exposure. However, it faces challenges in assessing calcifications. Research aims to leverage AI for enhanced imaging and spatial resolution. AI distinguishes normal breast tissue from suspected lesions in DBT slices, reducing reading time and enhancing cost-effectiveness.AI is crucial to address this by enhancing imaging and spatial resolution. Using AI, DBT images differentiate normal tissue from potential lesions, streamlining readings, boosting diagnostic accuracy, and optimizing cost-effectiveness.
4.2. Deep Learning Applied to Mammography
ANOVA assesses differences in means among multiple sample groups after testing data for normality and using the chi-square test. If ANOVA conditions aren't met, the Kruskal-Wallis test, assessing rank statistics, is employed. Applying the Kruskal-Wallis test to compare degradation rates, age, and lesion sizes between training and internal test groups aids in predicting ductal carcinoma in situ degradation and staging [10]. Presently, computers aid physicians in diagnoses via machine learning, not independently. Hence, deep learning is integrated into mammography for enhanced diagnostic capabilities.
Deep learning models encode pixel spatial relationships, where deep convolutional neural networks combine only information from spatially similar voxels, making them more suitable for radiographic image evaluation.The model extracts features by performing convolutional operations on nodes and edges to achieve tasks such as classification, clustering, and segmentation of graph data. Its operations include convolution, zero padding, pooling, rectified linear units, fully connected layers, etc. Among them, the number of input channels of the convolution kernel is determined by the number of channels of the input matrix, and the number of channels of the output matrix is determined by the number of output channels of the convolution kernel. The height and width of the output matrix is determined by the input matrix, convolution kernel, and scanning method together [11]:
\( \begin{cases} \begin{array}{c} {height_{out}}=\frac{{height_{in}}-{height_{kernel}}+2∙padding}{stride+1} \\ {width_{out}}=\frac{{width_{in}}-{width_{kernel}}+2∙padding}{stride+1} \end{array} \end{cases}\ \ \ (2) \)
For the error judgment between the network output and the real value, the model selects the combination of classification loss function and regression loss function (the loss functions of the model for DBT image analysis are classification function, object detection function, and segmentation function), and evaluates the model with ROC, accuracy, recall, average pixel precision, and average intersection as the indicators.
Varied training data selection impacts the model's cancer detection accuracy. Scarcity of malignant tumor data in normal screenings may cause under-diagnosis, while an excess may lead to over-diagnosis [12]. This directly affects the model's detection abilities and its potential for autonomous film reading by AI. AI can reduce manual screening by 70% to 90% when aiding physicians [13] and achieve a complete reduction when employed independently while maintaining detection rates. Thus, deep learning model efficacy in DBT hinges on precise training data selection.
4.3. Deep learning combined with reconstruction of 2D images
Deep learning is applied to 2D images reconstructed from DBT 3D data (DBT-s2D) to achieve accuracy, recall, and average pixel optimization with lower radiation dose and higher reading efficiency. A deep convolutional graph neural network (DCGNN) is introduced to perform convolutional operations on nodes and edges to complete the classification and segmentation tasks on the reconstructed 2D graph data, and to realize the deep feature extraction on the graph data. The mathematical expression is as follows (is the node feature matrix of the lth layer, is the weight matrix of the lth layer, is the activation function, is the set of neighbor nodes of node, and is the pooling operation) [14]:
\( {H^{l+1}}=σ\lbrace {max_{iϵN(j)}}[{W^{l}}H_{i}^{l}]\rbrace \ \ \ (3) \)
Setting each patient as a node, the CNN model outputs image features as node features, expands the graph data training set, and constructs connections with graph data similarity using image information as vertex features. However, taking patients as nodes may lead to model exclusion and inapplicability to new data, for this reason, we consider each patient constitutes a graph, with slice as nodes, to construct 3D CNN, and look forward to further research in this field.
5. Conclusion
This paper evaluates DBT technology's current status, advantages, and limitations. It explores how reconstructing 2D images from DBT 3D data enhances invasive cancer detection at lower radiation doses, especially pT1-sized cancers. It discusses deep learning's potential in reducing manual reading by 70% to 90% in mammography and proposes future sustainable research directions by combining deep learning with 2D image reconstruction. Additionally, it highlights the DCGNN model's role in enabling deep feature extraction for DBT-s2D map data.
Also, collaboration among medical professionals, patients, government, and hospitals is essential for the safe and effective implementation of deep learning techniques in breast cancer screening. Adequate training data is pivotal for independent model reading in DBT image diagnosis. AI-assisted film interpretations enable clinicians to gather data, evaluating AI impact on sensitivity, specificity, and reading time to refine training data. Patients' choices of mammography tools, considering abnormalities and family history, impact radiation exposure and breast health. Government and hospital support, offering financial aid and data access, empower research teams, advancing medical imaging practices. This paper acknowledges the restricted data availability, hindering the practical application of the training model in imaging doctors' film readings. The study looks forward to future advancements in 3D CNN research, particularly in its clinical use for image segmentation and case classification.
References
[1]. V J H ,M D K ,Halio R , et al.Calcifications at Digital Breast Tomosynthesis: Imaging Features and Biopsy Techniques.[J].Radiographics : a review publication of the Radiological Society of North America, Inc,2019,39(2):
[2]. Long H. Malfunction repair of GE Senographe DS digital breast machine[J]. China Medical Equipment,2014,11(08):125-126.
[3]. Xu N. Recognition and maintenance of HOLOGIC mammography X-ray machine[J]. Medical Equipment,2017,30(06):49-50.
[4]. Yiming G ,Linda M ,L S H . Digital Breast Tomosynthesis: Update on Technology, Evidence, and Clinical Practice.[J]. Radiographics : a review publication of the Radiological Society of North America, Inc,2021,41(2).
[5]. Friedewald S M , Rafferty E A , Rose S L ,et al.Breast cancer screening using tomosynthesis in combination with digital mammography.[J].Breast Cancer Research & Treatment, 2016, 156(1):109-116.DOI:10.1007/s10549-016-3695-1.
[6]. YAO Miaomiao,CAI Siqing,HUANG Xueqing et al. Comparison of the efficacy of breast three-dimensional tomosynthesis and breast color ultrasound in the diagnosis of breast diseases[J]. Chinese Journal of Medical Physics,2018,35(12):1430-1435.
[7]. LI Jun,XU Aqiao,SAN Yangnu et al. Radiation dose analysis of digital breast tomosynthesis[J]. Zhejiang Trauma Surgery,2021,26(01):3-5.
[8]. E K K ,P S W ,S E M , et al. Strategies to Increase Cancer Detection: Review of True-Positive and False-Negative Results at Digital Breast Tomosynthesis Screening.[J]. Radiographics : a review publication of the Radiological Society of North America, Inc,2016,36(7).
[9]. Walter H ,Stefanie W ,Joachim G , et al. Digital breast tomosynthesis plus synthesised mammography versus digital screening mammography for the detection of invasive breast cancer (TOSYMA): a multicentre, open-label, randomised, controlled, superiority trial.[J]. The Lancet. Oncology,2022,23(5).
[10]. Rui H ,J L G ,A M M , et al. Prediction of Upstaging in Ductal Carcinoma in Situ Based on Mammographic Radiomic Features.[J]. Radiology,2022.
[11]. Krizhevsky A ,Sutskever I ,Hinton E G .ImageNet classification with deep convolutional neural networks[J].Communications of the ACM,2017,60(6):
[12]. Jun B ,Russell P ,Tianyu W , et al.Applying Deep Learning in Digital Breast Tomosynthesis for Automatic Breast Cancer Detection: A Review[J].Medical Image Analysis,2021,71(prepublish):
[13]. Sara R ,Esperanza E ,Luis J R , et al.Stand-Alone Use of Artificial Intelligence for Digital Mammography and Digital Breast Tomosynthesis Screening: A Retrospective Evaluation.[J].Radiology,2021,
[14]. Kipf N T ,Welling M .Semi-Supervised Classification with Graph Convolutional Networks.[J].CoRR,2016,abs/1609.02907]
Cite this article
Ding,J. (2024). Analysis of the advantages and sustainability of digital breast tomosynthesis. Theoretical and Natural Science,35,173-181.
Data availability
The datasets used and/or analyzed during the current study will be available from the authors upon reasonable request.
Disclaimer/Publisher's Note
The statements, opinions and data contained in all publications are solely those of the individual author(s) and contributor(s) and not of EWA Publishing and/or the editor(s). EWA Publishing and/or the editor(s) disclaim responsibility for any injury to people or property resulting from any ideas, methods, instructions or products referred to in the content.
About volume
Volume title: Proceedings of the 2nd International Conference on Modern Medicine and Global Health
© 2024 by the author(s). Licensee EWA Publishing, Oxford, UK. This article is an open access article distributed under the terms and
conditions of the Creative Commons Attribution (CC BY) license. Authors who
publish this series agree to the following terms:
1. Authors retain copyright and grant the series right of first publication with the work simultaneously licensed under a Creative Commons
Attribution License that allows others to share the work with an acknowledgment of the work's authorship and initial publication in this
series.
2. Authors are able to enter into separate, additional contractual arrangements for the non-exclusive distribution of the series's published
version of the work (e.g., post it to an institutional repository or publish it in a book), with an acknowledgment of its initial
publication in this series.
3. Authors are permitted and encouraged to post their work online (e.g., in institutional repositories or on their website) prior to and
during the submission process, as it can lead to productive exchanges, as well as earlier and greater citation of published work (See
Open access policy for details).
References
[1]. V J H ,M D K ,Halio R , et al.Calcifications at Digital Breast Tomosynthesis: Imaging Features and Biopsy Techniques.[J].Radiographics : a review publication of the Radiological Society of North America, Inc,2019,39(2):
[2]. Long H. Malfunction repair of GE Senographe DS digital breast machine[J]. China Medical Equipment,2014,11(08):125-126.
[3]. Xu N. Recognition and maintenance of HOLOGIC mammography X-ray machine[J]. Medical Equipment,2017,30(06):49-50.
[4]. Yiming G ,Linda M ,L S H . Digital Breast Tomosynthesis: Update on Technology, Evidence, and Clinical Practice.[J]. Radiographics : a review publication of the Radiological Society of North America, Inc,2021,41(2).
[5]. Friedewald S M , Rafferty E A , Rose S L ,et al.Breast cancer screening using tomosynthesis in combination with digital mammography.[J].Breast Cancer Research & Treatment, 2016, 156(1):109-116.DOI:10.1007/s10549-016-3695-1.
[6]. YAO Miaomiao,CAI Siqing,HUANG Xueqing et al. Comparison of the efficacy of breast three-dimensional tomosynthesis and breast color ultrasound in the diagnosis of breast diseases[J]. Chinese Journal of Medical Physics,2018,35(12):1430-1435.
[7]. LI Jun,XU Aqiao,SAN Yangnu et al. Radiation dose analysis of digital breast tomosynthesis[J]. Zhejiang Trauma Surgery,2021,26(01):3-5.
[8]. E K K ,P S W ,S E M , et al. Strategies to Increase Cancer Detection: Review of True-Positive and False-Negative Results at Digital Breast Tomosynthesis Screening.[J]. Radiographics : a review publication of the Radiological Society of North America, Inc,2016,36(7).
[9]. Walter H ,Stefanie W ,Joachim G , et al. Digital breast tomosynthesis plus synthesised mammography versus digital screening mammography for the detection of invasive breast cancer (TOSYMA): a multicentre, open-label, randomised, controlled, superiority trial.[J]. The Lancet. Oncology,2022,23(5).
[10]. Rui H ,J L G ,A M M , et al. Prediction of Upstaging in Ductal Carcinoma in Situ Based on Mammographic Radiomic Features.[J]. Radiology,2022.
[11]. Krizhevsky A ,Sutskever I ,Hinton E G .ImageNet classification with deep convolutional neural networks[J].Communications of the ACM,2017,60(6):
[12]. Jun B ,Russell P ,Tianyu W , et al.Applying Deep Learning in Digital Breast Tomosynthesis for Automatic Breast Cancer Detection: A Review[J].Medical Image Analysis,2021,71(prepublish):
[13]. Sara R ,Esperanza E ,Luis J R , et al.Stand-Alone Use of Artificial Intelligence for Digital Mammography and Digital Breast Tomosynthesis Screening: A Retrospective Evaluation.[J].Radiology,2021,
[14]. Kipf N T ,Welling M .Semi-Supervised Classification with Graph Convolutional Networks.[J].CoRR,2016,abs/1609.02907]