


1. Introduction
Insomnia is a prevalent sleep-related disorder known to be associated with various conditions such as sleep environment, psychological stress, age, family inheritance, and endocrine status [1]. Its causes are diverse, making its treatment challenging. Currently, clinical approaches often involve the use of sedative and hypnotic drugs to address insomnia [2]. However, these medications come with side effects and are often controlled psychotropic drugs. Consequently, some medical institutions are exploring alternative treatment approaches, focusing on mental healthcare to aid in insomnia treatment.
Specific ancient remedies offer gentler approaches to addressing insomnia than modern medical treatments. For instance, in traditional Chinese medicine (TCM), insomnia’s root cause is believed to stem from the Yin-Yang imbalance and unstable Qi. TCM employs numerous herbal formulations to treat insomnia, many of which emphasize liver nourishment and kidney tonification rather than directly addressing mental aspects [3]. From a TCM perspective, nourishing the liver is closely linked to the body’s immune system, and Qi’s role is intertwined with the body’s immunity. Adequate Qi levels enable better disease resistance and mental well-being [4]. Presently, there is a lack of molecular-level analysis relating to immunity in TCM, offering a fresh perspective to explore the immunological aspects of insomnia and potential treatment methods.
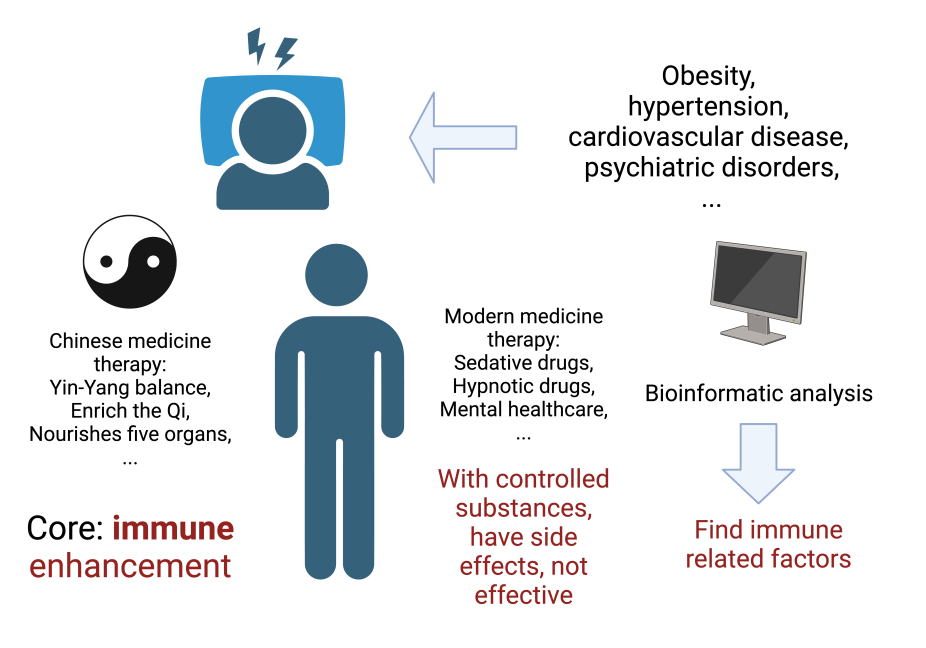
Figure 1. Motivation for research and ideas
This study involved downloading a relevant dataset (GSE208668) from the Gene Expression Omnibus (GEO) and conducting differential expression gene (DEG) analysis between the insomnia and control groups. Key differentially expressed gene modules were identified, and functional enrichment highlighted the biological functions of these crucial gene modules. Subsequently, protein-protein interaction network analysis and identification of core genes (hub genes) were performed using the filtered DEGs. Using these core genes, insomnia prediction was conducted, ROC curves were plotted, and core genes suitable for immune analysis were selected.
Further analysis involved assessing immune cell infiltration in patients with insomnia using CIBERSORT, calculating the correlation between critical genes and immune cell infiltration. Additionally, Mendelian genetic analysis was conducted on core immune-related genes, examining the relationship between these core genes and insomnia.
2. Materials and method
2.1. Data resources and preprocessing
We researched insomnia and sleep disorders within the GEO database to gather pertinent expression data. After excluding irrelevant data that did not meet the research criteria, we selected the GSE208668 dataset [5]. This dataset comprised samples of peripheral blood mononuclear cells (PBMCs) from 17 elderly individuals, some experiencing insomnia and others without the condition. Upon successfully downloading the array data, we converted it into gene expression information using the expression values of probes in the GEO dataset. We then filtered out probes containing multiple genes and calculated the average values for probes corresponding to multiple genes.
2.2. Identification of differentially expressed genes (DEGs) and common genes
This study utilized the R programming language, specifically employing the limma package to analyze the processed expression matrix from the previous step and identify the Differentially Expressed Genes (DEGs) [6]. Additionally, based on the analysis of DEGs, a heatmap was generated to visualize the differences in gene expression between the groups. Furthermore, a volcano plot was created to depict the significantly differentially expressed genes. During the DEGs identification process, genes with a logFC value greater than one and an adj. p-value greater than 0.05 were selected.
2.3. Functional enrichment analysis
The study employed Gene Ontology (GO) analysis, encompassing Biological Processes (BP), Molecular Function (MF), and Cellular Component (CC), along with Kyoto Encyclopedia of Genes and Genomes (KEGG) pathway enrichment analysis. These analyses were conducted using the ‘clusterProfiler’ package [7] in the R programming language. In the GO analysis, a threshold of p < 0.05 was utilized to designate significant pathways during the selection process.
2.4. Protein-protein interaction (PPI) networks’ constructing
The construction of Protein-Protein Interaction (PPI) networks primarily relied on the STRING database (version 12.0) [https://string-db.org/version12.0] [8]. This network was established to analyze and predict functional correlations and interactions among the previously filtered Differentially Expressed Genes (DEGs). In this experiment, a confidence score threshold of 0.4 was chosen for the network construction.
Subsequently, the Cytoscape software (Version: 3.10.1) [9] was employed to visualize the results of the PPI network analysis. Moreover, the cytoHubba application, utilizing the Maximal Clique Centrality (MCC) algorithm [10], was used to identify the core genes within the PPI network.
2.5. Construction of the logistic regression model
The study utilized the ‘glm’ function in R [11] to construct logistic regression models based on the expression values of core genes selected from the Protein-Protein Interaction (PPI) network and the binary classification of samples indicating the presence (labeled as ‘1’) or absence (labeled as ‘0’) of insomnia.
2.6. Evaluation of immune cell infiltration and its correlation with key genes
CIBERSORT R script v1.03 [12] along with the ‘ggplot2’ package [13], to analyze the relationship between core genes and various critical immune cells, such as B cells, T cells, macrophages, monocytes, NK cells, Plasma cells, Mast cells, Dendritic cells, among others.
Using these tools, heatmaps depicting the correlations of immune cells and their correlations across different sample types were generated. Subsequently, violin plots and lollipop charts were employed to illustrate the direct associations between core genes and different types of immune cells.
Based on earlier analyses of ROC curves and hub genes, IL2 and CALML3 were selected for in-depth analysis of immune cell infiltration.
2.7. Mendelian randomization
In this study, we selected Genome-Wide Association Study (GWAS) data on insomnia from [https://gwas.mrcieu.ac.uk] [14] as the outcome dataset. I used the previously identified hub genes IL2 and CALML3 as exposure variables to conduct two-sample Mendelian Randomization analyses on these samples. To ascertain independent SNP instruments for each risk factor, we pruned GWAS significant SNPs (P < 5 × 10−08) for each risk factor (r2 < 0.05; LD window: 10,000 kb; using UK Biobank 10K LD reference).
For sensitivity analysis, the TwoSampleMR package [15] in R was employed. Subsequently, causal estimation values were calculated using Mendelian Randomization techniques, including MR-Egger, Inverse Variance Weighted, simple mode, weighted mode, and the median-based method, utilizing the Mendelian Randomization R software package.
2.8. Data resources
In this study, we selected Genome-Wide Association Study (GWAS) data on insomnia from [https://gwas.mrcieu.ac.uk] as the outcome dataset. For the DEGs and other related analysis, the data is from GEO, the accession numbers are in table 1.
Table 1. The table of data resources
Database | Accession number | |
Insomnia | GEO database | GSE208668 |
Gwas.mrcieu | ukb-b-3957 | |
ukb-a-13 | ||
ebi-a-GCST90018869 | ||
IL2 | Gwas.mrcieu | prot-c-3070_1_2 |
ebi-a-GCST004455 | ||
prot-a-1512 |
3. Results
3.1. Identification of DEGs
|
| |
Figure 2. A volcano plot displays genes that differ between insomnia patients and healthy controls in GSE208668. Red points mean up-regulation, blue down-regulation, and black no significant difference. | Figure 3. A heatmap of gene expression differences between insomnia patients and healthy controls in GSE208668. Genes are on the vertical axis, samples on the horizontal. Red represents high expression, while blue indicates low expression. |
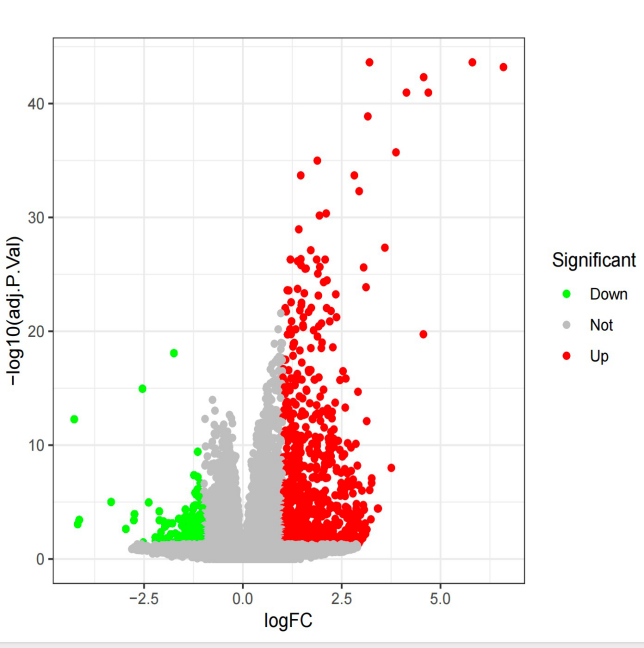
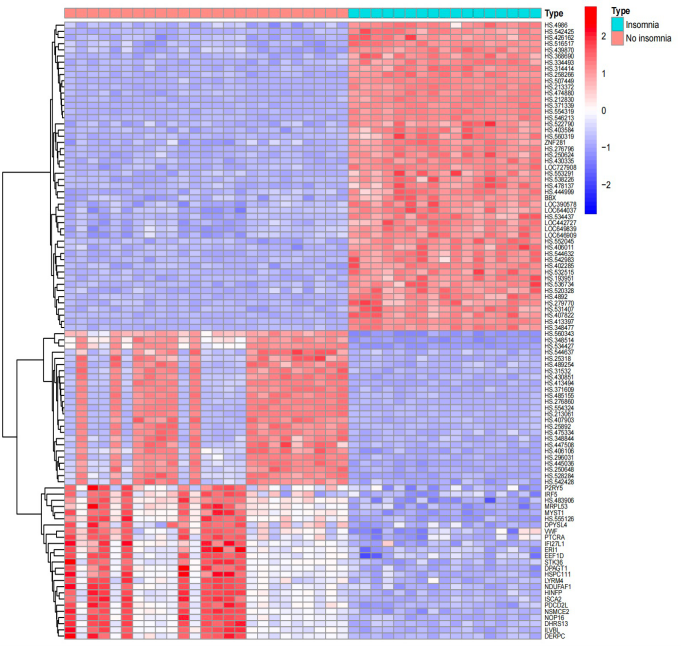
After standardizing the mRNA profiles from GSE208668, 1029 differentially expressed genes (DEGs) were identified. Among these, in samples from individuals with insomnia compared to the control group, 241 DEGs were downregulated, while 788 DEGs were upregulated. These results highlight significant differences in gene expression between the control and insomnia groups.
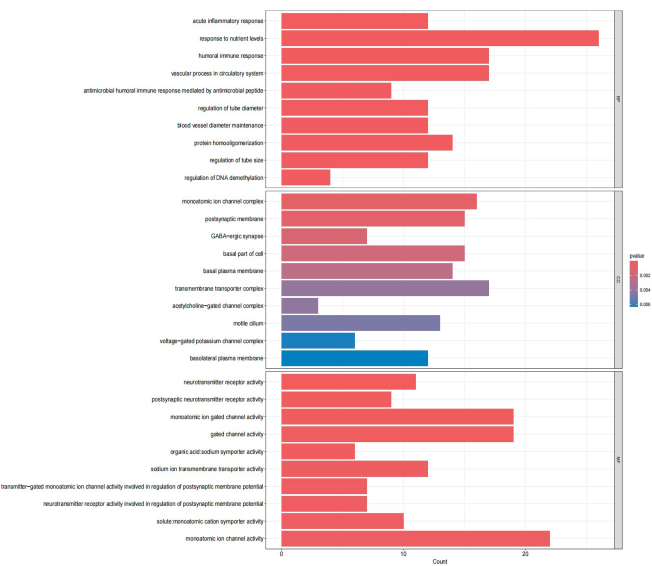
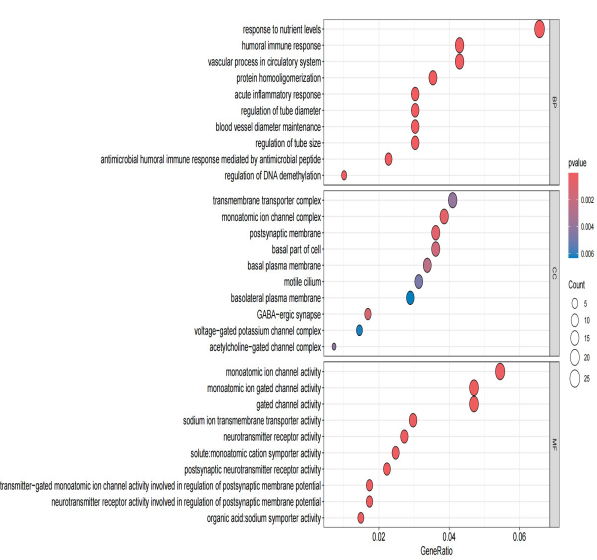
3.2. Functional and pathway enrichment analysis
This study utilized the dataset of 1029 DEGs to perform GO and KEGG pathway analyses. The results, mainly focusing on the enrichment findings in BP, revealed significant associations with pathways related to acute inflammatory response, humoral immune response, and the vascular process in the circulatory system. These findings suggest a connection between insomnia and immune-related pathways, aligning with contemporary research conclusions. The Top 20 MF-related results obtained from the KEGG analysis were also presented.
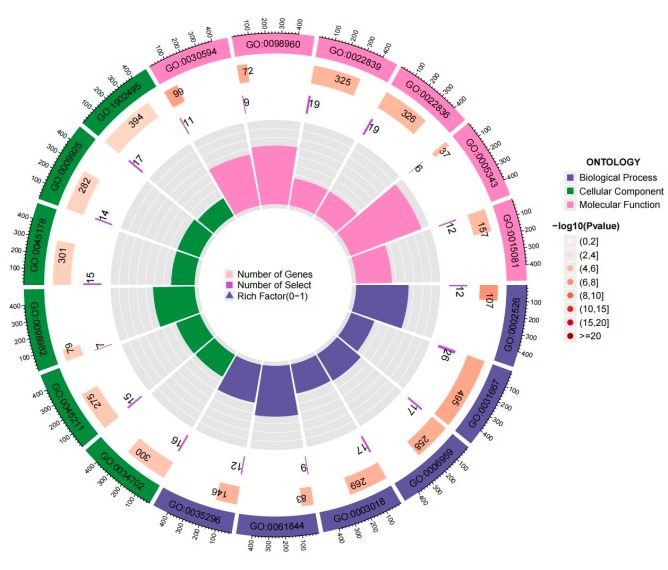
Figure 4. The circle plot of the results of enrichment of GO terms and KEGG pathways based on 1029 DEGs.
|
| |
Figure 5. Enrichment of GO terms and KEGG pathways based on 1029 DEGs. | Figure 6. Enrichment of GO terms and KEGG pathways based on 1029 DEGs. |
3.3. Hubgenes in PPI networks
The STRING database predicted protein function connections and interactions, filtering interactions between protein pairs with a confidence score of ≥ 0.4. Among these, 522 protein nodes were considered for constructing the Protein-Protein Interaction (PPI) network. The top ten nodes based on node degree were extracted using the CytoHubba plug-in with the Maximal Clique Centrality algorithm. Notably, the highest degree reached 32, and nodes with higher degrees are depicted in a progressively redder color gradient to represent their significance.
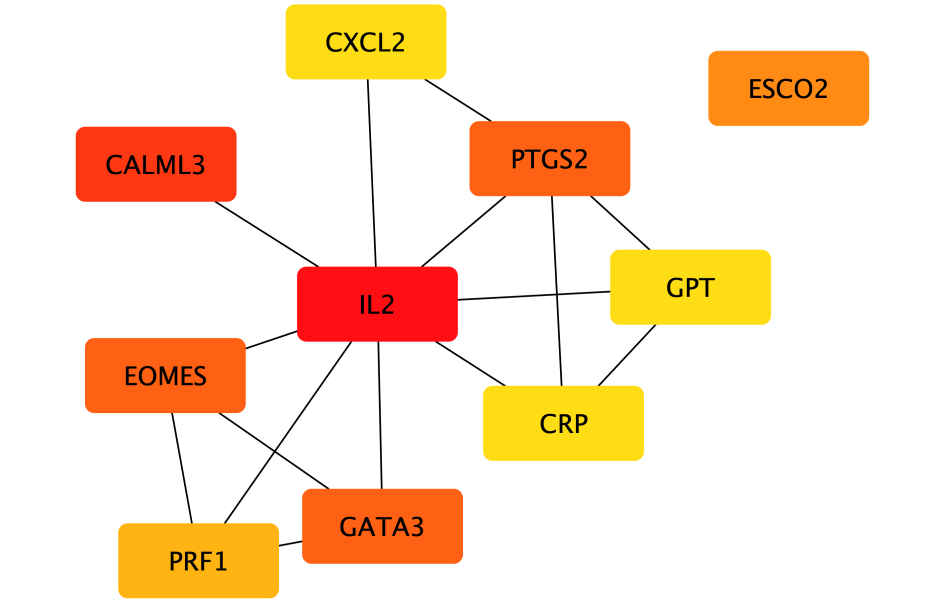
Figure 7. The top 10 hub genes in the PPI network, a redder color in the lattice means more connected and related nodes, the greater the possible importance of the gene
3.4. Logistic regression model
TI constructed a logistic regression model using the hub genes identified in the article. This model employed regression analysis based on these hub genes. In total, five core genes were selected to build the logistic regression model. The R-squared values for each gene variable were computed from the model results, and ROC curves were plotted accordingly. From the ROC curves, it is evident that CALML3 and PTGS2 genes exhibit relatively better performance. In contrast, the core gene with the highest degree, IL2, does not demonstrate a notably large area under the ROC curve.
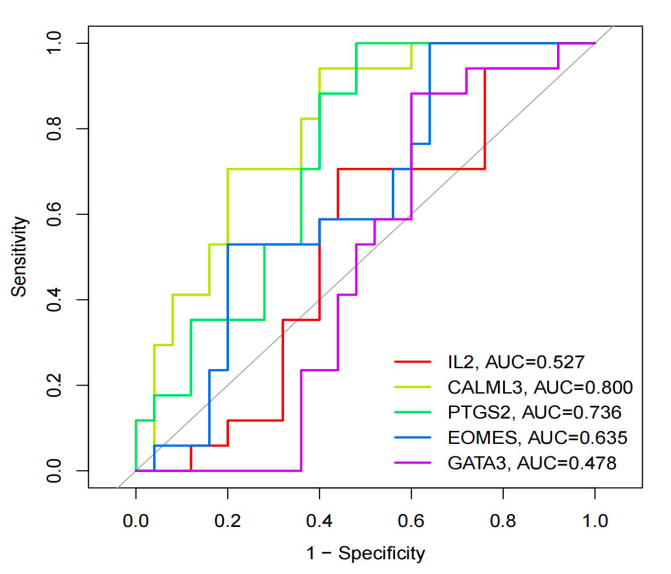
Figure 8. The ROC curve. The horizontal axis represents the false positive rate and the vertical axis represents the true positive rate.
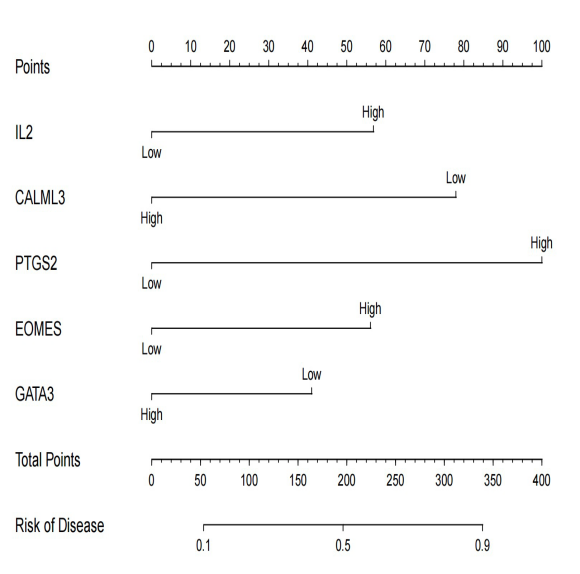
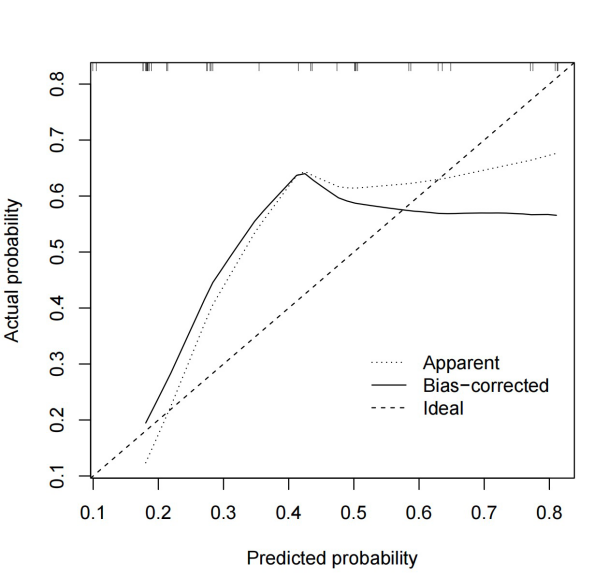
Moreover, we generated calibration curves and a Nomogram based on the model’s performance. These visuals also indicated similar findings, highlighting the superior effectiveness of CALML3 and PTGS2 genes compared to IL2. However, it is essential to note that the results from the regression analysis did not meet our expectations, as the model’s performance could not have been more optimal.
|
| |
Figure 9. The Nomogram showing predicted scores using filtered hubgenes. | Figure 10. The Calibration Curve. The horizontal axis represents the Nomogram-Predicted Probability of insomnia and the vertical axis represents the actual probability. |
3.5. Immune cell infiltration results
We utilized the CIBERSORT algorithm to explore the relationship between the CPAP phenotype and immune cell infiltration, encompassing key cell types like T cells, natural killer cells, and mast cells. After analyzing the expression matrix of relevant immune cells using the CIBERSORT R script v1.03 in R, we visualized the results using “ggplot2”. We generated heatmaps for immune cell expression and their correlations alongside violin plots showcasing the differential expression between the control and disease groups.
|
| |
Figure 11. Correlation degree of 20 immunocyte subgroups in every specimen. | Figure 12. The heatmap of the correlation of 20 immune-related processes. |
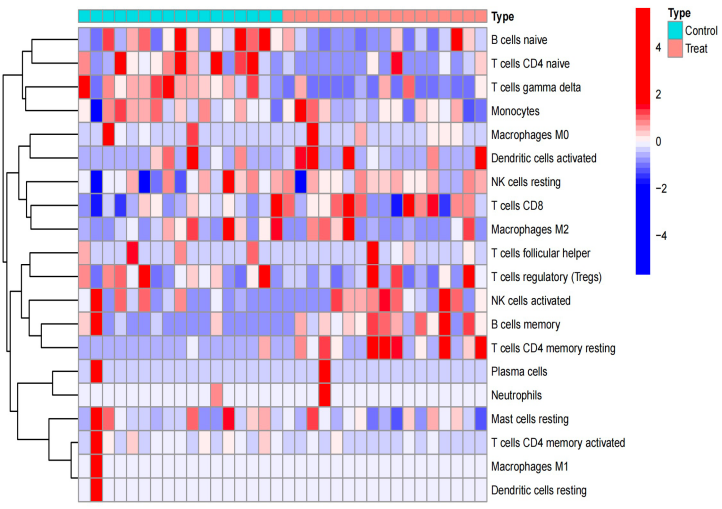

The results notably revealed significant and reliable expression differences in T cells’ gamma delta and T cells’ CD4 memory resting, primarily highlighting differences in CD4 immune cell-related expression between the two groups.
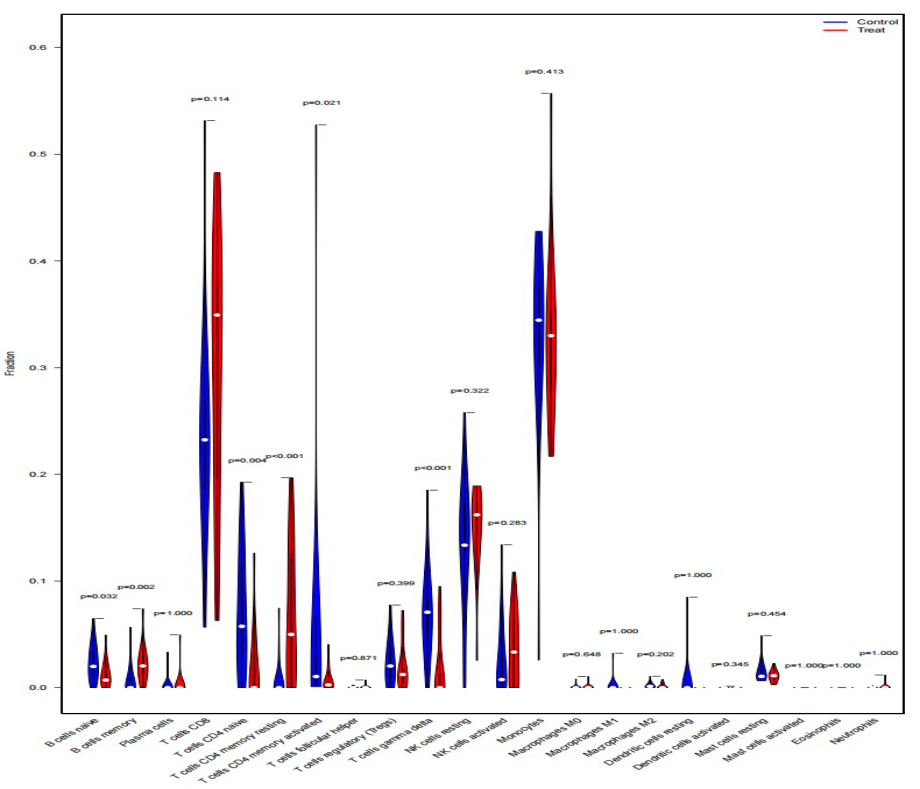
Figure 13. Violin chart of the expression levels of 20 immunocyte subgroups in LC and normal groups.
Following this, based on gene expression, we computed the correlations between the central genes (IL2, CALML3, and PTGS2) and primary immune cells (Macrophages, Mast cells resting, T cells CD4 memory resting, and T cells CD8). These genes exhibited correlations with these immune cells. Subsequently, we created lollipop plots to illustrate the correlation coefficient results.
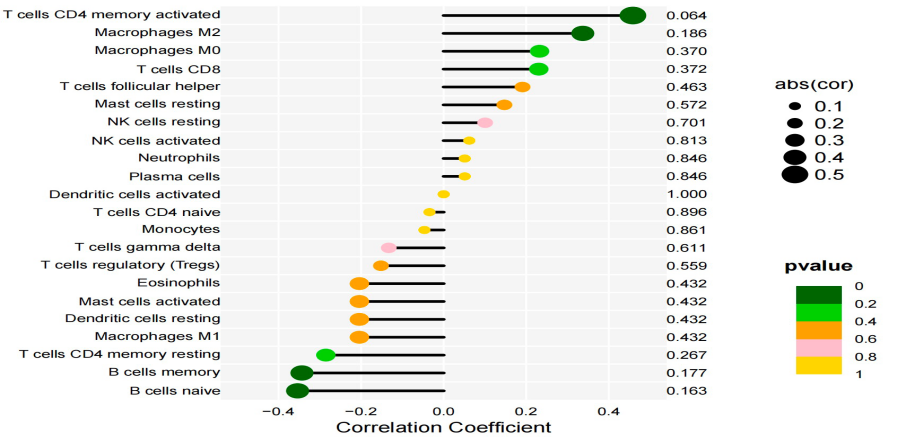
Figure 14. The lollipop graph. The horizontal axis represents the correlation coefficient, and the vertical axis represents the actual probability.
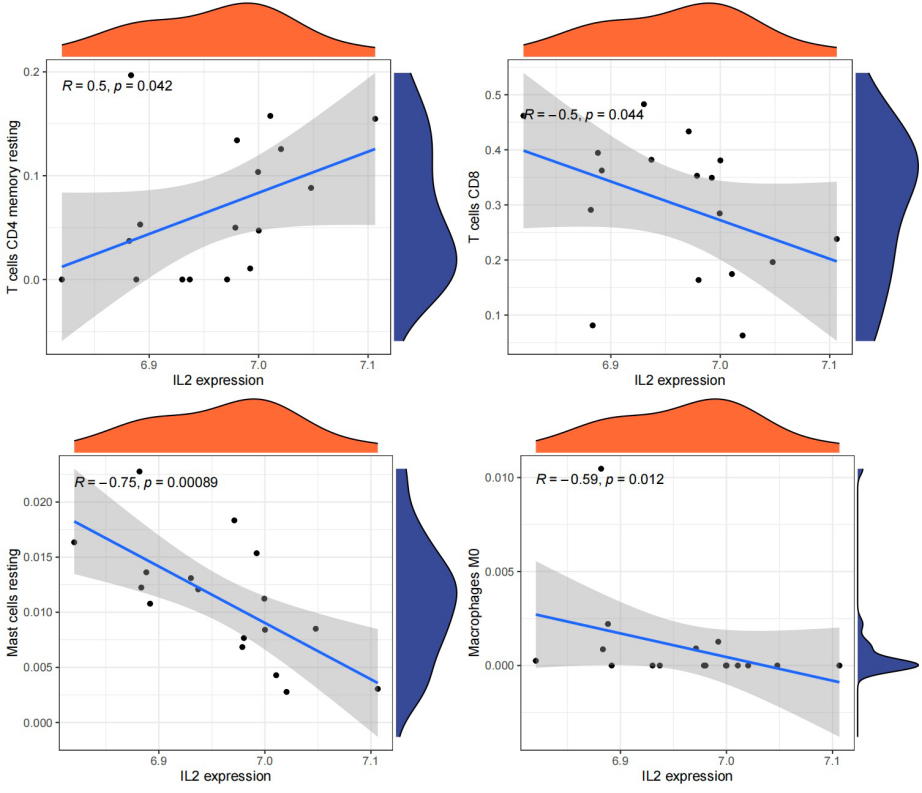
Figure 15. The immune correlation for IL2 expression and four different immune-related processes.
3.6. Mendelian randomization
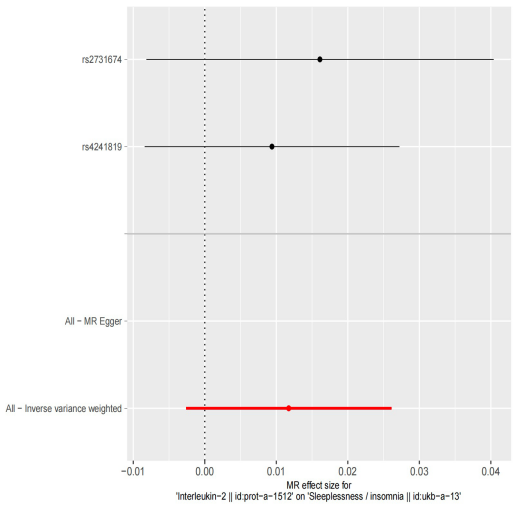
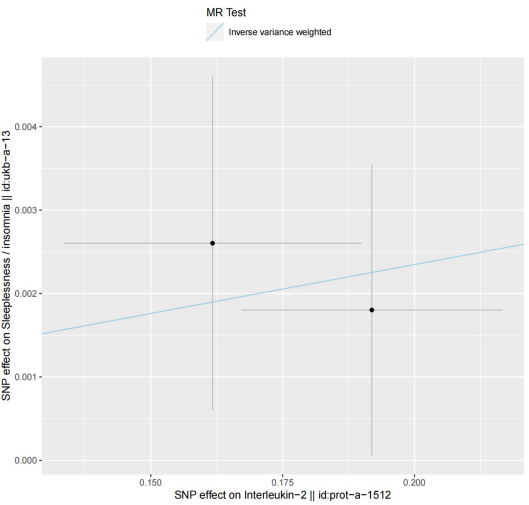
In our exploration to discern a causal relationship between selected GWAS data of relevant genes and insomnia-related GWAS data, we aimed to understand whether a causal link exists between the two. Unfortunately, the selection of related SNPs was limited due to inadequate data availability, providing only a restricted dataset. The data indicated the presence of two significant SNPs between them. It is noteworthy that both SNPs exhibited a positive correlation with insomnia occurrence, implying that SNPs associated with IL2 overall could contribute to the onset of insomnia. However, the results needed more statistical significance due to insufficient data and the limited scope of analysis needed to have a few pivotal genes.
|
| |
Figure 16. The forest plot for the MR analysis result. | Figure 17. The scatter plot for the MR analysis result. |
4. Discussion
Insomnia, a pervasive sleep disorder, has spurred extensive research efforts due to its intricate nature influenced by genetic and immune factors. This study employed a comprehensive analysis merging gene chip and GWAS data to investigate the genetic underpinnings of insomnia in the elderly population. Identifying differential genes in this cohort paved the way for further exploration into the disease-related pathways implicated in insomnia, ultimately culminating in selecting pivotal genes—IL2, CALML3, and PTGS2.
The centrality of IL-2 in immune function is pivotal. As an interleukin and cell growth factor within the immune system, IL-2 plays a multifaceted role, regulating the activity of white blood cells, fostering proliferation in vital immune cells like Th0 and CTL, and contributing significantly to antibody responses, hematopoiesis, and tumor surveillance [16]. The connections established by CALML3 with Alzheimer’s disease, miRNA effects, and the B Cell Receptor Signaling Pathway further underscore its involvement in immune processes [17]. Similarly, PTGS2’s association with inflammatory pathways strengthens the link between these pivotal genes and immune function, outlining a plausible correlation between insomnia and immune system dysregulation [18].
Moreover, the pathway analyses conducted on differential genes unveiled their involvement in pivotal immune-related pathways like acute inflammatory and humoral immune responses. Furthermore, the observed associations between differential genes in insomnia and cardiovascular diseases are consistent with findings from various established studies, underscoring the intricate links between insomnia, immune responses, and broader health outcomes.
The investigation into immune cell infiltration shed light on correlations between insomnia and diverse immune cell subsets, including T cells gamma delta and T cells CD4 memory resting. These findings offer critical insights, hinting at distinct immune characteristics associated with insomnia and paving the way for potential immune-centered therapeutic avenues in addressing this prevalent sleep disorder.
However, the Mendelian Randomization study encountered limitations in identifying relevant gene SNPs. While IL2 showed promising data among the core genes, the scarcity of adequate SNPs hindered a comprehensive analysis to ascertain their relationship with insomnia.
Despite the comprehensive analysis conducted in this study, the overall need for more available data poses challenges for in-depth analysis. Additionally, the data’s origin from an elderly population underscores the need for further research in related domains to extrapolate these findings to broader populations. Continued research in these areas will likely provide more comprehensive insights into the intricate interplay between genetics, immune responses, and insomnia.
5. Conclusion
Insomnia, a complex sleep disorder, has garnered attention due to its multifaceted nature involving genetic, environmental, and immune factors. This paper delves into a comprehensive analysis encompassing genetic disparities, immune responses, and the potential relationship between these facets and insomnia. The utilization of Mendelian Randomization analysis, alongside SNPs data, presents a promising approach to understanding the intricate interplay between genetic variations and the manifestation of insomnia.
The identification of pivotal genes linked to insomnia sheds light on the intricate mechanisms underlying this disorder. However, the research landscape concerning insomnia presents particular challenges. The scarcity of available data, particularly related to SNPs for pertinent genes, hampers the depth and precision of the Mendelian Randomization analysis. The limited availability of comprehensive datasets impedes exploring the causal relationships between genetic variations and insomnia.
Despite these challenges, the study’s outcomes offer significant promise. The conventional approaches to treating insomnia predominantly involve psychotropic medications, often accompanied by notable side effects and varying degrees of effectiveness. Exploring alternative avenues, particularly immune-centric treatments inspired by traditional Chinese medicine, represents a promising opportunity. Such approaches could mitigate adverse patient effects while providing novel pathways for drug development.
Looking ahead, the research plan includes designing and implementing wet lab experiments grounded in the identified pathways. This step aims to validate and reinforce the findings obtained from the genetic and immune analyses. Additionally, ongoing monitoring and acquisition of related data will facilitate a continuous and comprehensive analysis, fostering a deeper understanding of the intricate relationships between genetic disparities, immune responses, and insomnia.
This integrative approach not only contributes to unraveling the complexities of insomnia but also paves the way for potential paradigm shifts in its treatment and management, fostering a more holistic and practical approach toward addressing this prevalent sleep disorder.
References
[1]. Riemann, D., Spiegelhalder, K., Feige, B., Voderholzer, U., Berger, M., Perlis, M. and Nissen, C., 2010. The hyperarousal model of insomnia: a review of the concept and its evidence. Sleep medicine reviews, 14(1), pp.19-31.
[2]. Kramer, M., 2000. Hypnotic medication in the treatment of chronic insomnia: non nocere! Doesn’t anyone care?. Sleep Medicine Reviews, 4(6), pp.529-541.
[3]. Hu, J., Teng, J., Wang, W., Yang, N., Tian, H., Zhang, W., Peng, X. and Zhang, J., 2021. Clinical efficacy and safety of traditional Chinese medicine **ao Yao San in insomnia combined with anxiety. Medicine, 100(43), p.e27608.
[4]. Piber, D., Cho, J.H., Lee, O., Lamkin, D.M., Olmstead, R. and Irwin, M.R., 2022. Sleep disturbance and activation of cellular and transcriptional mechanisms of inflammation in older adults. Brain, Behavior, and Immunity, 106, pp.67-75.
[5]. Ritchie, M.E., Phipson, B., Wu, D.I., Hu, Y., Law, C.W., Shi, W. and Smyth, G.K., 2015. limma powers differential expression analyses for RNA-sequencing and microarray studies. Nucleic acids research, 43(7), pp.e47-e47.
[6]. Ritchie, M.E., Phipson, B., Wu, D.I., Hu, Y., Law, C.W., Shi, W. and Smyth, G.K., 2015. limma powers differential expression analyses for RNA-sequencing and microarray studies. Nucleic acids research, 43(7), pp.e47-e47.
[7]. Wu, T., Hu, E., Xu, S., Chen, M., Guo, P., Dai, Z., Feng, T., Zhou, L., Tang, W., Zhan, L.I. and Fu, X., 2021. clusterProfiler 4.0: A universal enrichment tool for interpreting omics data. The innovation, 2(3).
[8]. Mering, C.V., Huynen, M., Jaeggi, D., Schmidt, S., Bork, P. and Snel, B., 2003. STRING: a database of predicted functional associations between proteins. Nucleic acids research, 31(1), pp.258-261.
[9]. Smoot, M.E., Ono, K., Ruscheinski, J., Wang, P.L. and Ideker, T., 2011. Cytoscape 2.8: new features for data integration and network visualization. Bioinformatics, 27(3), pp.431-432.
[10]. Li, C. and Xu, J., 2019. Feature selection with the Fisher score followed by the Maximal Clique Centrality algorithm can accurately identify the hub genes of hepatocellular carcinoma. Scientific Reports, 9(1), p.17283.
[11]. Calcagno, V. and de Mazancourt, C., 2010. glmulti: an R package for easy automated model selection with (generalized) linear models. Journal of statistical software, 34, pp.1-29.
[12]. Chen, B., Khodadoust, M.S., Liu, C.L., Newman, A.M. and Alizadeh, A.A., 2018. Profiling tumor infiltrating immune cells with CIBERSORT. Cancer Systems Biology: Methods and Protocols, pp.243-259.
[13]. Yu, G., Smith, D.K., Zhu, H., Guan, Y. and Lam, T.T.Y., 2017. ggtree: an R package for visualization and annotation of phylogenetic trees with their covariates and other associated data. Methods in Ecology and Evolution, 8(1), pp.28-36.
[14]. Elsworth, B., Lyon, M., Alexander, T., Liu, Y., Matthews, P., Hallett, J., Bates, P., Palmer, T., Haberland, V., Smith, G.D. and Zheng, J., 2020. The MRC IEU OpenGWAS data infrastructure. BioRxiv, pp.2020-08.
[15]. Hemani, G., Zheng, J., Elsworth, B., Wade, K.H., Haberland, V., Baird, D., Laurin, C., Burgess, S., Bowden, J., Langdon, R. and Tan, V.Y., 2018. The MR-Base platform supports systematic causal inference across the human phenome. elife, 7, p.e34408.
[16]. Abbas, A.K., Trotta, E., R. Simeonov, D., Marson, A. and Bluestone, J.A., 2018. Revisiting IL-2: Biology and therapeutic prospects. Science immunology, 3(25), p.eaat1482.
[17]. Yang, B., Li, M., Tang, W., Liu, W., Zhang, S., Chen, L. and ** point of hepatocellular carcinoma. Nature communications, 9(1), p.678.
[18]. Markosyan, N., Li, J., Sun, Y.H., Richman, L.P., Lin, J.H., Yan, F., Quinones, L., Sela, Y., Yamazoe, T., Gordon, N. and Tobias, J.W., 2019. Tumor cell–intrinsic EPHA2 suppresses antitumor immunity by regulating PTGS2 (COX-2). The Journal of clinical investigation, 129(9), pp.3594-3609.
Cite this article
Liang,J.;Peng,X. (2024). Identification of key genes and immune infiltration modulated in insomnia by integrated bioinformatics analysis and mendelian randomization study. Theoretical and Natural Science,37,214-225.
Data availability
The datasets used and/or analyzed during the current study will be available from the authors upon reasonable request.
Disclaimer/Publisher's Note
The statements, opinions and data contained in all publications are solely those of the individual author(s) and contributor(s) and not of EWA Publishing and/or the editor(s). EWA Publishing and/or the editor(s) disclaim responsibility for any injury to people or property resulting from any ideas, methods, instructions or products referred to in the content.
About volume
Volume title: Proceedings of the 2nd International Conference on Environmental Geoscience and Earth Ecology
© 2024 by the author(s). Licensee EWA Publishing, Oxford, UK. This article is an open access article distributed under the terms and
conditions of the Creative Commons Attribution (CC BY) license. Authors who
publish this series agree to the following terms:
1. Authors retain copyright and grant the series right of first publication with the work simultaneously licensed under a Creative Commons
Attribution License that allows others to share the work with an acknowledgment of the work's authorship and initial publication in this
series.
2. Authors are able to enter into separate, additional contractual arrangements for the non-exclusive distribution of the series's published
version of the work (e.g., post it to an institutional repository or publish it in a book), with an acknowledgment of its initial
publication in this series.
3. Authors are permitted and encouraged to post their work online (e.g., in institutional repositories or on their website) prior to and
during the submission process, as it can lead to productive exchanges, as well as earlier and greater citation of published work (See
Open access policy for details).
References
[1]. Riemann, D., Spiegelhalder, K., Feige, B., Voderholzer, U., Berger, M., Perlis, M. and Nissen, C., 2010. The hyperarousal model of insomnia: a review of the concept and its evidence. Sleep medicine reviews, 14(1), pp.19-31.
[2]. Kramer, M., 2000. Hypnotic medication in the treatment of chronic insomnia: non nocere! Doesn’t anyone care?. Sleep Medicine Reviews, 4(6), pp.529-541.
[3]. Hu, J., Teng, J., Wang, W., Yang, N., Tian, H., Zhang, W., Peng, X. and Zhang, J., 2021. Clinical efficacy and safety of traditional Chinese medicine **ao Yao San in insomnia combined with anxiety. Medicine, 100(43), p.e27608.
[4]. Piber, D., Cho, J.H., Lee, O., Lamkin, D.M., Olmstead, R. and Irwin, M.R., 2022. Sleep disturbance and activation of cellular and transcriptional mechanisms of inflammation in older adults. Brain, Behavior, and Immunity, 106, pp.67-75.
[5]. Ritchie, M.E., Phipson, B., Wu, D.I., Hu, Y., Law, C.W., Shi, W. and Smyth, G.K., 2015. limma powers differential expression analyses for RNA-sequencing and microarray studies. Nucleic acids research, 43(7), pp.e47-e47.
[6]. Ritchie, M.E., Phipson, B., Wu, D.I., Hu, Y., Law, C.W., Shi, W. and Smyth, G.K., 2015. limma powers differential expression analyses for RNA-sequencing and microarray studies. Nucleic acids research, 43(7), pp.e47-e47.
[7]. Wu, T., Hu, E., Xu, S., Chen, M., Guo, P., Dai, Z., Feng, T., Zhou, L., Tang, W., Zhan, L.I. and Fu, X., 2021. clusterProfiler 4.0: A universal enrichment tool for interpreting omics data. The innovation, 2(3).
[8]. Mering, C.V., Huynen, M., Jaeggi, D., Schmidt, S., Bork, P. and Snel, B., 2003. STRING: a database of predicted functional associations between proteins. Nucleic acids research, 31(1), pp.258-261.
[9]. Smoot, M.E., Ono, K., Ruscheinski, J., Wang, P.L. and Ideker, T., 2011. Cytoscape 2.8: new features for data integration and network visualization. Bioinformatics, 27(3), pp.431-432.
[10]. Li, C. and Xu, J., 2019. Feature selection with the Fisher score followed by the Maximal Clique Centrality algorithm can accurately identify the hub genes of hepatocellular carcinoma. Scientific Reports, 9(1), p.17283.
[11]. Calcagno, V. and de Mazancourt, C., 2010. glmulti: an R package for easy automated model selection with (generalized) linear models. Journal of statistical software, 34, pp.1-29.
[12]. Chen, B., Khodadoust, M.S., Liu, C.L., Newman, A.M. and Alizadeh, A.A., 2018. Profiling tumor infiltrating immune cells with CIBERSORT. Cancer Systems Biology: Methods and Protocols, pp.243-259.
[13]. Yu, G., Smith, D.K., Zhu, H., Guan, Y. and Lam, T.T.Y., 2017. ggtree: an R package for visualization and annotation of phylogenetic trees with their covariates and other associated data. Methods in Ecology and Evolution, 8(1), pp.28-36.
[14]. Elsworth, B., Lyon, M., Alexander, T., Liu, Y., Matthews, P., Hallett, J., Bates, P., Palmer, T., Haberland, V., Smith, G.D. and Zheng, J., 2020. The MRC IEU OpenGWAS data infrastructure. BioRxiv, pp.2020-08.
[15]. Hemani, G., Zheng, J., Elsworth, B., Wade, K.H., Haberland, V., Baird, D., Laurin, C., Burgess, S., Bowden, J., Langdon, R. and Tan, V.Y., 2018. The MR-Base platform supports systematic causal inference across the human phenome. elife, 7, p.e34408.
[16]. Abbas, A.K., Trotta, E., R. Simeonov, D., Marson, A. and Bluestone, J.A., 2018. Revisiting IL-2: Biology and therapeutic prospects. Science immunology, 3(25), p.eaat1482.
[17]. Yang, B., Li, M., Tang, W., Liu, W., Zhang, S., Chen, L. and ** point of hepatocellular carcinoma. Nature communications, 9(1), p.678.
[18]. Markosyan, N., Li, J., Sun, Y.H., Richman, L.P., Lin, J.H., Yan, F., Quinones, L., Sela, Y., Yamazoe, T., Gordon, N. and Tobias, J.W., 2019. Tumor cell–intrinsic EPHA2 suppresses antitumor immunity by regulating PTGS2 (COX-2). The Journal of clinical investigation, 129(9), pp.3594-3609.