


1. Introduction
Beginning from the industrial era, there has been an increasing trend of atmospheric carbon dioxide observed due to factors including the combustion of fossil fuels, and land use change. According to data reported by the National Oceanic and Atmospheric Administration’s (NOAA) observatory, the most recent measurement of atmospheric carbon dioxide has an average concentration of 420.99 parts per million (ppm) [1], indicating an increase of 280 ppm compared to the start of the industrial revolution, representing a 30% increase in atmospheric carbon dioxide level within 60 years [2]. Moreover, the Intergovernmental Panel on Climate Change’s (IPCC) estimation suggested that the atmospheric carbon dioxide level would possibly approach 800 ppm at the end of the 21st century if the emission state of affairs is business as usual [3]. In addition to impeding infrared radiation and leading to global warming, the upsurge of atmospheric carbon dioxide also greatly impacts the marine ecosystem by influencing the ocean's chemistry [4]. Ocean biogeochemical models indicate that there is an expected 150% increase in ocean acidity at the end of the 21st century compared to the start of the industrial era, implying that according to the IPCC A2 scenario, ocean surface's pH level will decrease from around 8.2 before industrialization to around 7.8 [5].
The primary cause of the decreasing ocean pH is the ocean's ability to uptake around a third of anthropogenic carbon in the atmosphere, affecting the CO2 concentration increase in the atmosphere [6]. However, as mentioned above, the current atmospheric carbon dioxide level is continuously reaching new highs, altering the ocean's fundamental chemical balances, and leading to a decrease in ocean pH, known as ocean acidification [7]. As human activities change the ocean chemistry, all marine organisms can be affected to different extents and adapted to new living ecosystems with different approaches [8]. Due to some special physiological properties, however, some organisms are more vulnerable and sensitive to the changing ocean chemistry. Many past studies suggest a negative correlation between ocean acidification and the calcification (CaCO3 precipitation) process [9], [10].
Coral reefs, which cover only 0.2% of the sea floor while providing habitat to over 25% of marine species, are one of the marine animals affected by ocean acidification [11]. The calcification process of both cold-water and warm-water hard corals depends on the secretion of calcium carbonate skeletons, these form coral reefs, which are habitats to a range of marine organisms, over time. Even though Fisher et al’s study in 2015 suggested that the rate of calcification in hard corals is high enough to withstand a high level of bioerosion and wave-driven physical erosion, there is strong experimental evidence indicating that even the high rate of calcareous structure construction in hard corals will be affected significantly [12]. Recent studies into the response of pH of the internal calcifying fluid, where the coral skeleton forms, to the amount of dissolved organic carbon, suggested an evolving but not yet comprehensive understanding [13]. On the other hand, Wood et al’s study in 2008 used the ophiuroid brittlestar Amphiura Filiformis as a model, their finding suggested that the rate of metabolism and calcification may increase as a result of ocean acidification for certain calcifying marine organisms, opposing previous studies [14].
As in the available data and past research, ocean acidification has been studied in depth from diverse perspectives. However, some fields of study remain contradictory and inadequate. Despite the specific study on different types of hard coral’s acclimation to ocean acidification, minimal studies focused on the general regional effect of ocean acidification and how regions with different ocean acidity can affect hard coral reefs in the Caribbean region, East Asian Seas region, Pacific region, South Asia region, and Gulf of Oman region. The objectives of this paper are to i) investigate the relationship between atmospheric carbon dioxide, air-sea Flux, and ocean pH level. ii) analyze the potential impact of changing ocean surface pH on hard coral reefs.
2. Data and materials
2.1. Database
The hard coral coverage data in terms of percentage in coastal regions is obtained from the Global Coral Reef Monitoring Network (GCRMN) created by the International Coral Reef Initiative (ICRI). The data collection was initiated in 1978, and the annual recordings started in 1983, and are currently updated to 2019. The coverage is calculated through a Bayesian hierarchical modeling methodology where individual statistical models have been integrated at increasing geographical scales. Further explanation of the methodology can be found in Status of Coral Reefs of the World: 2020. The global average annual atmospheric CO2 data is obtained from the calculated monthly global average provided by the Global Monitoring Laboratory. This data is taken from 1959 to 2022. The Global Monitoring Laboratory constructs the global average by modeling a line of best fit of time to all monitoring sites, then plotting the modeled functions of individual sites to a function of latitude for 48 equal time steps per year. A product that reconstructs the global surface ocean on a 0.25° x 0.25° regular grid and corresponds to a REP L4 time series is used to determine the ocean regional average annual surface downward mass flux of carbon dioxide expressed as carbon from 1985-2021. The Surface Ocean CO₂Atlas (SOCAT) database is used for this product. The regional 6th version of the Surface Ocean CO2 Atlas and temporal trends specific oceanic sites scattered globally derived from Earth System Model version 2M (ESM2M) is used for both historical and predicted ocean surface pH under the Representative Concentration Pathway (RCP) model.
2.2. Research area
The GCRMN network system includes in total 10 distinct regional nodes. This paper selected 5 regions (figure 1) as subjects of research. The regions are defined as the Caribbean region 26,397km2, East Asian Seas 78,272km2, Pacific region 69,424km2, South Asia region 10,949km2, and Gulf of Oman region 2,009km2. All regional-based data (surface downward mass flux, historical and predicted ocean surface pH with the RCP model) follow the region defined by hard coral coverage—-the five regional nodes by GCRMN.
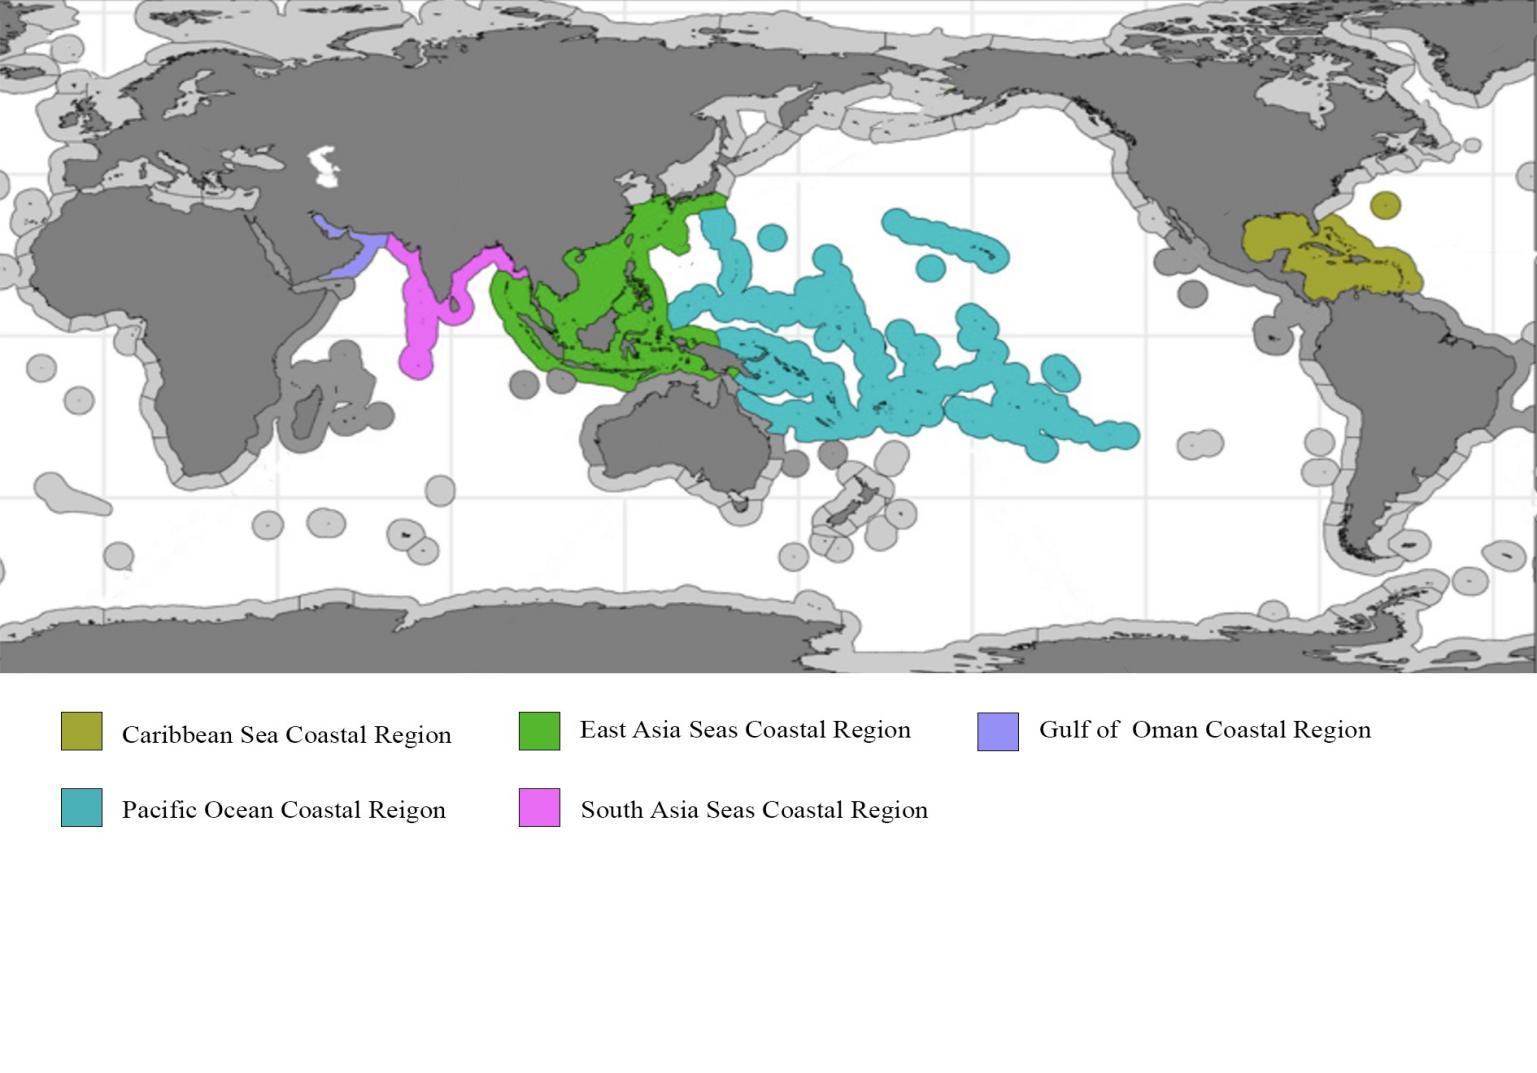
Figure 1. Five ocean coastal regions: the Caribbean Sea, East Asia Seas, Gulf of Oman, Pacific Ocean, and South Asia Seas are marked by different colors shown on the map. Map edited from Status of Coral Reefs of the World: 2020 Chapter 2 [15].
2.3. RCP scenarios
The RCP model, named after the 2100 radiative forcing target level, is created through the collaboration of Integrated assessment modeling and the Climate Model community aiming to provide a more comprehensible database [16]. The four scenarios included in the RCP model are chosen to have high literature significance: a scenario of low forcing level (RCP2.6), a scenario of medium forcing levels (RCP4.5, RCP6.0), and a scenario of high forcing level (RCP8.5) [17]. All four models will be used repetitively in this study as a reference to potential future trends in variables.
3. Increase of atmospheric carbon dioxide emission leads to ocean acidification
Within a year, the air-sea gas exchange can bring surface water CO2 concentration and atmospheric CO2 concentrations to equilibrium. The CO2 gas then reacts with the water molecules to form carbonic acids (H2CO3); carbonic acids dissociate into hydrogen ions, forming bicarbonate (HCO3−) and carbonate ions (CO3 2−) [18]. With reference to surface seawater with an approximate pH of 8.1, the composition of inorganic carbon is distributed with 90% being bicarbonate ion, 9% being carbonate ion, and 1% of dissolved CO2 [18]. The constant anthropogenic carbon intake increases the concentrations of hydrogen ions, bicarbonate, and CO2; referring to the relationship between pH and hydrogen ions:
pH= -log10[H+](1)
as the hydrogen ion concentration increases, the ocean pH decreases [19].
| Figure 2. Average annual atmospheric carbon dioxide (ppm) and ocean regional: Caribbean Sea, South Asia Seas, East Asian Sea, Pacific Ocean, Gulf of Oman average annual surface downward mass flux of carbon dioxide expressed as carbon (molC/m2/yr). Annual atmospheric carbon dioxide calculated from The Global Monitoring Laboratory measured monthly mean carbon dioxide globally averaged over marine surface site data from 1959 to 2022, following the left vertical scale measured in mole fraction expressed as ppm [20]. Ocean regional average annual surface downward mass flux of carbon dioxide expressed as carbon from 1985 to 2021 follows the right vertical scale [21]. Full data access at https://doi.org/10.5281/zenodo.10408298. |
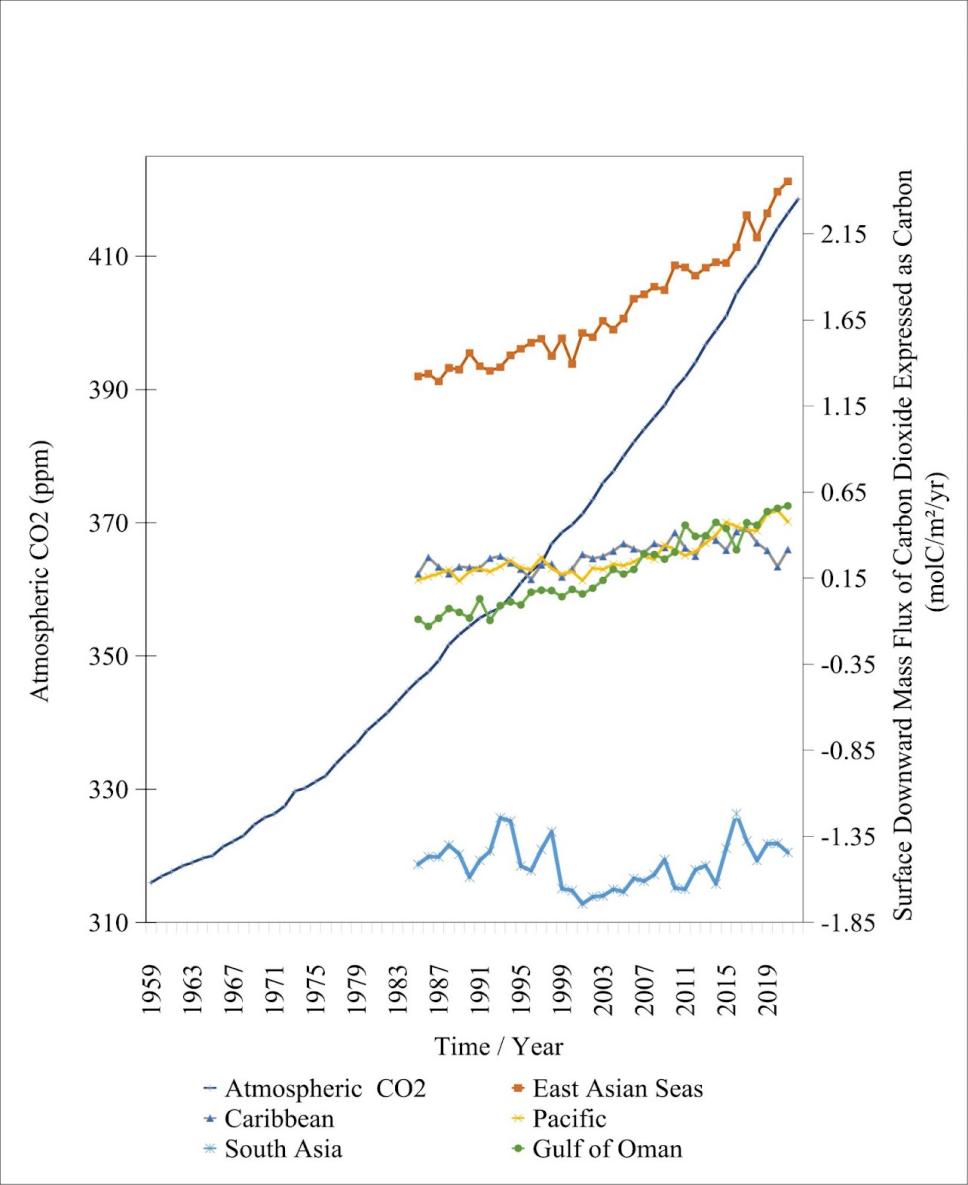
Corresponding to the steadily increasing atmospheric carbon dioxide level starting from 1959 (figure 2), the annual surface downward mass flux of carbon dioxide in all regions observed has suggested an increasing trend line in different degrees.
Table 1. The mean relative increase (%) between seven-year intervals and overall surface downward flux of carbon dioxide expressed as carbon of five regions studies.
Comparison | Mean Relative Increase (%) Between Seven-Year Intervals | ||||
East Asian Seas | Caribbean | Pacific | South Asia | Gulf of Oman | |
1985-1992 | 2.4825810 | 51.9226159 | 35.7138779 | 5.0354339 | -6.3689559 |
1993-1999 | 12.2006169 | -43.6762529 | -20.4736700 | -33.1219726 | 551.4686611 |
2000-2006 | 27.2569278 | 57.3342183 | 29.2945275 | 4.2606200 | 136.7621453 |
2007-2013 | 8.5847742 | 33.7882861 | 27.1714959 | 5.6032691 | 36.0737199 |
2014-2020 | 20.6577390 | -41.7716648 | 35.7254527 | 14.4568628 | 17.1177376 |
1985-2021 | 85.8086874 | 81.3098423 | 245.9161084 | 4.5685606 | 735.8804359 |
As shown in figure 2, the East Asian Sea had the highest level of surface downward mass flux between the years 1985 to 2021; the Caribbean Ocean, Pacific Ocean, and South Asia Seas showed a competing level of surface downward mass flux with each other, and the Gulf of Oman is significantly lower than any other regions. As shown in table 1, the Gulf of Oman has experienced the highest overall mean relative increase in the surface downward mass flux of around 735.88%. One factor contributing to this significant increase is the comparatively high air-sea CO2 flux in specific atmospheric regions around the Gulf of Oman (figure 3), directly contributing to the increasing carbon dioxide flux. South Asia Seas, on the other hand, have experienced the highest degree of flux fluctuation, there are both significant relative increases and decreases. The carbon dioxide flux level reached its peak in the South Asian Seas in the years 1993, 1998, and 2016 following a sudden drop, suggesting an unstable ocean downward mass flux without a clear trendline.
The regional differences in surface downward mass flux are influenced by variations in atmospheric CO2 levels. Figure 2 represents the average global atmospheric CO2, but it doesn't account for the uneven distribution of CO2 across the globe. Similarly, the regional data is also obtained by taking the regional average, so the overall trend may not fully reflect the situation in the area.
| Figure 3. The monthly average ocean regional potential of hydrogen (pH) (a) and air-sea CO2 flux (106gC/km2/year release) (b) confined to 2022 December; both data taken from the Japan Meteorological Agency (JMA) Ocean CO2 Map data [22]. |
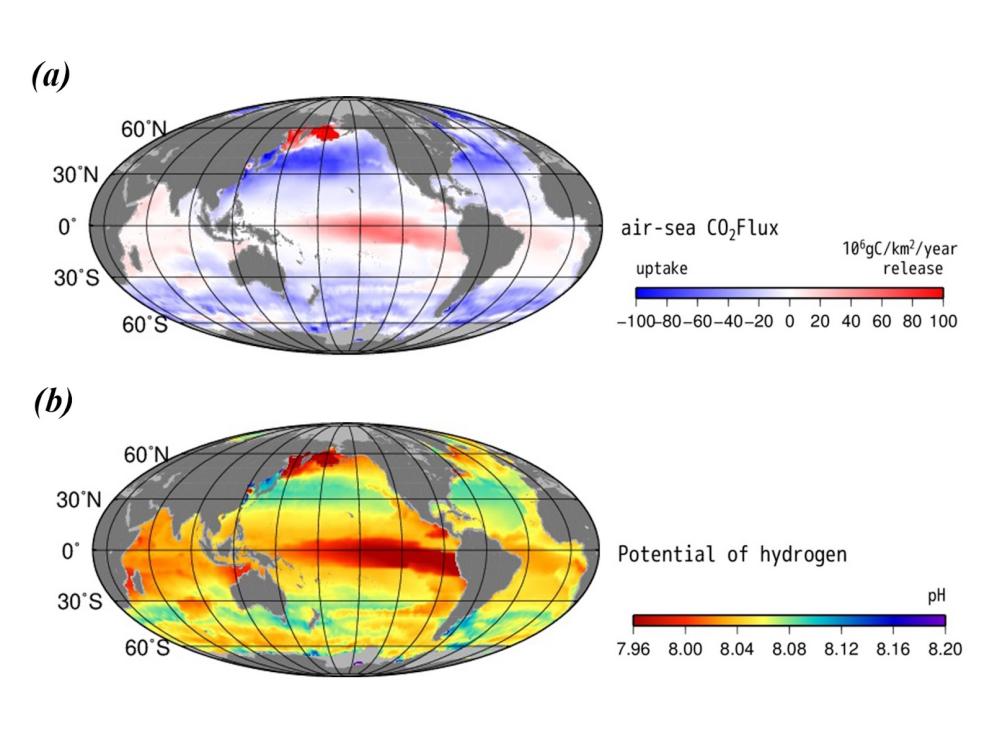
Using the Pacific Ocean as an example, figure 3 suggests that the air-sea Flux of carbon dioxide is highest at the east-central equatorial Pacific, corresponding to the lowest pH. However, other parts of the Pacific Ocean have a low air-sea Flux, skewing the average to a comparatively low average trend line shown in figure 2. In the study of Shinoda et al. (2019), they explained this phenomenon as the result of atmospheric rivers in the northeast Pacific that are associated with strong winds moving the surface current [23].
Figure 3 indicates a strong correlation between the level of air-sea Flux and the pH in marine regions. The regions with a high level of air-sea Flux all demonstrated low pH levels, meaning higher acidity. This is concerning for the marine ecosystem as air-sea Flux increases overall with the atmospheric carbon dioxide, leading to increasing acidity.
4. The impact of ocean acidification on coral reefs
Under the synchronous increase in ocean warming and ocean acidification, the ability of the majority of hard corals to deposit CaCO3 skeletons is limited to a great extent [24]. Corals that experienced ocean acidification during their juvenile stages are also limited in their ability to recover in later stages, weakening coral's three-dimensional framework and making the reefs more vulnerable to mechanical and physical erosion [25]. Therefore, the long-term exposure of coral reefs to acidifying water may decrease the overall biodiversity. One of the factors that may cause ocean acidity to have a varying degree of damage to local hard corals is the regional varying surface ocean pH (figure 5).
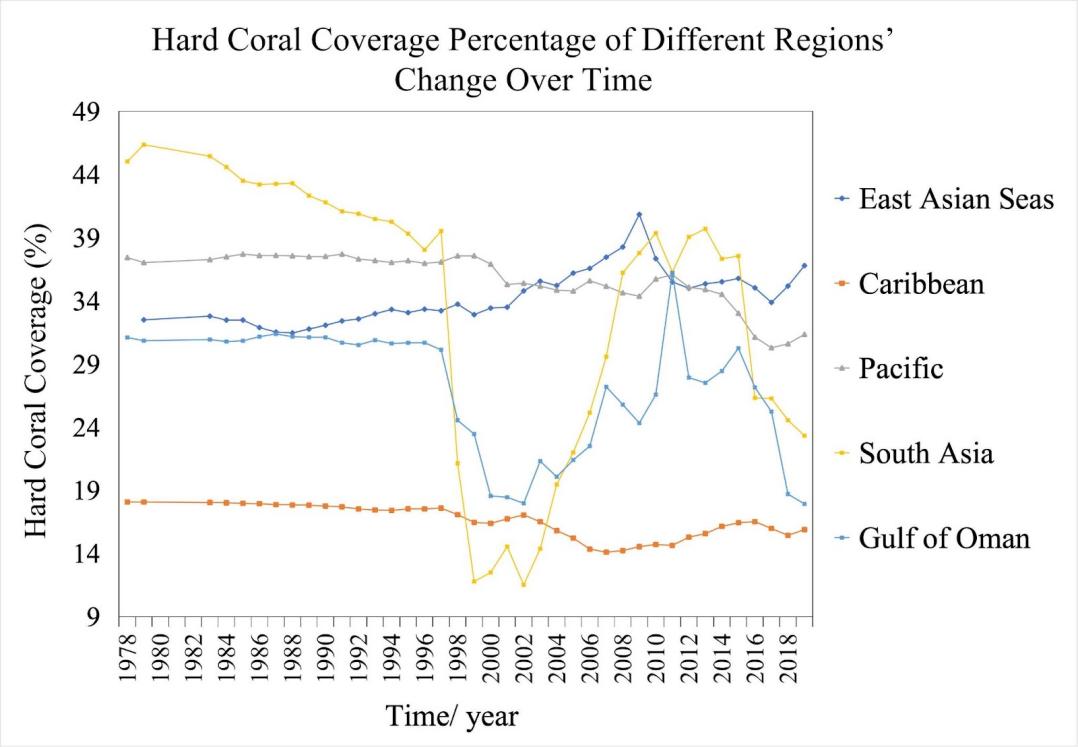
Figure 4. The annual average hard coral coverage (%) of different coastal regions from 1978: East Asian Seas, dark blue; Caribbean, orange; Pacific, gray; South Asia, yellow; Gulf of Oman, light blue. Hard coral coverage data taken from Souter et al [15]. Full data access at https://doi.org/10.5281/zenodo. 10410322.
In the five regions observed in figure 4, the fluctuations in hard coral coverage level are a strong indicator of the stability of the ocean. Hard coral coverage remained relatively constant in four out of five regions, excluding South Asia, during the period 1978-1997 with no significant increase or decrease; the hard coral coverage in the South Asia coastal region consistently decreased at an average annual rate of 0.29% from 1978 (45.45%) to 1997 (39.53) (table 2). After 1997 and until the last recorded year of 2019, all five regions' hard coral coverage experienced fluctuations and some experienced more dramatic change than others. This demonstrated that even under the local stressor of increasing ocean acidity, coral reefs were resilient to the globally decreasing ocean pH. However, as the atmospheric carbon dioxide increased consistently (figure 2), the progressively acidifying ocean reached the threshold limit of hard coral’s capability to withstand environmental change, causing the global hard corals to decline after 1997.
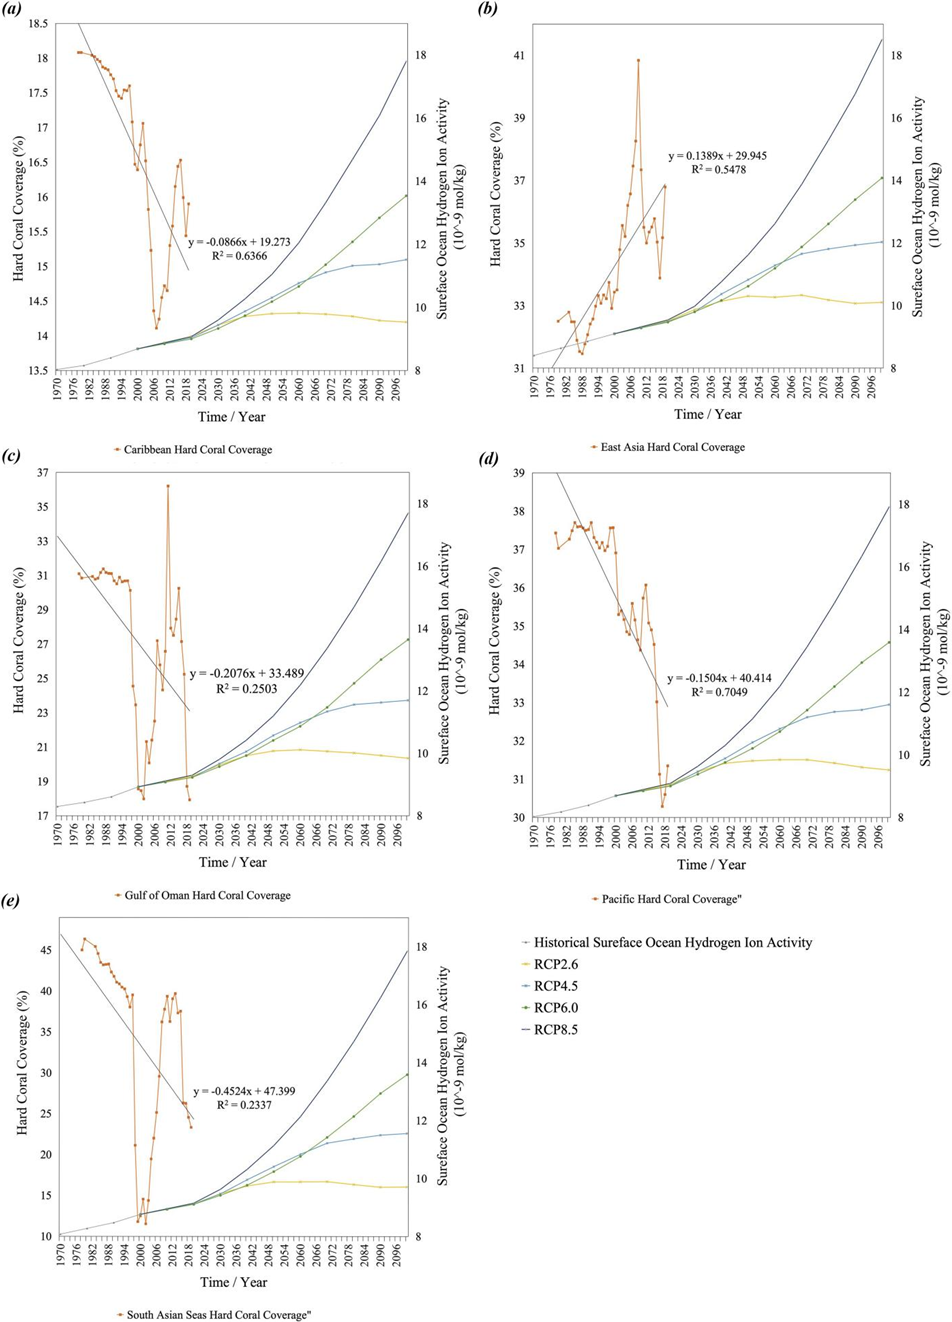
Figure 5. Historical ocean surface pH (10-9 mol/kg) and future prediction with RCP model projections of 8.5, 6.0, 4.5, and 2.6 in defined regions and coastal hard coral coverage (%) in defined regions [15]. Both past and predicted ocean surface pH were taken from NCEI Accession 0206289 [26]. Regions include the Caribbean Sea (a): https://doi.org/10.5281/zenodo.10417041, East Asian Seas (b): https://doi.org/10.5281/zenodo.10417023, Gulf of Oman (c): https://doi.org/10.5281/zenodo.10417061, Pacific Ocean (d): https://doi.org/10.5281/zenodo. 10417047, and South Asian Seas (e): https://doi.org/10.5281/zenodo.10417049.
All the historical trends of regional surface pH suggested an increasing trend, and even under the lowest RCP 2.6, it will continue to increase for the next 20 years (figure 5). The levels of historical surface ocean hydrogen activity for different regions are similar, and the future RCP prediction patterns are also similar. The surface pH under the RCP 4.5 model for all regions exceeded the RCP 6.0 for the first 60 years since the start of prediction. As a more constant high atmospheric CO2 emission level continues, the surface pH under RCP 6.0 will slowly exceed the RCP 4.5 model after 60 years. Despite the similar trend and pattern in both historical and future surface pH levels in all ocean regions observed, their coastal hard coral coverage variation can diverge greatly.
Table 2. The average annual change in hard coral coverage between 1978-1997, four 5 year comparisons starting from 1997, and overall comparison. There is no recorded data available for hard coral coverage for East Asian Seas in the year 1978, so the data for 1979 is used for East Asian Seas.
Comparison | Average Annual Change in Hard Coral Coverage (%) | ||||
East Asian Seas | Caribbean | Pacific | South Asia | Gulf of Oman | |
1978-1997 | 0.040 | -0.025 | -0.018 | -0.289 | -0.051 |
1997-2002 | 0.314 | -0.108 | -0.336 | -5.600 | -2.430 |
2002-2007 | 0.534 | -0.590 | -0.048 | 3.610 | 1.844 |
2007-2012 | -0.492 | 0.238 | -0.016 | 1.896 | 0.146 |
2012-2017 | -0.224 | 0.138 | -0.958 | -2.558 | -0.538 |
1978-2019 | 0.102 | -0.051 | -0.141 | -0.505 | -0.306 |
The seven-year intervals are chosen to better reflect the change in hard coral coverages of different regions, within seven years, the tendency of change in hard coral reefs’ coverage is mostly consistent for all regions. The historical surface ocean hydrogen ion activity level from 1970 to 2000 ranged between 8 and 10 E-9 mol/kg for all regions. The similar trend in RCP prediction implied that as the global emission changes in the future, the regional surface ocean pH may vary accordingly and the regional difference will be within a predictable and limited range. The performance of coastal hard coral coverage in different regions, however, may vary greatly. From 1997 to 2002, the East Asian Seas were the only region that experienced an increase in hard coral coverage, its hard coral coverage from 33.22% to 34.97% at an annual rate of 0.314%. The other four regions’ hard coral all suggested a decline; the South Asia regions experienced the most severe decrease, dropping from the highest coverage within the five of 39.53% in 1997 to the least in five of 11.53% coverage in 2002. The significant annual decrease of 5.600% from 1997-2002 in the South Asia region contrasted greatly with the Eastern Asian coastal regions, suggesting that surface ocean hydrogen ion activity may not be the primary factor influencing the change in hard coral coverage. Other comparisons of periods in table 2 also demonstrated low consistency in the horizontal comparison, the trend in hard coral coverage can vary greatly between regions in any given period and suggested low dependence on the regional surface ocean pH.
5. Discussion
In the previous sections, it is shown that the consistently increasing atmospheric carbon dioxide can lead to an overall increase in the downward flux of carbon, causing ocean acidification. More specifically, variations in regional air-sea flux levels can contribute to differences in regional ocean pH levels. However, further analysis of the surface ocean pH and coastal hard coral coverage suggested a limited correlation. Fluctuations and patterns observed in both comparisons across different regions (horizontal) and different periods (vertical) cannot be completely explained by changes in surface ocean pH. Through the more comprehensive background research in specific ocean regions, it is thought that the impact of surface pH is overshadowed by other major factors affecting the regional hard coral coverage.
These factors may include ocean warming, sedimentation, and localized disturbance events (e.g., groundwater discharge) can all contribute to large-scale coral bleaching and mortality [11], [27]. For instance, the two major and sudden drops in hard coral coverage in 1998 and 2016 in South Asia are related to the El Niño coral bleaching events [11]. These unpredictable natural phenomena, accompanied by warm ocean streams, can induce heat stress on coral reefs, ultimately leading to large-scale coral bleaching [28]. These factors have a more substantial impact on the regional hard coral coverage surpassing the potential damage of ocean acidity.
Furthermore, another limitation of the study is the availability of certain data used and the unmatching periods of data collection for the two variables in comparison. The hard coral coverage data from Souter et al used for figure 5 recorded the regional change from 1978 to 2019 [15]; the surface ocean hydrogen activity measure from NCEI [26], on the other hand, recorded and predicted from the year 1970 to 2011 with a ten-year interval between each data point. The substantial difference in time periods and the relatively long intervals between surface ocean hydrogen ion activity measures result in fewer than three data points from the same year for the two variables to be compared. This caused the analysis to be less accurate and reliable, the short period of intersection may not be enough to reflect the long-term correlation between the two chosen variables.
Retrospecting the increasing atmospheric carbon dioxide concentration, neither the amplitude nor the derivative can be understood and interpreted comprehensively without the context of the earth's naturally occurring atmospheric carbon dioxide fluctuation. Successful reconstruction of past atmospheric CO2 concentrations from Antarctic ice cores, as suggested by Delmas et al. (1980), reveals a clear pattern of CO2 level increases during glacial to interglacial transitions and vice versa. By using paleoclimate data as a baseline, we observe that the post-industrial rise in CO2 levels occurred during glacial to interglacial transitions, suggesting that Earth's natural phenomena may contribute to the rapid increase in atmospheric CO2 [20].
6. Conclusion
Overall, the ongoing uncontrolled carbon dioxide emissions are contributing to the destabilization of the Earth's current atmospheric and oceanic conditions, leading to a fundamental change in the ecosystem. Without immediate action to limit greenhouse gas emissions, irreversible and unpredictable changes in the marine system are projected to occur in the mid to late century [29]. Ocean acidification can potentially impact the coral reef system in terms of coral's ability to provide habitat for marine organisms, moderate local shoreline erosion, and nutrient value to human communities [30]. Various solutions can be considered for addressing the current issue in the future, such as moderating the unstable atmospheric CO2 concentration. Coral reefs can acclimate to changing living conditions and maximize their resilience to stressors such as ocean acidification only under a stabilized and growing environment. Another possibility is to improve and strengthen fisheries management, which has been causing damage to reef structures during fishing practices [31]. However, without consistent and immediate actions taken to protect the coral reef ecosystems from ocean acidification, neither of the solutions can be achieved, and the ecological damage can be permanent.
References
[1]. Carbon dioxide now more than 50% higher than pre-industrial levels. (2022, June 3). Noaa.gov. https://www.noaa.gov/news-release/carbon-dioxide-now-more-than-50-higher-than-pre-industrial-levels
[2]. Hoegh-Guldberg O, Poloczanska ES, Skirving W and Dove S (2017) Coral Reef Ecosystems under Climate Change and Ocean Acidification. Front. Mar. Sci. 4:158. doi: 10.3389/fmars.2017.00158
[3]. IPCC. (2000). IPCC SPECIAL REPORT EMISSIONS SCENARIOS Emissions Scenarios. https://www.ipcc.ch/site/assets/uploads/2018/03/sres-en.pdf
[4]. Raven, J. (2005). The Royal Society. Royalsociety.org. https://royalsociety.org/-/media/Royal_Society_Content/policy/publications/2005/9634.pdf
[5]. FEELY, R. A., DONEY, S. C., & COOLEY, S. R. (2009). Ocean Acidification: Present Conditions and Future Changes in a High-CO₂ World. Oceanography, 22(4), 36–47. http://www.jstor.org/stable/24861022
[6]. Sabine, Christopher L et al. “The oceanic sink for anthropogenic CO2.” Science (New York, N.Y.) vol. 305,5682 (2004): 367-71. doi:10.1126/science.1097403
[7]. Henderson, C. (2006, August 2). Ocean acidification: the other CO2 problem. New Scientist; New Scientist. https://www.newscientist.com/article/mg19125631-200-ocean-acidification-the-other-co2-problem/
[8]. Pörtner, Hans-Otto. (2008). Ecosystem effects of ocean acidification in times of ocean warming: A physiologist's view. Marine Ecology-progress Series - MAR ECOL-PROGR SER. 373. 203-217. 10.3354/meps07768.
[9]. Kleypas, JA et al. “Geochemical consequences of increased atmospheric carbon dioxide on coral reefs.” Science (New York, N.Y.) vol. 284,5411 (1999): 118-20. doi:10.1126/science.284.5411.118
[10]. Gattuso, J.-P., Allemand, D., & Frankignoulle, M. (1999). Photosynthesis and Calcification at Cellular, Organismal and Community Levels in Coral Reefs: A Review on Interactions and Control by Carbonate Chemistry. American Zoologist, 39(1), 160–183. http://www.jstor.org/stable/3884234
[11]. Souter, D., Planes, S., Wicquart, J., Logan, M., Obura, D., & Staub, F. (2020). Status of Coral Reefs of the World: 2020. https://gcrmn.net/wp-content/uploads/2023/01/Status-of-Coral-Reefs-of-the-World-2020-Full-Report.pdf
[12]. Fisher, R., O’Leary, R. A., Low‐Choy, S., Mengersen, K., Knowlton, N., Brainard, R. E., & M. Julian Caley. (2015). Species Richness on Coral Reefs and the Pursuit of Convergent Global Estimates. Current Biology, 25(4), 500–505. https://doi.org/10.1016/j.cub.2014.12. 022
[13]. Comeau S., Tambutté E., Carpenter R. C., Edmunds P. J., Evensen N. R., Allemand D., Ferrier-Pagès C., Tambutté S. and Venn A. A. 2017. Coral calcifying fluid pH is modulated by seawater carbonate chemistry not solely seawater pH. Proc. R. Soc. B.2842016166920161669. http://doi.org/10.1098/rspb.2016.1669
[14]. Wood, H. L., Spicer, J. I., & Widdicombe, S. (2008). Ocean acidification may increase calcification rates, but at a cost. Proceedings. Biological sciences, 275(1644), 1767–1773. https://doi.org/10.1098/rspb.2008.0343
[15]. Souter, D., Planes, S., Wicquart, J., Logan, M., Obura, D., & Staub, F. (n.d.). Status of Coral Reefs of the World: 2020 Chapter 2. Status of Coral Reefs of the World. https://gcrmn.net/wp-content/uploads/2022/05/Chapter-2.-Status-of-Coral-Reefs-of-the-World.pdf
[16]. Van Vuuren, D., Feddema, J., Lamarque, J.-F., Riahi, K., Rose, S., Smith, S., & Hibbard, K. (n.d.). Work plan for data exchange between the Integrated Assessment and Climate 1 Modeling community in support of Phase-0 of scenario analysis for climate change 2 assessment (Representative Community Pathways). https://pcmdi.llnl.gov/mips/cmip5/docs/RCP_ handshake.pdf
[17]. Van Vuuren, D.P., Edmonds, J., Kainuma, M. et al. The representative concentration pathways: an overview. Climatic Change 109, 5 (2011). https://doi.org/10.1007/s10584-011-0148-z
[18]. Doney, S. C., Fabry, V. J., Feely, R. A., & Kleypas, J. A. (2009). Ocean acidification: the Other CO2 Problem. Annual Review of Marine Science, 1(1), 169–192. https://doi.org/10.1146/annurev.marine.010908.163834
[19]. Orr, J., Fabry, V., Aumont, O. et al. Anthropogenic ocean acidification over the twenty-first century and its impact on calcifying organisms. Nature 437, 681–686 (2005). https://doi.org/10.1038/nature04095
[20]. US. (2023). Global Monitoring Laboratory - Carbon Cycle Greenhouse Gases. Noaa.gov. https://gml.noaa.gov/ccgg/trends/global.html
[21]. Tuyet, T., Gehlen, M., & Chevallier, F. (2020). Global ocean surface carbon product. HAL (Le Centre Pour La Communication Scientifique Directe). https://doi.org/10.48670/moi-00047
[22]. Japan Meteorological Agency|Carbon dioxide uptake mapping animation. (2023). Jma.go.jp. https://www.data.jma.go.jp/gmd/kaiyou/english/co2_flux/co2_flux_animation_en.html
[23]. Shinoda, T., Zamudio, L., Guo, Y., Metzger, E. J., & Fairall, C. W. (2019). Ocean variability and air-sea fluxes produced by atmospheric rivers. Scientific reports, 9(1), 2152. https://doi.org/10.1038/s41598-019-38562-2
[24]. Dove, S. G., Kline, D. I., Pantos, O., Angly, F. E., Tyson, G. W., & Hoegh-Guldberg, O. (2013). Future reef decalcification under a business-as-usual CO2 emission scenario. Proceedings of the National Academy of Sciences of the United States of America, 110(38), 15342–15347. https://doi.org/10.1073/pnas.1302701110
[25]. Eyre, B. D., Cyronak, T., Drupp, P., De Carlo, E. H., Sachs, J. P., & Andersson, A. J. (2018). Coral reefs will transition to net dissolving before end of century. Science (New York, N.Y.), 359(6378), 908–911. https://doi.org/10.1126/science.aao1118
[26]. Jiang, Li-Qing; Carter, Brendan R.; Feely, Richard A.; Lauvset, Siv K.; Olsen, Are (2019). Global surface ocean pH, acidity, and Revelle Factor on a 1x1 degree global grid from 1770 to 2100 (NCEI Accession 0206289). NOAA National Centers for Environmental Information. Dataset. https://doi.org/10.25921/kgqr-9h49.
[27]. Osborne, K., Dolman, A. M., Burgess, S. C., & Johns, K. A. (2011). Disturbance and the dynamics of coral cover on the Great Barrier Reef (1995-2009). PloS one, 6(3), e17516. https://doi.org/10.1371/journal.pone.0017516
[28]. Stone, L., Huppert, A., Rajagopalan, B., Bhasin, H., & Loya, Y. (1999). Mass Coral Reef Bleaching: A Recent Outcome of Increased El Niño Activity?. Ecology letters, 2(5), 325–330. https://doi.org/10.1046/j.1461-0248.1999.00092.x
[29]. J.-P. Gattuso et al. ,Contrasting futures for ocean and society from different anthropogenic CO2 emissions scenarios.Science349,aac4722(2015).DOI:10.1126/science.aac4722
[30]. Ove Hoegh‐Guldberg, Pendleton, L. H., & Kaup, A. (2019). People and the changing nature of coral reefs. Regional Studies in Marine Science, 30, 100699–100699. https://doi.org/10.1016/j.rsma.2019.100699
[31]. Cramer, K., O’Dea, A., Clark, T. et al. Prehistorical and historical declines in Caribbean coral reef accretion rates driven by loss of parrotfish. Nat Commun 8, 14160 (2017). https://doi.org/10.1038/ncomms14160
Cite this article
Li,R. (2024). Increasing impacts of ocean acidification on coral reefs under global warming. Theoretical and Natural Science,37,226-236.
Data availability
The datasets used and/or analyzed during the current study will be available from the authors upon reasonable request.
Disclaimer/Publisher's Note
The statements, opinions and data contained in all publications are solely those of the individual author(s) and contributor(s) and not of EWA Publishing and/or the editor(s). EWA Publishing and/or the editor(s) disclaim responsibility for any injury to people or property resulting from any ideas, methods, instructions or products referred to in the content.
About volume
Volume title: Proceedings of the 2nd International Conference on Environmental Geoscience and Earth Ecology
© 2024 by the author(s). Licensee EWA Publishing, Oxford, UK. This article is an open access article distributed under the terms and
conditions of the Creative Commons Attribution (CC BY) license. Authors who
publish this series agree to the following terms:
1. Authors retain copyright and grant the series right of first publication with the work simultaneously licensed under a Creative Commons
Attribution License that allows others to share the work with an acknowledgment of the work's authorship and initial publication in this
series.
2. Authors are able to enter into separate, additional contractual arrangements for the non-exclusive distribution of the series's published
version of the work (e.g., post it to an institutional repository or publish it in a book), with an acknowledgment of its initial
publication in this series.
3. Authors are permitted and encouraged to post their work online (e.g., in institutional repositories or on their website) prior to and
during the submission process, as it can lead to productive exchanges, as well as earlier and greater citation of published work (See
Open access policy for details).
References
[1]. Carbon dioxide now more than 50% higher than pre-industrial levels. (2022, June 3). Noaa.gov. https://www.noaa.gov/news-release/carbon-dioxide-now-more-than-50-higher-than-pre-industrial-levels
[2]. Hoegh-Guldberg O, Poloczanska ES, Skirving W and Dove S (2017) Coral Reef Ecosystems under Climate Change and Ocean Acidification. Front. Mar. Sci. 4:158. doi: 10.3389/fmars.2017.00158
[3]. IPCC. (2000). IPCC SPECIAL REPORT EMISSIONS SCENARIOS Emissions Scenarios. https://www.ipcc.ch/site/assets/uploads/2018/03/sres-en.pdf
[4]. Raven, J. (2005). The Royal Society. Royalsociety.org. https://royalsociety.org/-/media/Royal_Society_Content/policy/publications/2005/9634.pdf
[5]. FEELY, R. A., DONEY, S. C., & COOLEY, S. R. (2009). Ocean Acidification: Present Conditions and Future Changes in a High-CO₂ World. Oceanography, 22(4), 36–47. http://www.jstor.org/stable/24861022
[6]. Sabine, Christopher L et al. “The oceanic sink for anthropogenic CO2.” Science (New York, N.Y.) vol. 305,5682 (2004): 367-71. doi:10.1126/science.1097403
[7]. Henderson, C. (2006, August 2). Ocean acidification: the other CO2 problem. New Scientist; New Scientist. https://www.newscientist.com/article/mg19125631-200-ocean-acidification-the-other-co2-problem/
[8]. Pörtner, Hans-Otto. (2008). Ecosystem effects of ocean acidification in times of ocean warming: A physiologist's view. Marine Ecology-progress Series - MAR ECOL-PROGR SER. 373. 203-217. 10.3354/meps07768.
[9]. Kleypas, JA et al. “Geochemical consequences of increased atmospheric carbon dioxide on coral reefs.” Science (New York, N.Y.) vol. 284,5411 (1999): 118-20. doi:10.1126/science.284.5411.118
[10]. Gattuso, J.-P., Allemand, D., & Frankignoulle, M. (1999). Photosynthesis and Calcification at Cellular, Organismal and Community Levels in Coral Reefs: A Review on Interactions and Control by Carbonate Chemistry. American Zoologist, 39(1), 160–183. http://www.jstor.org/stable/3884234
[11]. Souter, D., Planes, S., Wicquart, J., Logan, M., Obura, D., & Staub, F. (2020). Status of Coral Reefs of the World: 2020. https://gcrmn.net/wp-content/uploads/2023/01/Status-of-Coral-Reefs-of-the-World-2020-Full-Report.pdf
[12]. Fisher, R., O’Leary, R. A., Low‐Choy, S., Mengersen, K., Knowlton, N., Brainard, R. E., & M. Julian Caley. (2015). Species Richness on Coral Reefs and the Pursuit of Convergent Global Estimates. Current Biology, 25(4), 500–505. https://doi.org/10.1016/j.cub.2014.12. 022
[13]. Comeau S., Tambutté E., Carpenter R. C., Edmunds P. J., Evensen N. R., Allemand D., Ferrier-Pagès C., Tambutté S. and Venn A. A. 2017. Coral calcifying fluid pH is modulated by seawater carbonate chemistry not solely seawater pH. Proc. R. Soc. B.2842016166920161669. http://doi.org/10.1098/rspb.2016.1669
[14]. Wood, H. L., Spicer, J. I., & Widdicombe, S. (2008). Ocean acidification may increase calcification rates, but at a cost. Proceedings. Biological sciences, 275(1644), 1767–1773. https://doi.org/10.1098/rspb.2008.0343
[15]. Souter, D., Planes, S., Wicquart, J., Logan, M., Obura, D., & Staub, F. (n.d.). Status of Coral Reefs of the World: 2020 Chapter 2. Status of Coral Reefs of the World. https://gcrmn.net/wp-content/uploads/2022/05/Chapter-2.-Status-of-Coral-Reefs-of-the-World.pdf
[16]. Van Vuuren, D., Feddema, J., Lamarque, J.-F., Riahi, K., Rose, S., Smith, S., & Hibbard, K. (n.d.). Work plan for data exchange between the Integrated Assessment and Climate 1 Modeling community in support of Phase-0 of scenario analysis for climate change 2 assessment (Representative Community Pathways). https://pcmdi.llnl.gov/mips/cmip5/docs/RCP_ handshake.pdf
[17]. Van Vuuren, D.P., Edmonds, J., Kainuma, M. et al. The representative concentration pathways: an overview. Climatic Change 109, 5 (2011). https://doi.org/10.1007/s10584-011-0148-z
[18]. Doney, S. C., Fabry, V. J., Feely, R. A., & Kleypas, J. A. (2009). Ocean acidification: the Other CO2 Problem. Annual Review of Marine Science, 1(1), 169–192. https://doi.org/10.1146/annurev.marine.010908.163834
[19]. Orr, J., Fabry, V., Aumont, O. et al. Anthropogenic ocean acidification over the twenty-first century and its impact on calcifying organisms. Nature 437, 681–686 (2005). https://doi.org/10.1038/nature04095
[20]. US. (2023). Global Monitoring Laboratory - Carbon Cycle Greenhouse Gases. Noaa.gov. https://gml.noaa.gov/ccgg/trends/global.html
[21]. Tuyet, T., Gehlen, M., & Chevallier, F. (2020). Global ocean surface carbon product. HAL (Le Centre Pour La Communication Scientifique Directe). https://doi.org/10.48670/moi-00047
[22]. Japan Meteorological Agency|Carbon dioxide uptake mapping animation. (2023). Jma.go.jp. https://www.data.jma.go.jp/gmd/kaiyou/english/co2_flux/co2_flux_animation_en.html
[23]. Shinoda, T., Zamudio, L., Guo, Y., Metzger, E. J., & Fairall, C. W. (2019). Ocean variability and air-sea fluxes produced by atmospheric rivers. Scientific reports, 9(1), 2152. https://doi.org/10.1038/s41598-019-38562-2
[24]. Dove, S. G., Kline, D. I., Pantos, O., Angly, F. E., Tyson, G. W., & Hoegh-Guldberg, O. (2013). Future reef decalcification under a business-as-usual CO2 emission scenario. Proceedings of the National Academy of Sciences of the United States of America, 110(38), 15342–15347. https://doi.org/10.1073/pnas.1302701110
[25]. Eyre, B. D., Cyronak, T., Drupp, P., De Carlo, E. H., Sachs, J. P., & Andersson, A. J. (2018). Coral reefs will transition to net dissolving before end of century. Science (New York, N.Y.), 359(6378), 908–911. https://doi.org/10.1126/science.aao1118
[26]. Jiang, Li-Qing; Carter, Brendan R.; Feely, Richard A.; Lauvset, Siv K.; Olsen, Are (2019). Global surface ocean pH, acidity, and Revelle Factor on a 1x1 degree global grid from 1770 to 2100 (NCEI Accession 0206289). NOAA National Centers for Environmental Information. Dataset. https://doi.org/10.25921/kgqr-9h49.
[27]. Osborne, K., Dolman, A. M., Burgess, S. C., & Johns, K. A. (2011). Disturbance and the dynamics of coral cover on the Great Barrier Reef (1995-2009). PloS one, 6(3), e17516. https://doi.org/10.1371/journal.pone.0017516
[28]. Stone, L., Huppert, A., Rajagopalan, B., Bhasin, H., & Loya, Y. (1999). Mass Coral Reef Bleaching: A Recent Outcome of Increased El Niño Activity?. Ecology letters, 2(5), 325–330. https://doi.org/10.1046/j.1461-0248.1999.00092.x
[29]. J.-P. Gattuso et al. ,Contrasting futures for ocean and society from different anthropogenic CO2 emissions scenarios.Science349,aac4722(2015).DOI:10.1126/science.aac4722
[30]. Ove Hoegh‐Guldberg, Pendleton, L. H., & Kaup, A. (2019). People and the changing nature of coral reefs. Regional Studies in Marine Science, 30, 100699–100699. https://doi.org/10.1016/j.rsma.2019.100699
[31]. Cramer, K., O’Dea, A., Clark, T. et al. Prehistorical and historical declines in Caribbean coral reef accretion rates driven by loss of parrotfish. Nat Commun 8, 14160 (2017). https://doi.org/10.1038/ncomms14160