


1. Introduction
The lamprey, recognized as an invasive species, exhibits a distinct sex determination pattern that profoundly influences the ecological dynamics of its inhabited environments[1-3]. This organism predominantly consumes aquatic microorganisms and engages in feeding, roosting, and reproductive activities within the deep water regions. Owing to its limited array of natural predators, the lamprey is subjected to predation by only minimal local residents. (Figure 1)
Building on this foundational understanding, the aims of our research are to elucidate the benefits and drawbacks associated with this mechanism of sex alteration in organisms and to assess the evolutionary viability of this model.
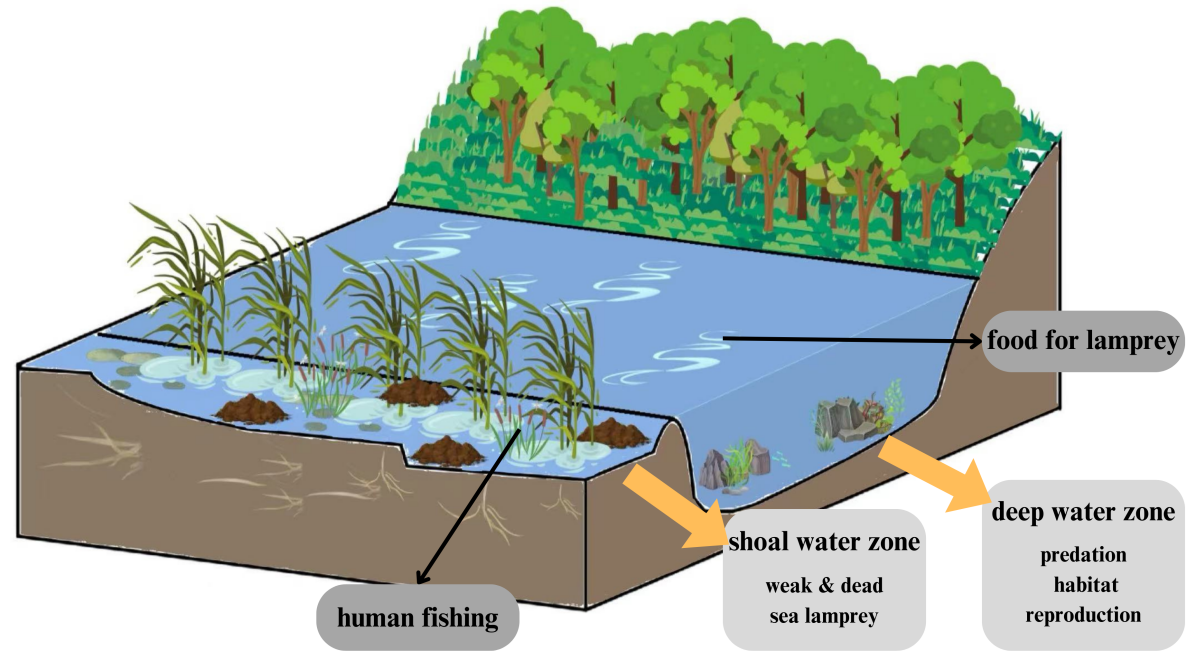
Figure 1. The habitat diagram of lamprey
2. Methodology
2.1. The predator system dynamics based on Lotka-Volterra Model
The Lotka-Volterra equation reflects the dynamics of predator and prey populations in a system by setting up a system of differential equations for both. During the study of lamprey populations, we consider the lamprey as predator and establish the equations as follows:
\( \begin{cases} \begin{array}{c} \frac{dN}{dt}={r_{N}}\cdot N\cdot (1-\frac{N}{kN})-{α_{NO}}(N-O) \\ \frac{dF}{dt}={r_{F}}\cdot F\cdot (1-\frac{F+M}{kF})+{α_{FN}}(N-F) \\ \frac{dM}{dt}={r_{M}}\cdot M\cdot (1-\frac{F+M}{k-M})+{α_{MN}}(N-M) \end{array} \end{cases} \)
\( \frac{dO}{dt}={r_{O}}\cdot O\cdot (1-\frac{O}{{k_{O}}})-{β_{ON}}\cdot (O-N) \)
where N O respectively represents the total population numbers of the lampreys and the comparative species; F M respectively represents the numbers of female/male lampreys; \( {r_{N}} \) \( {r_{F}} \) \( {r_{M}} \) represent the reproductive rate of lamprey overall, female and male lamprey; k represents the carrying capacity of the environment; \alpha \beta represent the competition coefficients.
This model effectively captures the impact of sex ratio variations on both prey and competitors. Given the limited natural predators of lampreys, we can explore the implications of changes in population size and sex ratios of lamprey on the local ecosystem’s food web.
2.2. The evaluation categories based on AHP
Following the analysis of the impact of lamprey sex ratios on the ecological environment using a predator model, we will proceed to examine the model’s influence on the population itself. Initially, we will define and select important evaluation categories by consulting ecological literature and applying the Analytic Hierarchy Process (AHP) (Table 1).
Table 1.
Advantages | Disadvantages |
A1 The populations are relatively stable and can easily survive harsh environments | D1 The populations are restricted from reproducing on a large scale when food is plentiful |
A2 The populations have a high adaptation to different environments | D2 Extreme sex ratios in food scarcity can lead to reduced genetic diversity |
A3 The demand for food varies cyclically, favoring the long-term development of the population | D3 Social structure and behavioral changes are easily exacerbated |
...... | D4 Vulnerability of gender transition to external environment disturbances |
With regard to the categories of three advantages and four disadvantages, we can quantify each terms through consulting literature [1-2] as illustrated in Table II.
Table 2. The importance quantification table
1 | Equally important |
3 | Slightly important |
5 | Moderately important |
7 | Very important |
9 | Extremely important |
2, 4, 6, 8 | Intermediate values to the above assessments |
Based on Table II, the Judgement matrix is constructed as shown in Table III:
Table 3. The construction of judgement matrices
| D1 | D2 | D3 | D4 | ||||||||||||||||||
D1 | 1 | 2/3 | 3 | 2 | ||||||||||||||||||
D2 | 3/2 | 1 | 5 | 3 | ||||||||||||||||||
D3 | 1/3 | 1/5 | 1 | 1/2 | ||||||||||||||||||
D4 | 1/2 | 1/3 | 2 | 1 |
According to this table we can obtain the detained entries of matrices A and B. Following this, we normalize and weight these two matrices to get specific scores for each item.
\( \begin{cases} \begin{array}{c} {a^{ \prime }}=\frac{a-min{(}A)}{max{(}A)-min{(}A)} \\ {ω_{i}}=\frac{1}{n}\overset{\underset{n}{j=1}}{∑}\frac{a_{i{j^{ \prime }}}^{ \prime }}{\overset{\underset{n}{k=1}}{∑}a_{kj}^{ \prime }} (i=1,2,…,n) \end{array} \end{cases} \)
where a’_{ij} represents the i-j entry of the normalized matrix, \omega represents the scores for each column.
2.3. Cross-validation based on CA model
We use Cellular Automata (CA) to simulate the life activities of lamprey in the local ecosystem.
Cellular Automata is an algorithm that simulates the dynamics of “metacells” in time and space based on a set of rules. Define lamprey and its prey as a 2-tuple and a 1-tuple, respectively (empty space is 0). The rules are determined as following:
Rule I.: When there exists vacant space in the surroundings(8 cells), prey has a chance rP to breed in either open space.
Rule II.: In each time step, each prey and predator has a d chance of dying naturally.
Rule III.: When prey exists around a predator, the predator has a P chance to complete predation, which converts to vacant space after the process.
Rule IV.: When male and female lamprey are present in the vicinity of each other, they have a chance of r producing predator offspring. Sex ratio of offspring is consistent with as stated previously.
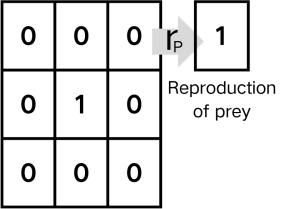
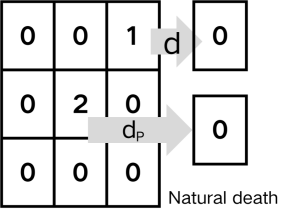
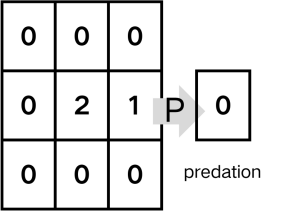
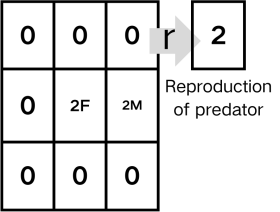
Figure 2. The visualized rules for CA
Through Cellular Automata (CA), we can visualize the natural rules through the simulation process considering a 50*50 open space with 5000 time-steps initially filled with food(prey).
3. Results and Discussions
3.1. Effects of the pattern on ecosystems
Through literature review [2-3] and model estimation, we initialized the assignment of values shown in Table III for the covariates of equations (1) (2) and visualized the results as shown in Figure 3 to observe the dynamic behavior of the lamprey population.
\( {r_{N}}=0.1 \) | \( {k_{N}}=1000 \) | \( {r_{F}}=0.08 \) | \( {k_{F}}=500 \) | \( {r_{M}}=0.08 \) |
\( {k_{M}}=500 \) | \( {α_{NO}}=0.005 \) | \( {α_{FN}}=0.002 \) | \( {α_{MN}}=0.004 \) | \( {r_{O}}=0.05 \) |
\( {k_{O}}=800 \) | \( {β_{ON}}=0.001 \) | \( F=80 \) | ... |
|
|
(a) Dynamics of Lamprey Population | (b) Phase Portrait |
|
|
(c) Phase Space | (d) Time Series of Lamprey Quantity |
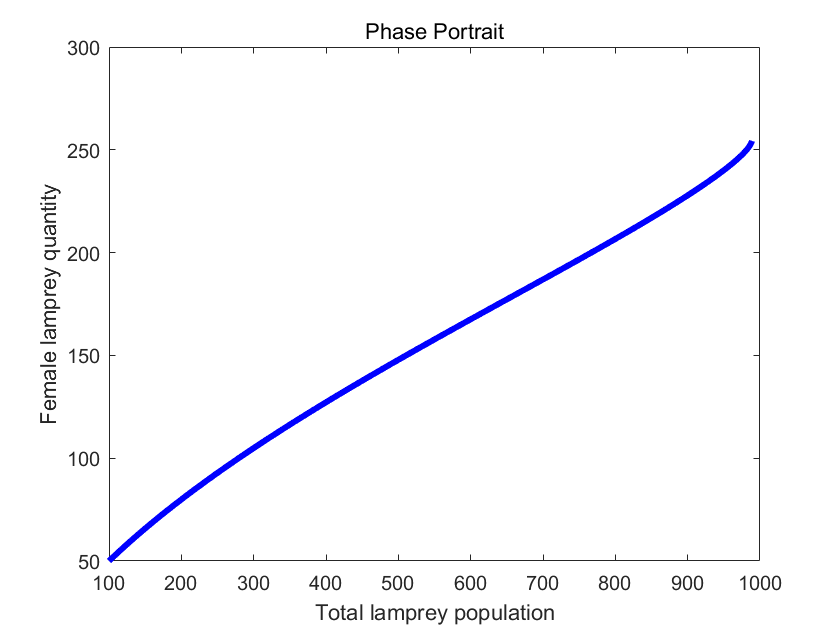
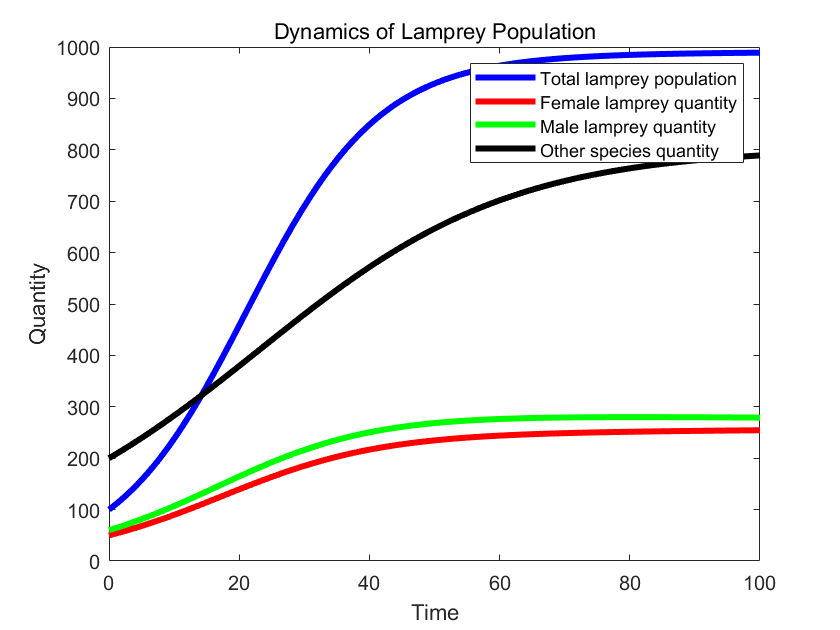
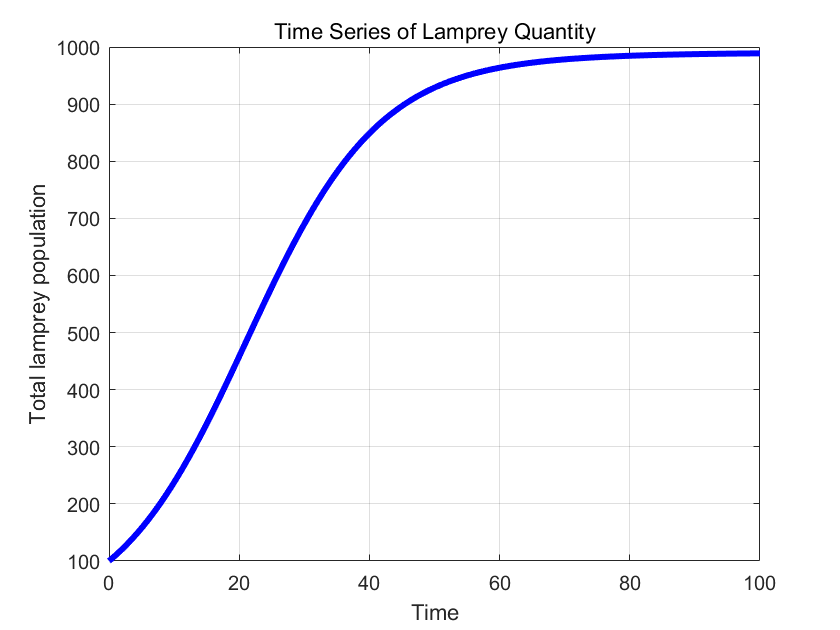
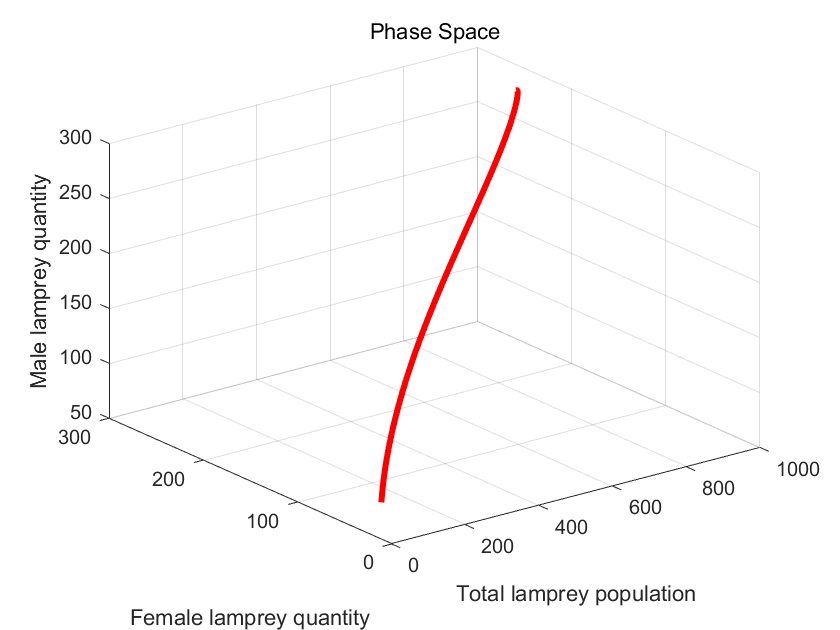
Figure 3. The image grid illustrating the fuzzification of variables
For further characterize the relationship between the sex ratio of lamprey and food availability, equation 4 is employed as following:
\( P=\frac{1}{1+{e^{-k(F-{F_{0}})}}} \)
where P represents the ratio of male lamprey in the population, F represents the level of food availability, F0 represents the threshold of food availability affecting the sex ratio, K is the parameter affecting the curve steepness.
According to equation (3), the system dynamics equation was revised to integrate the interplay between sex ratio and food availability in lamprey populations. By varying parameters k and F0, a comprehensive analysis was conducted to depict the population dynamics of lampreys, including total count, gender distribution, and interactions with other species at equilibrium, reflecting the impact of lamprey sex determination patterns on ecosystems in specific ecological niches. The outcomes are illustrated in Figure 4.
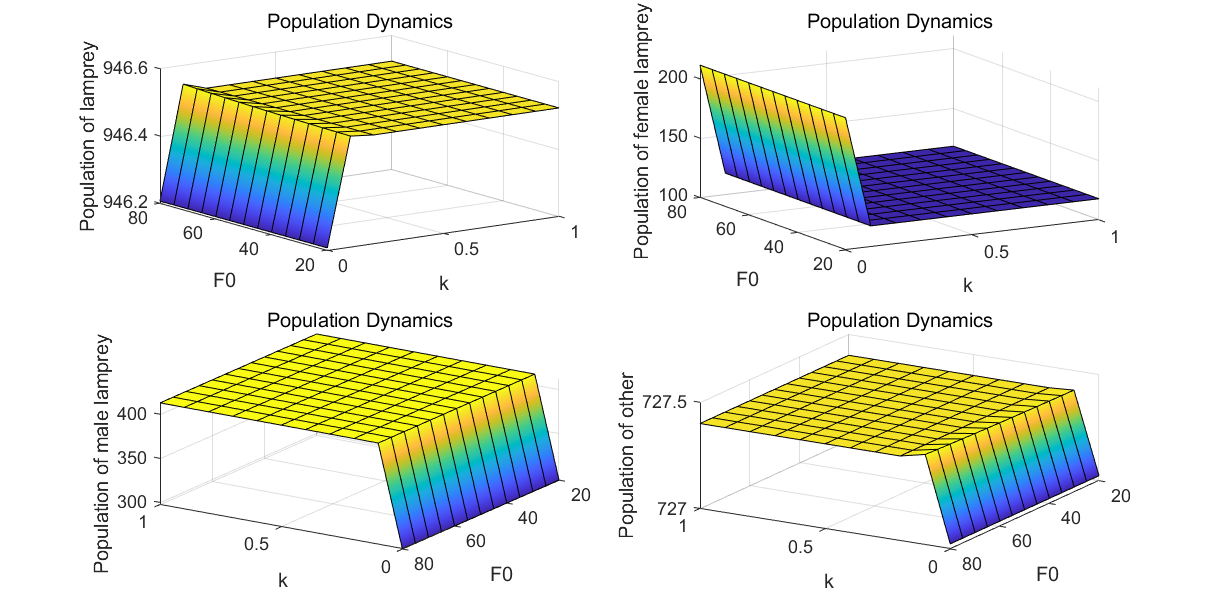
Figure 4. Availability of the sex determination pattern
3.2. Effects of the pattern on population itself
Through equation (3) and Table III, the scores for A B matrices can be obtained through calculations:
\( {ω_{A}}=[0.58160.30900.1095{]^{T}} \)
\( {ω_{B}}=[0.29600.45520.08950.1592{]^{T}} \)
We visualize the weights of given items by plotting a bar chart based on the final results:
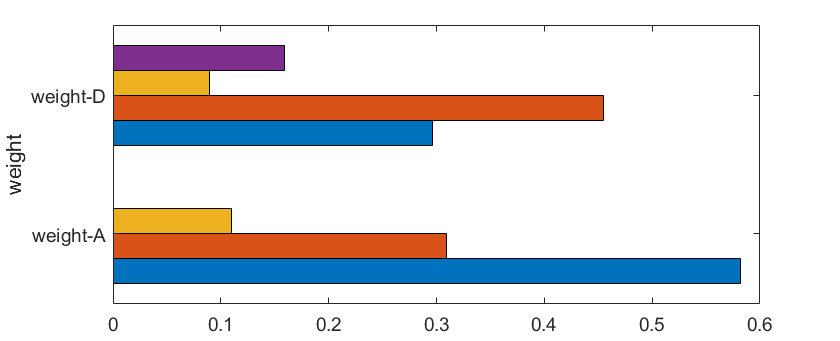
Figure 5. The visualized results for the evaluation categories
Based on the findings and analysis presented in Figure 4, it can be inferred that advantages A1 and A2 have a more significant impact on lamprey’s benefits, while disadvantages D1, D2, and D4 exert greater influence on its drawbacks. Following this, the Cellular Automata (CA) is utilized to simulate the activities of lamprey population in local ecosystems. Based on the knowledge of CA rules, we produced the following simulation.
→ Black cell – vacant space Green cell – male lamprey
→ Blue cell – female lamprey Red cell – prey

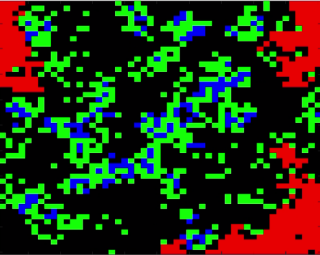

(a): Resource scarcity (b): Endangered population (c): Population restoration
Figure 6. Simulation results of lamprey based on optimized CA
Remarkably, the lamprey population demonstrated resilience by surviving 5,000 time-steps despite facing various stressors. The species consistently encounters scenarios of food scarcity, population fluctuations, and recovery, establishing a delicate equilibrium with its external environment. In Figure 7 below, we present a graph illustrating the data from this simulation to offer a detailed analysis of the strengths and weaknesses inherent in the lamprey’s approach to sex determination.
|
|
(a) The parameters of lamprey over time | (b) The number of prey versus predator |
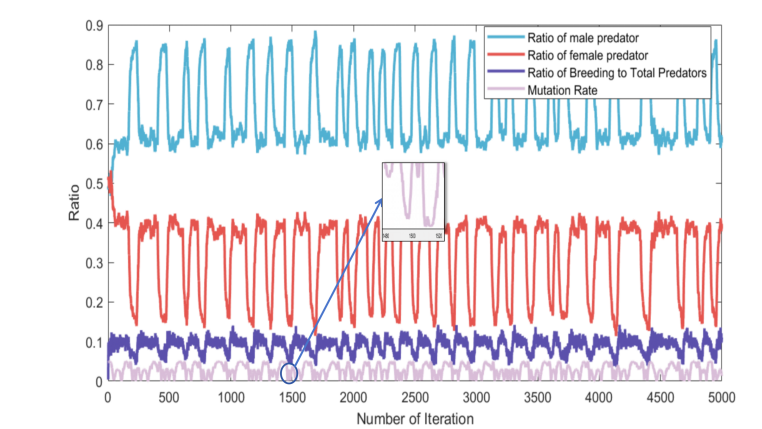
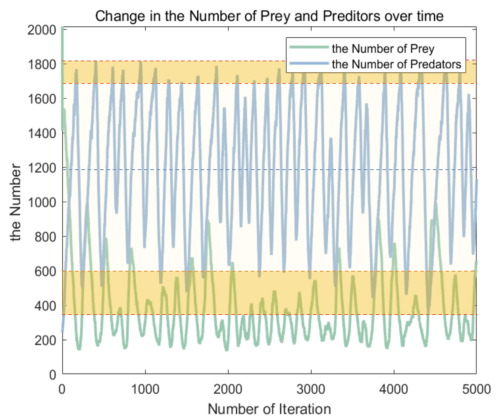
Figure 7. Dynamic graphs reflecting parameters of the simulation
3.2.1. Advantages: Vitality and Resilience: The lamprey populations exhibited robust vitality and resilience throughout the simulation. Figures 6-(a) and 6-(b) illustrate the species’ ability to maintain an optimal male/female ratio even in the face of endangerment, ensuring its continued survival.
Stability and Adaptability: The population size of lampreys, depicted in Figure 7-(b), consistently ranged between 600-1700 individuals, showcasing remarkable stability. The species’ capacity to withstand extreme conditions without dropping below approximately 350 individuals highlights its adaptability.
3.2.2. Disadvantages: Population Limitation: Figure 7-(b) reveals that the maximum population size of lampreys is constrained, peaking at less than 1800 individuals even under extreme circumstances. The challenges associated with habitat expansion are evident, particularly when the male to female ratios become extreme.
Genetic Diversity Decrease: At extreme male to female ratios (e.g., 1500 cycles), Figure 7-(a) indicates a notable reduction in population mutations, leading to a decline in genetic diversity. This phenomenon, possibly linked to male scarcity, underscores the importance of maintaining balanced sex ratios.
Environmental Vulnerability: Extreme sex ratios, as depicted in Figures 6-(a) and 6-(b), render populations highly susceptible to adverse environmental changes. A significant decrease in food availability, as shown in Figure 7-(b), exacerbates the unfavorable conditions faced by lamprey populations under such sex ratio extremes.
4. Conclusion
This paper utilizes mathematical modeling and computer simulations to delve into the evaluations of the sex determination pattern of lamprey. The Lotka-Volterra Model is employed to analyze the effect of this pattern on the ecosystem, which is obtained to maintain the prey number in a low but stable level. The AHP and Cellular Automata simulations are used for impacts evaluation on the population itself, reflecting the resilience and vulnerabilities of this pattern.
References
[1]. H. Nazari and A. Abdoli, “Some reproductive characteristics of endangered Caspian Lamprey (Caspiomyzon wagneri Kessler, 1870) in the Shirud River southern Caspian Sea, Iran,” Environmental Biology of Fishes, vol. 88, no. 1, pp. 87–96, Feb. 2010, doi: https://doi.org/10.1007/s10641-010-9620-2.
[2]. N. S. Johnson, W. D. Swink, and T. O. Brenden, “Field study suggests that sex determination in sea lamprey is directly influenced by larval growth rate,” Proceedings of the Royal Society B: Biological Sciences, vol. 284, no. 1851, p. 20170262, Mar. 2017, doi: https://doi.org/10.1098/rspb.2017.0262.
[3]. F. W. H. Beamish, “Environmental Sex Determination in Southern Brook Lamprey, Ichthyomyzon gagei,”Canadian Journal of Fisheries and Aquatic Sciences, vol. 50, no. 6, pp. 1299–1307, Jun. 1993, doi: https://doi.org/10.1139/f93-147.
[4]. I. El Arabi, A. Chafi and S. K. Alami, “Numerical simulation of the SIR and Lotka-Volterra models used in biology,” 2019 International Conference on Intelligent Systems and Advanced Computing Sciences (ISACS), Taza, Morocco, 2019, pp. 1-4, doi: 10.1109/ISACS48493.2019.9068876. keywords: {Mathematical model; Numerical models; Biological system modeling; Sociology; Statistics; Microorganisms; SIR; Lotka-Volterra; Mathematical model; Simulation; Infectious agent; Prey; Predator; Monod; Bacterial growth; Runge-Kutta of order 4},
Cite this article
Ma,G.;Gu,B.;Wu,Z. (2024). Evaluation or retrogression-The sex ratio determination pattern of lamprey. Theoretical and Natural Science,38,56-62.
Data availability
The datasets used and/or analyzed during the current study will be available from the authors upon reasonable request.
Disclaimer/Publisher's Note
The statements, opinions and data contained in all publications are solely those of the individual author(s) and contributor(s) and not of EWA Publishing and/or the editor(s). EWA Publishing and/or the editor(s) disclaim responsibility for any injury to people or property resulting from any ideas, methods, instructions or products referred to in the content.
About volume
Volume title: Proceedings of the 2nd International Conference on Mathematical Physics and Computational Simulation
© 2024 by the author(s). Licensee EWA Publishing, Oxford, UK. This article is an open access article distributed under the terms and
conditions of the Creative Commons Attribution (CC BY) license. Authors who
publish this series agree to the following terms:
1. Authors retain copyright and grant the series right of first publication with the work simultaneously licensed under a Creative Commons
Attribution License that allows others to share the work with an acknowledgment of the work's authorship and initial publication in this
series.
2. Authors are able to enter into separate, additional contractual arrangements for the non-exclusive distribution of the series's published
version of the work (e.g., post it to an institutional repository or publish it in a book), with an acknowledgment of its initial
publication in this series.
3. Authors are permitted and encouraged to post their work online (e.g., in institutional repositories or on their website) prior to and
during the submission process, as it can lead to productive exchanges, as well as earlier and greater citation of published work (See
Open access policy for details).
References
[1]. H. Nazari and A. Abdoli, “Some reproductive characteristics of endangered Caspian Lamprey (Caspiomyzon wagneri Kessler, 1870) in the Shirud River southern Caspian Sea, Iran,” Environmental Biology of Fishes, vol. 88, no. 1, pp. 87–96, Feb. 2010, doi: https://doi.org/10.1007/s10641-010-9620-2.
[2]. N. S. Johnson, W. D. Swink, and T. O. Brenden, “Field study suggests that sex determination in sea lamprey is directly influenced by larval growth rate,” Proceedings of the Royal Society B: Biological Sciences, vol. 284, no. 1851, p. 20170262, Mar. 2017, doi: https://doi.org/10.1098/rspb.2017.0262.
[3]. F. W. H. Beamish, “Environmental Sex Determination in Southern Brook Lamprey, Ichthyomyzon gagei,”Canadian Journal of Fisheries and Aquatic Sciences, vol. 50, no. 6, pp. 1299–1307, Jun. 1993, doi: https://doi.org/10.1139/f93-147.
[4]. I. El Arabi, A. Chafi and S. K. Alami, “Numerical simulation of the SIR and Lotka-Volterra models used in biology,” 2019 International Conference on Intelligent Systems and Advanced Computing Sciences (ISACS), Taza, Morocco, 2019, pp. 1-4, doi: 10.1109/ISACS48493.2019.9068876. keywords: {Mathematical model; Numerical models; Biological system modeling; Sociology; Statistics; Microorganisms; SIR; Lotka-Volterra; Mathematical model; Simulation; Infectious agent; Prey; Predator; Monod; Bacterial growth; Runge-Kutta of order 4},