1. Introduction
As an important laser device, fiber laser has been widely used in many fields. Its principle is to use the glass fiber doped with rare earth ions to enhance photons, thus producing a laser. In fiber lasers, values of parameters vary based on different selections of rare earth ions. Previous research has shown that erbium and ytterbium-doped fiber lasers have achieved great improvements [1]. However, in order to achieve light amplification in wavelength bands other than erbium/ytterbium, fiber lasers using thulium as rare earth ions are also worthy of in-depth study.
The research on Erbium/Ytterbium ion-doped fiber lasers has become increasingly complete in previous studies, whereas there are still obvious drawbacks that can not be dealt with. In fact, the highest power devices to date have been based on ytterbium-doped silica fibers [2]. However, the center wavelength of the laser is usually set near 1080 nm, which is extremely harmful to the human eyes [2,3]. Therefore, in order to settle this issue, the research on thulium-doped lasers is particularly significant.
Thulium ions have a wide emission wavelength band and can generate laser in the domain of 1650 nm to 2000 nm [1,4], which reduces the damage to human eyes in daily use, so it has spacious room for development in remote sensing technology [5,6]. In addition, the unique wavelength range of thulium-doped lasers renders them widely applicable to various fields such as medication [1,3,6] and future communication systems [1]. In common cases, the wavelength range of pump light used for thulium-doped ion lasers is often selected around 790nm. The reason for this is that laser light in this band is easily obtained through effective diodes [2]. However, according to the research, using pump light in the band near 1550-1600nm can greatly improve the output power and efficiency of the laser [4]. The following experiment has also explored in detail the impact of this pump light band on laser efficiency.
Studies on thulium ion fiber lasers intend to help expand the application scope of fiber lasers and contribute to the development of laser technology. This article will focus on the study of lasers with thulium ions operating near 1750 nm. During the simulation process, a Tm-SiO2 doped fiber with a second-order energy level structure was utilized, while a laser of 1600 nm wavelength band was used as the pump light [7,8]. This article has reproduced the energy level structure of thulium ions, demonstrated the electronic transition process, and used physical model simulation methods to explore the magnitude and changing trend of the output power to more comprehensively evaluate the performance of the fiber laser. Apart from these, it also has provided theoretical and practical support for applications in multiple fields. It is hoped that this research can deepen the understanding of thulium ion fiber laser and provide a useful reference for its further optimization and application.
2. Model design and parameter settings
The following part of the article has detailed the theoretical basis used in the experiment, including the display of the schematic diagram of the physical model and the listing of the relevant equations. In addition, the relevant parameters used in this experiment will be extracted and organized from previous literature [1].
2.1. Energy level structure and rate equation
The system of the electron transition is a 2-level structure. The structure and the detailed process are shown in Figure 1.
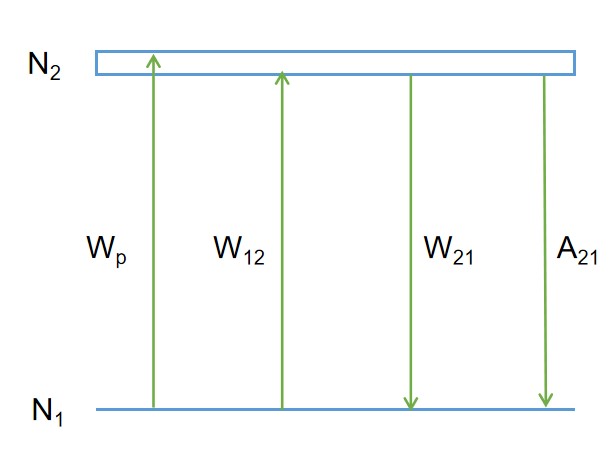
Figure 1. The Tm3+ energy level structure and electronic transition process.
N1 and N2 represent the ground state energy level and excited state energy level of the two-level structure respectively. In this particular case, the system is a (3F4, 3H6) band in thulium-doped silica. Wp, W12, W21, and A21 respectively represent the absorption rate of pump light, the absorption rate of signal light, the stimulated emission rate of signal light, and the probability of spontaneous emission of signal light. The rate equations of the system are as follows:
\( \frac{∂{N_{1}}(z)}{∂t}=-[{W_{12}}(z)+{W_{p}}(z)]{N_{1}}(z)+{W_{21}}{N_{2}}(z)+{A_{21}}{N_{2}}(z) \) (1)
\( \frac{∂{N_{2}}(z)}{∂t}=[{W_{12}}(z)+{W_{p}}(z)]{N_{1}}(z)-{A_{21}}{N_{2}}(z)-{W_{21}}{N_{2}}(z) \) (2)
\( N={N_{1}}(z)+{N_{2}}(z) \) (3)
In this set of rate equations, the left formula of (1) (2) represents the rate at which the number of particles in the two energy levels increases, while the right formula represents the difference between the total rate of absorption and the total rate of emission in the energy level. Equation (3) expresses the overall particle number material conservation.
2.2. Power Equation
Figure 2 suggests the schematic diagram of laser power propagation.

Figure 2. The schematic diagram of power propagation in optical fiber.
This figure shows the basic model in which pump light is input from the left end of the grating and the lasing light is output from the right end. As shown above, L represents the full length of the adopted optical fiber, while Pp(z) and Ps(z) represent the laser power of the pump light and signal light at the position z respectively. The power propagation equation of the system may be expressed by the subsequent equations:
\( \frac{dP_{p}^{+}(z)}{dz}={Γ_{p}}(-{σ_{p}}{N_{1}}(z)-{α_{p}})P_{p}^{+}(z) \) (4)
\( \frac{dP_{p}^{-}(z)}{dz}=-{Γ_{p}}(-{σ_{p}}{N_{1}}(z)-{α_{p}})P_{p}^{-}(z) \) (5)
\( \frac{dP_{s}^{+}(z)}{dz}={Γ_{s}}[-{α_{s}}+{σ_{21}}{N_{2}}(z)-{σ_{12}}{N_{1}}(z)]P_{s}^{+}(z) \) (6)
\( \frac{dP_{s}^{-}(z)}{dz}=-{Γ_{s}}[-{α_{s}}+{σ_{21}}{N_{2}}(z)-{σ_{12}}{N_{1}}(z)]P_{s}^{-}(z) \) (7)
Equations (4) and (5) describe the correlation between the forward transmission power and the reverse propagation power of the pump light, while equations (6) and (7) denote the connection between the forward transmission power and the reverse propagation power of the signal light. At the same time, the threshold power pth of the laser and the saturation power ps, sat and pp, sat of the signal light and pump light can also be expressed as equations:
\( {p_{th}}=\frac{(N{Γ_{s}}{σ_{12}}+{α_{s}})L+ln(\frac{1}{\sqrt[]{{R_{1}}{R_{2}}}})}{1-{e^{-β}}}\frac{{v_{p}}}{{v_{s}}}{p_{s,sat}} \) (8)
\( {p_{s,sat}}=\frac{h{v_{s}}{A_{c}}}{τ{Γ_{s}}({σ_{12}}+{σ_{21}})} \) (9)
\( {p_{p,sat}}=\frac{h{v_{p}}{A_{c}}}{τ{Γ_{s}}({σ_{12}}+{σ_{21}})} \) (10)
At last, the emitted power and net emitted power of the laser can also be calculated in equations. The calculation of the output power in equation (11) is mainly based on the fact that in the grating, the laser oscillates back and forth through the mirror to form a gain. The end with a higher refractive index is the output end. The output of the system can be obtained by calculating the laser power emitted from the output end. power. The calculation of the net output power in equation (12) aims to eliminate the influence of the threshold power in the total output power.
\( {p_{out}}=(1-{R_{2}})p_{s}^{+}(L) \) (11)
\( {p_{lout}}=\frac{{[p_{out}}-{p_{th}}+abs({p_{out}}-{p_{th}})]}{2} \) (12)
2.3. Parameters Setting
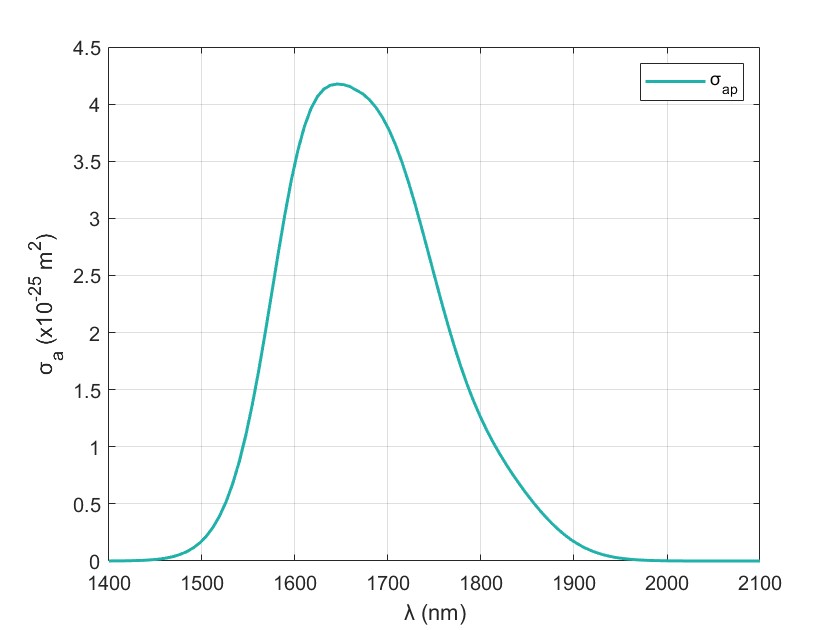
This section has determined the specific values of the parameters in the simulation. From the research data provided in previous studies [1], it can be seen that the average energy level lifetime of thulium ions is about 6.0-6.6 ms. The pump light absorption coefficient, which can also be referred as the cross-section, can be obtained from Figure 3.
 。
。
Figure 3. The curve of the pump light absorption cross-section changing with wavelength [1].
Since the value of the pump light wavelength selected in this experiment is 1600 nm, it can be concluded by fitting the data that the pump light absorption cross-section is approximately 3.5x10⁻²⁵ m2. Since the selected system has a 2-level structure, the pump light cross-section size of emission can be seen as 0. From Figure 4, it is also possible to derive the absorption and emission cross sections of the signal light.:
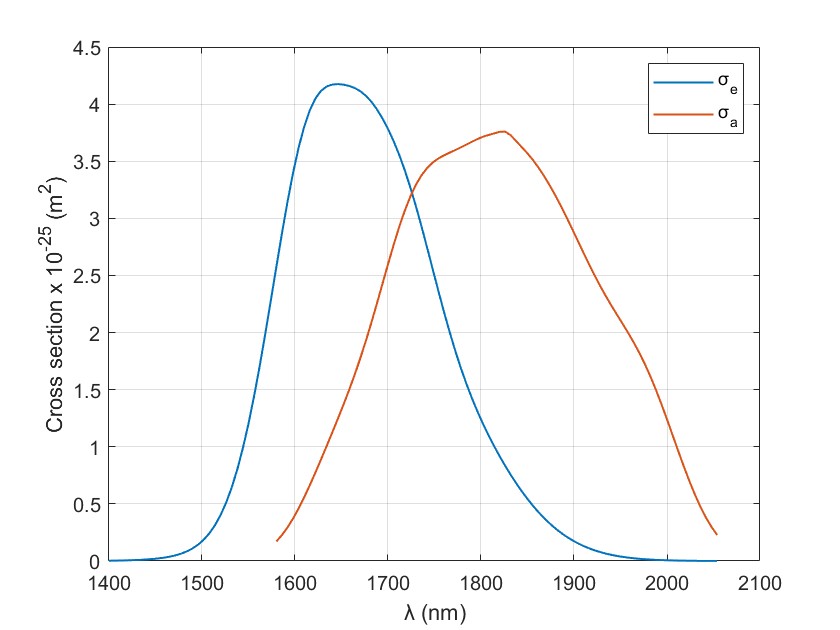
Figure 4. The curve of the laser absorption & emission coefficients changes with wavelength [1].
By adopting the same method shown above, the laser light cross-section of absorption and emission at a wavelength of 1750 nm can also be estimated.
Finally, The parameters used in this experiment are shown in table 1.
Table 1. Main parameters of the laser [1].
Symbols | Parameters | Value | Unit |
λsp | Center wavelength of pump light | \( 1.60×{10^{-6}} \) | \( m \) |
λs | Center wavelength of signal light | \( 1.75×{10^{-6}} \) | \( m \) |
τ | Average energy level lifetime of Tm3+ | \( 6.3×{10^{-3}} \) | \( s \) |
σap | Absorption cross-section of pump light | \( 3.46×{10^{-25}} \) | \( {m^{2}} \) |
σep | Emission cross-section of pump light | \( 0 \) | \( {m^{2}} \) |
σas | Absorption cross-section of signal light | \( 3.50×{10^{-25}} \) | \( {m^{2}} \) |
σes | Emission cross-section of signal light | \( 2.50×{10^{-25}} \) | \( {m^{2}} \) |
A c | Core cross-sectional area | \( 3×{10^{-11}} \) | \( {m^{2}} \) |
N | The number of thulium ions doped in the fiber core | \( 8.4×{10^{25}} \) | \( {m^{-3}} \) |
αp | Loss coefficient of double-clad fiber to pump light | \( 2×{10^{-3}} \) | \( {m^{-1}} \) |
αs | Loss coefficient of double-clad fiber to laser light | \( 4×{10^{-3}} \) | \( {m^{-1}} \) |
L | Double-clad fiber length | \( 1 \) | \( m \) |
Γp | Pump light overlap factor | \( 0.0024 \) | |
Γs | Laser light overlap factor | \( 0.82 \) | |
R1 | Left specular reflectance | \( 0.99 \) | |
R2 | Right specular reflectance | \( 0.635 \) |
2.4. Simulation Process
After all the parameters were attained, two different simulations were conducted respectively to gain a comprehensive test of performance the fiber laser. In the first simulation, after inputting 10 W pump light into the fiber laser via one end, equations (4) (5) (6) (7) were utilized to calculate the laser power and the pump power at different positions on the fiber laser. Through the calculations mentioned above, the process of light propagation was explicitly displayed. In the second simulation, by varying the power of pump laser, the output laser power was calculated by equation (12). The relation between the output laser power and the pump power was explored in this simulation. Further more, this simulation was conducted 3 times to ensure the correctness of the conclusion, as the length of the laser L changed in each time of the simulation. The results of the two simulations have been shown in the following section.
3. Results and Discussion
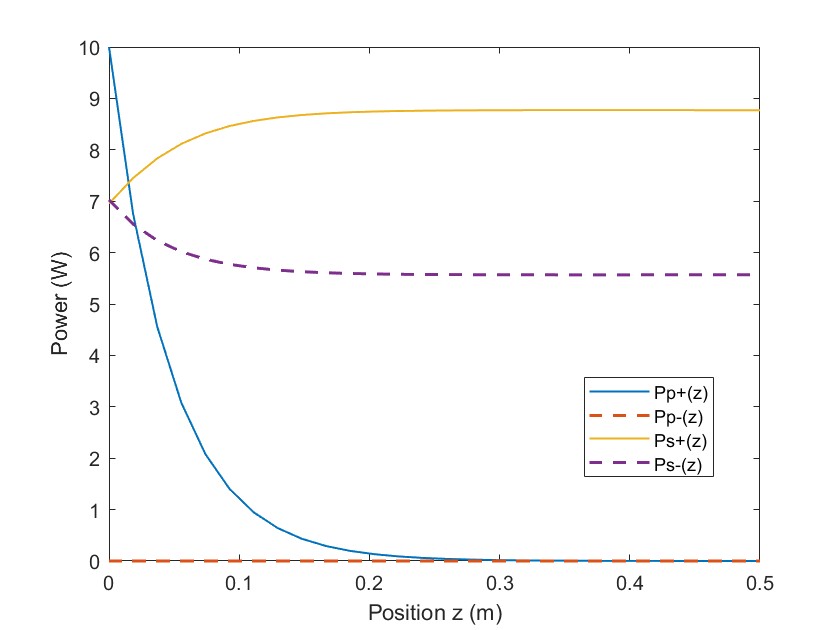
Figure 5. The curves of the power changing with fiber position.
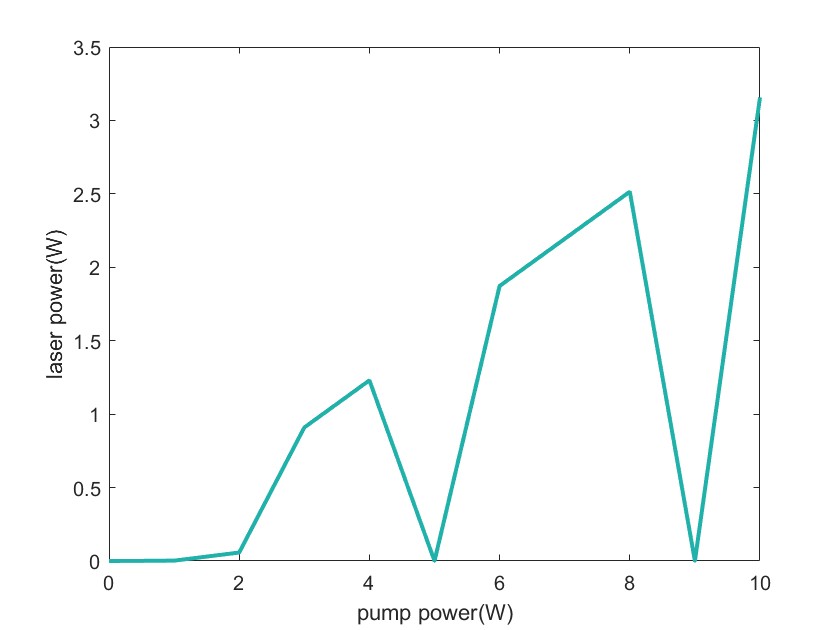
Figure 6. The curve of the laser power changing with pump power when L=1 m.
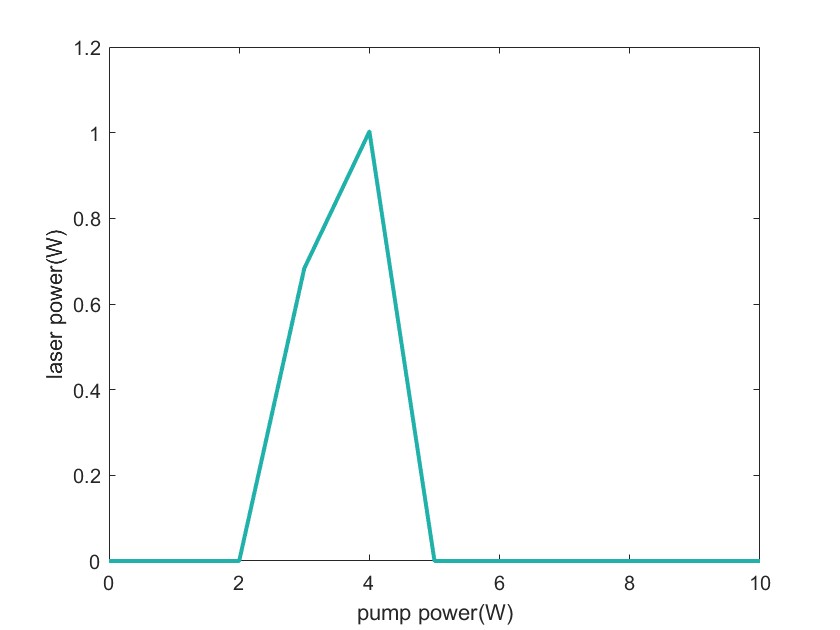
Figure 7. The curve of the laser power changing with pump power when L=5 m.
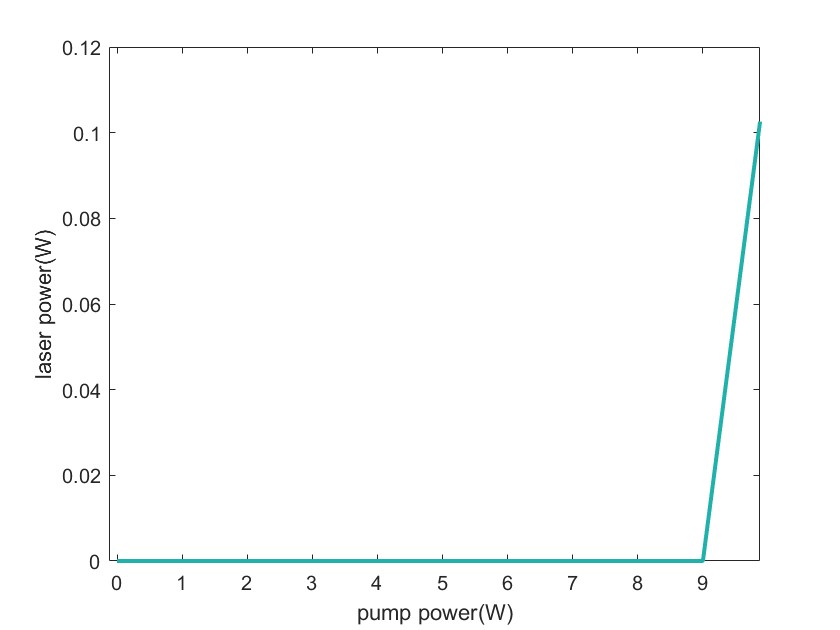
Figure 8. The curve of the laser power changing with pump power when L=10 m.
3.1. Result Analysis
Apart from displaying the results from the simulations above, it is also necessary to go through the similar experiments conducted in the past researches, in order that the ideal results in this experiment can be estimated and the differences between results can be seen to analyze the limitations and errors in the experiment more directly. In the research in [4], pump laser of 976 nm and 1560 nm generated from the erbium/ytterbium (Er/Yi) co-doped fiber laser were utilized respectively to produce output laser in the wavelength of 1700 nm. As a result, the output power and the pump power appeared to be in direct ratio after surpassing the threshold power in both cases, with the slope efficiency in 1560 case much higher than it in 976 nm, which validated the idea mentioned before in this article (laser light in the range of 1550nm to 1600 nm can improve the efficiency of the laser). Such direct proportion also appeared in surveys in [2,9]. Therefore, it is reasonable to infer that the output power would increase uniformly with the change of the pump power laser.
In the first simulation in the experiment, Figure 5 illustrates alterations in the propagation power of both the pump light and signal light, both positively and negatively, across various positions within the optical fiber. From the figure, it is evident that when 10W of pump light power is inputted to the left end, the positive direction power of the pump light begins to attenuate rapidly, and drops to 0 near 0.3 m, while its negative direction power is always 0. The positive and negative directions of the signal light The power gradually stabilizes.
Figure 6, Figure 7, and Figure 8 show the variation of laser power with pump light power when the fiber length is 1 m, 5 m, and 10 m respectively. As can be seen in Figure. 6, the overall change in laser power shows a significant increasing trend after the pump power is about 1.6 W, which shows that as the pump optical power gradually increases, the output laser power also increases. However, the figure shows that at some points, the laser power will suddenly decrease to 0. This is a poor convergence problem caused by the two-point boundary value method. In addition, the point at which laser power begins to increase significantly represents the threshold power of the system. From the illustration, it becomes apparent that with the extension of the optical fiber length, the threshold power shows a gradual increment, which also means that the difficulty of the system in generating laser light also increases.
3.2. Limitations and Expectations
This experiment conducted a preliminary exploration of the performance of thulium-doped fiber lasers. Despite the fact that the entire process of laser operation has been simulated and the corresponding results have been analyzed in detail, there are still particulars that have not been thought out carefully.
The system's functionality has been evaluated through prior testing, which involved altering the length value of the double-clad fiber, which is one of the simplest ways to do so. Nevertheless, there are also methods that have not been covered in the experiment that can render more thorough details to be noticed. For instance, the concentration of thulium ions can be changed to observe the alteration in output laser power. In practical cases, other ions such as aluminum ions have also been doped in the fiber to increase the total magnitude of solubility, so that the phenomenon of ion clustering in Tm3+ can be avoided [7,8]. In the aluminum/thulium (Al/Tm) co-doped case, it is found that when the ratio of Al3+ to Tm3+ is larger than 10, the clustering issue can be effectively avoided [10]. As a result, the efficiency of the whole system can also be improved when choosing the proper amount of ion concentration. Moreover, different selections of co-doped ions can in fact also vary in particularity. According to the research of S. Chen and his coworkers [11], the newly developed germanium /thulium (Ge/Tm) co-doped silica fiber has superior performance in amplifying lasers of short wavelength, which means that what co-doped ions to be selected also matters in different cases of laser production.
In spite of the issues mentioned above, there are also problems that have not been covered in this article regarding the materials when the model was actually built in real life. Take the parameters setting process as an example, instead of attaining the statistics such as absorption and emission area from the previous research, it would be more accurate to take actual measurements of the data in real-life experiments. However, it in fact can lead to a series of problems of inaccuracy, as distortion of the fiber is likely to happen due to the properties of the material [8]. Such kind of situations can not be effectively predicted in model establishing. Instead, it should be additionally considered before practicing the system.
Unfortunately, the relevant research on the topics mentioned above has not been explored thoroughly in this experiment, thus hopefully they can be discussed in detail in the future studies.
4. Conclusion
In conclusion, this article has demonstrated the physical model and code simulation of a 1750 nm thulium-doped fiber laser. The pump light with a wavelength of 1600 nm was input to study the changes in laser power in detail theoretically and experimentally. As a result, the fiber laser managed to yield stable output laser power, thus with the increase of the pump power, the laser has also been enhanced respectively. The experimental validation has underscored the capability of thulium ions in generating stable power lasers within the wavelength spectrum of 1700-1800 nm, thus consolidating the significance of continued research in the realm of thulium-doped lasers.
The prospects for the future development of optical fiber laser are promising. One of the most effective techniques for advancement lies in the adjustment of parameter values and the optimization of manufacturing processes for real fiber lasers. While this study has laid a foundational framework, practical implementation may encounter challenges that lead to the necessity of further investigation. By digging deeper into these specific aspects, researchers can enhance the efficiency and reliability of thulium-doped fiber lasers, by investigating alternative doped ions or integrating advanced materials to enhance laser output characteristics, thereby expanding their practical applications in various fields. Additionally, it is also necessary to break out of the existing researching ideas, such as exploring the potential for hybrid laser systems, combining thulium-doped fibers with other pump laser sources or amplification techniques, or even utilizing deep learning as an optimization tool in the design, which could broaden the scope of applications for these devices.
In summary, while this article proved the feasibility of the basic thulium-doped lasers, it failed to explore further into the detailed optimization techniques to enhance the performance of the system. To make improvements, the ongoing development of relevant research in this field should be highlighted. By embracing these challenges and opportunities, researchers can continue to advance the frontiers of laser technology and facilitate the emergence of novel innovations and applications in the future.
References
[1]. Agger D and Hedegaard Povlsen J 2006 Emission and Absorption Cross-section of Thulium Doped Silica Fibers vol 14 pp 50-57
[2]. Moulton P 2009 Tm-Doped Fiber Lasers: Fundamentals and Power Scaling J Sel Top Quantum Electron vol 15 no 1 pp 85-92
[3]. Daniel J Simakov N Tokurakawa M Ibsen M and Clarkson W A 2015 Ultra-short Wavelength Operation of a Thulium Fibre Laser in the 1660–1750 nm Wavelength Band
[4]. Zhang L 2021 1.7-μm Tm-doped Fiber Laser Intracavity-pumped by an erbium/ytterbium-codoped Fiber Laser
[5]. Junxiang Z Shijie F Zhang W Yao 2023 Recent Progress on Power Scaling and Single-frequency Operation of 1.7-μm Thulium-doped Fiber Lasers Opt Laser Technol vol 158
[6]. Zhang M Kelleher E Ferrari S 2012 Tm-doped Fiber Laser Mode-locked by Graphene-polymer Composite
[7]. Arai K et al 1986 Aluminum or Phosphorus Co‐doping Effects on the Fluorescence and Structural Properties of Neodymium‐doped Silica Glass J Appl. Phys vol 59 pp 3430-3436
[8]. Moulton P F et al Jan. 2009 Tm-Doped Fiber Lasers: Fundamentals and Power Scaling J Sel Top Quant vol 15 no 1 pp 85-92
[9]. Sincore A Bradford J D Cook J Richardson High Average Power Thulium-Doped Silica Fiber Lasers Review of Systems and Concepts J Sel Top Quant vol 24 no 3 pp 1-8
[10]. Jackson S D and Mossman S 2003 Efficiency Dependence on the Tm3+ and Al3+ Concentrations for Tm3+ -doped Silica Double-clad Fiber Lsers Appl Opt. vol 42 pp 2702-2707
[11]. Chen S Jung Y Alam S Richardson D Sidharthan R 2019 Ultra-short Wavelength Operation of Thulium-doped Fiber Amplifiers and Lasers
Cite this article
Wang,B. (2024). A 1750nm thulium-doped optical fiber laser design: Theoretical model and code simulation. Theoretical and Natural Science,38,69-77.
Data availability
The datasets used and/or analyzed during the current study will be available from the authors upon reasonable request.
Disclaimer/Publisher's Note
The statements, opinions and data contained in all publications are solely those of the individual author(s) and contributor(s) and not of EWA Publishing and/or the editor(s). EWA Publishing and/or the editor(s) disclaim responsibility for any injury to people or property resulting from any ideas, methods, instructions or products referred to in the content.
About volume
Volume title: Proceedings of the 2nd International Conference on Mathematical Physics and Computational Simulation
© 2024 by the author(s). Licensee EWA Publishing, Oxford, UK. This article is an open access article distributed under the terms and
conditions of the Creative Commons Attribution (CC BY) license. Authors who
publish this series agree to the following terms:
1. Authors retain copyright and grant the series right of first publication with the work simultaneously licensed under a Creative Commons
Attribution License that allows others to share the work with an acknowledgment of the work's authorship and initial publication in this
series.
2. Authors are able to enter into separate, additional contractual arrangements for the non-exclusive distribution of the series's published
version of the work (e.g., post it to an institutional repository or publish it in a book), with an acknowledgment of its initial
publication in this series.
3. Authors are permitted and encouraged to post their work online (e.g., in institutional repositories or on their website) prior to and
during the submission process, as it can lead to productive exchanges, as well as earlier and greater citation of published work (See
Open access policy for details).
References
[1]. Agger D and Hedegaard Povlsen J 2006 Emission and Absorption Cross-section of Thulium Doped Silica Fibers vol 14 pp 50-57
[2]. Moulton P 2009 Tm-Doped Fiber Lasers: Fundamentals and Power Scaling J Sel Top Quantum Electron vol 15 no 1 pp 85-92
[3]. Daniel J Simakov N Tokurakawa M Ibsen M and Clarkson W A 2015 Ultra-short Wavelength Operation of a Thulium Fibre Laser in the 1660–1750 nm Wavelength Band
[4]. Zhang L 2021 1.7-μm Tm-doped Fiber Laser Intracavity-pumped by an erbium/ytterbium-codoped Fiber Laser
[5]. Junxiang Z Shijie F Zhang W Yao 2023 Recent Progress on Power Scaling and Single-frequency Operation of 1.7-μm Thulium-doped Fiber Lasers Opt Laser Technol vol 158
[6]. Zhang M Kelleher E Ferrari S 2012 Tm-doped Fiber Laser Mode-locked by Graphene-polymer Composite
[7]. Arai K et al 1986 Aluminum or Phosphorus Co‐doping Effects on the Fluorescence and Structural Properties of Neodymium‐doped Silica Glass J Appl. Phys vol 59 pp 3430-3436
[8]. Moulton P F et al Jan. 2009 Tm-Doped Fiber Lasers: Fundamentals and Power Scaling J Sel Top Quant vol 15 no 1 pp 85-92
[9]. Sincore A Bradford J D Cook J Richardson High Average Power Thulium-Doped Silica Fiber Lasers Review of Systems and Concepts J Sel Top Quant vol 24 no 3 pp 1-8
[10]. Jackson S D and Mossman S 2003 Efficiency Dependence on the Tm3+ and Al3+ Concentrations for Tm3+ -doped Silica Double-clad Fiber Lsers Appl Opt. vol 42 pp 2702-2707
[11]. Chen S Jung Y Alam S Richardson D Sidharthan R 2019 Ultra-short Wavelength Operation of Thulium-doped Fiber Amplifiers and Lasers


