


1. Introduction
As an important component of a free-market economy, the stock market allows companies to raise capital by offering stock shares while also makes possible for investors to make profits through dividends. The stock market is usually significantly bonded with the economic growth of a country as causality has been observed in the result of a Granger Causality Test between the average ratio of market capitalization to GDP, annual turnover to GDP, and the annual turnover to market capitalization and the real GDP [1]. Considering its great importance for economic growth, the topic related to stock market prediction has been in the limelight for decades. However, the accuracy of the predictions of the stock market has remained questionable since the stock market is dynamic and contains multiple uncertain factors [2]. With the developing sophistication of machine learning technology, researchers are now able to produce comparatively accurate predictions using deep learning models such as the Artificial or Recurrent Neural Network model (ANN/RNN) and Auto-Regressive Integrated Moving Average model (ARIMA) and are therefore able to advise the investors of the potential opportunities and the potential risks [3, 4].
Apple Inc. is an American software and hardware developer company headquartered in Silicon Valley that has a wide range of services and businesses around the globe. As a leading multinational technology corporation, Apple is the world’s first trillion-dollar company [5, 6]. As of March 2023, Apple was the world’s largest company by market capitalization, despite its position being overtaken by Microsoft earlier this year in January 2024, it still possesses a market cap of more than 2.85 trillion US dollars as of February 1, 2024. A lot of researchers have tried to evaluate the movement of the stock price of Apple before, using various statistical methods and mathematical models. For example, Ahmar focused on the use of the Sutte Indicator in the research and compared the outputted forecasting with the ones generated from Simple Moving Average (SMA) models and assisted the investment decision-making process to trade stock [7]. The ARIMA model is a time series analysis technique that extrapolates the pattern in the past observations of the data and forecasts the future by finding the linear relationship between the variable of interest and its past values [8]. Jordan utilized multiple methods including the ARIMA model, along with the Average, Vector Autoregression model, Exponential Smoothing, and Linear Time Series Regression model. According to Jordan’s research, the model that presents the best short-term (a 4-month period) stock price forecasting for Apple is the ARIMA model since it has the least Root Mean Square Error (RMSE) among all the models. However, the situation has changed when it comes to the prediction of the long-term (a 12-month period) stock price. The Averages and Vector Autoregression models perform the best while the ARIMA model has drastically underperformed [6]. Shakir and Hela built 3 ARIMA models and compared their accuracy in forecasting the stock price of Netflix from 7 April 2015 to 7 April 2020. Among their models, the ARIMA (1,2,33) model has a high accuracy of 99.75% within the measurement of its mean absolute percentage error [9, 10].
As a result, this paper aims to predict the stock price of Apple Inc. by utilizing the ARIMA model and will try to analyze the reason for significant fluctuations in it, such as the impact brought by the launching of new products or the influence on the whole technology market brought by external factors. Finally, this paper attempts to analyze the strengths and weaknesses of predicting the stock market using the ARIMA model.
2. Methodology
2.1. Data source
This paper uses the data of the daily stock price of Apple Inc. (this paper will hereinafter refer to the stock of Apple Inc. as its official ticker symbol, AAPL) in the past decade, from February 3, 2014, to January 31, 2024, obtained from Yahoo! Finance. This data set includes 2515 observations in total, each containing the daily opening price, closing price, highest point, lowest point, volume, and adjusted closing price for splits and dividend and/or capital gain distributions. This paper only analyzes the time series and tendency of the opening price of AAPL for consistency and simplicity, while its closing price should follow a similar general pattern as well.
2.2. Data preparation
Since the dataset obtained does not include any null values and all the data in the dataset are real historical data recorded by Yahoo Finance, further modification and preparation will not be necessary for the analysis. However, it is possible to compute the daily fluctuation in the opening price of AAPL by computing the differences of each two consecutive observations. This process is also known as differencing and will be further discussed later in this paper.
2.3. Method introduction
According to previous studies done by other researchers, this paper chooses the Autoregressive Integrated Moving Average (ARIMA) model to forecast the opening price of AAPL. Unlike more commonly seen multivariate linear regression models that forecast the variable of interest by finding the linear relationship between the dependent variable and several independent variables, in autoregressive models, the ARIMA model predicts the variable of interest by using a linear combination of the previous observations of the dependent variable itself. Therefore, the ARIMA model allows people to predict the tendency of the stock price by fitting the stock price in the past in the model. It has a set of parameters \( (p,d,q) \) indicating that it’s a combination of an Autoregressive model of order \( p (AR(p)) \) and a Moving Average model of order \( q (MA(q)) \) , with \( d \) degrees of difference involved. Generally, an ARIMA \( (p,d,q) \) model can be expressed as:
\( Δ{y_{t}}=c+{ϕ_{1}}Δ{y_{t-1}}+⋯+{ϕ_{p}}Δ{y_{t-p}}+{θ_{1}}{ϵ_{t-1}}+⋯+{θ_{q}}{ϵ_{t-q}}+{ϵ_{t,}}\ \ \ (1) \)
where \( {y_{t}} \) denotes the data observed at time \( t \) , \( p \) denotes the order of the auto-regressive model, \( q \) denotes the order of the moving average model, \( {ϕ_{1}}…{ϕ_{p}} \) and \( {θ_{1}}…{θ_{q}} \) are the coefficients of the two models respectively, and \( {ϵ_{t}} \) is the white noise.
3. Results and discussion
3.1. Data visualization and seasonality decomposition
Visualization of the data obtained by plotting the daily opening price of AAPL against the time is shown in the time series graph in Figure 1.
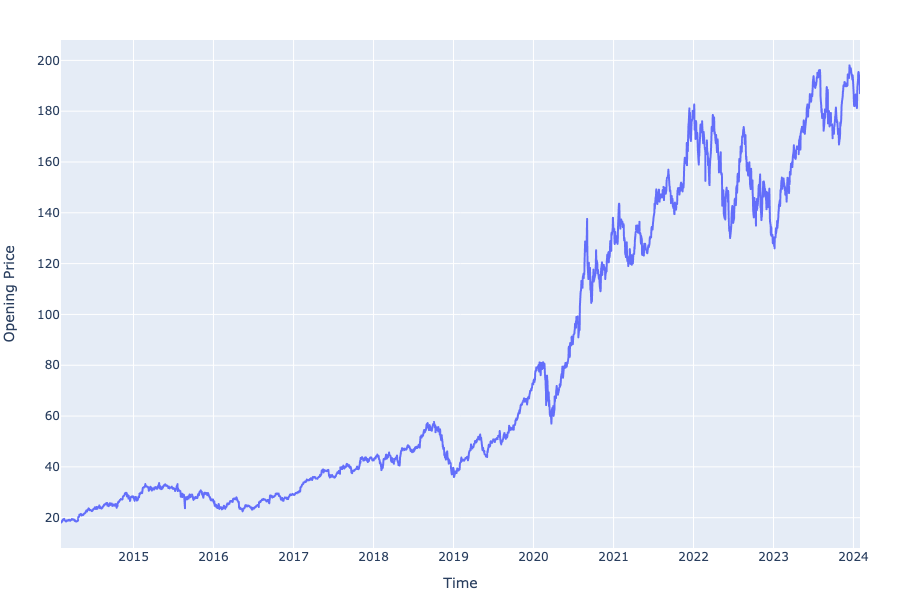
Figure 1. AAPL Opening Price in the Past Decade (2014-2024).
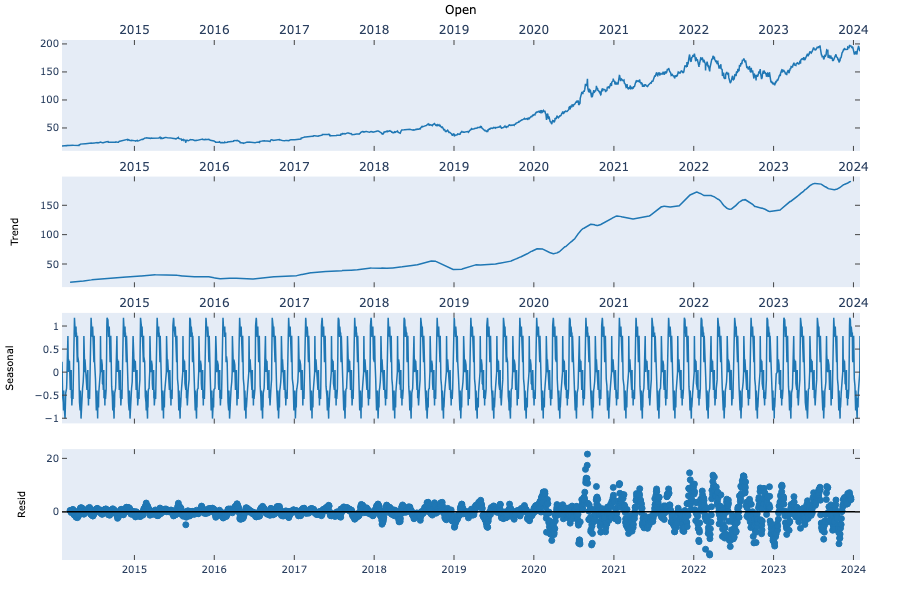
Figure 2. Seasonal Decomposition of the Daily Opening Price of AAPL.
As the result of the seasonal decomposition of the data, Figure 2 shows the general trend, seasonality, and residual of the daily opening price of AAPL. As can be observed from the graph, the data set displays certain seasonality with a seasonal lag of approximately 6 months. However, this paper has attempted to use the Seasonal ARIMA (SARIMA) model, yet the result yielded has not improved. Therefore, this paper will continue to analyze the data using the ARIMA model.
3.2. ACF and PACF
The Autocorrelation Function (ACF) and the Partial Autocorrelation Function (PACF) are crucial in finding the parameters of the Autoregressive (AR) and Moving Average (MA) models in the ARIMA model, where the ACF measures the average correlation between the data and its previous values measured for different time lags and the PACF, on the other hand, measures the correlation between shorter lag lengths (Figure 3 and 4).
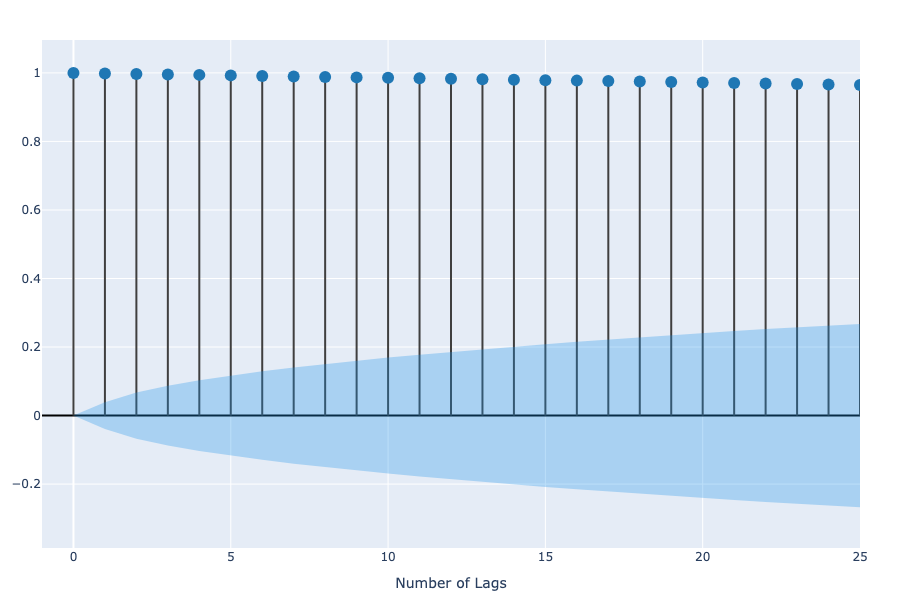
Figure 3. ACF of the AAPL Opening Price.
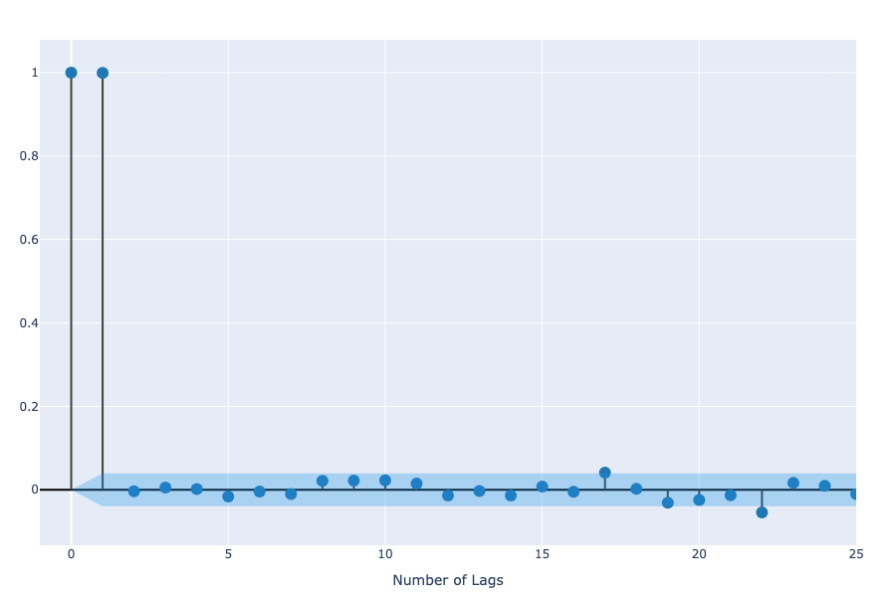
Figure 4. PACF of the AAPL Opening Price.
After establishing a basic understanding of the data using the above-mentioned statistical tools this paper obtained, an Augmented Dickey-Fuller test (ADF) is conducted to test whether the data set is stationary or not. This paper utilizes Python’s ‘statsmodel.tsa.stattools’ package to perform the ADF test on the obtained data set, and the test result is shown in Table 1. Since the P-value equals 0.9706 which is significantly larger than 0.05, this paper rejects the null hypothesis and conclude that the series is not stationary. This result indicates that differencing is needed for the data set to be able to use the ARIMA model and that the parameter d is at least 1 in the model this paper is using.
Table 1. Augmented Dickey-Fuller Test Result.
ADF Statistics | P-Value | 5% Critical Value |
0.1718 | 0.9706 | -2.8626 |
Inputting the obtained data set into auto_arima() function from Python’s statsmodel.tsa.stattools package, the function returns an order (1, 1, 1) as the non-seasonal (p, d, q) parameter of the ARIMA model. Generally, this means that the opening price of AAPL can be modeled by the equation:
\( Δ{y_{t}}=c+{ϕ_{1}}Δ{y_{t-1}}+{θ_{1}}{ϵ_{t-1}}+{ϵ_{t}},\ \ \ (2) \)
where \( {y_{t}} \) is the observation at time \( t \) , \( c \) is a constant, \( {ϕ_{1}} \) and \( {θ_{1}} \) are the coefficients of the Autoregressive model and the Moving Average model, and finally \( {ϵ_{t}} \) denotes the white noise in the prediction model.
3.3. Model results
Finally, the predicted opening price of AAPL is required by using the “ARIMA()” function in Python with the parameters outputted above. The statistics of the ARIMA(1, 1, 1) model are shown in Table 2 while the comparison of the forecasted values and the actual values of the opening price of AAPL is displayed in Figure 5.
Table 2. Statistical Result of the ARIMA(1,1,1) Model for the AAPL Opening Price.
Coefficient | Std Error | z | P > |z| | 0.025 | 0.975 | |
ar.L1 | 0.4416 | 0.174 | 2.543 | 0.011 | 0.101 | 0.782 |
ma.L1 | -0.4931 | 0.169 | -2.912 | 0.004 | -0.825 | -0.161 |
sigma2 | 3.2306 | 0.042 | 77.145 | 0.000 | 3.149 | 3.313 |
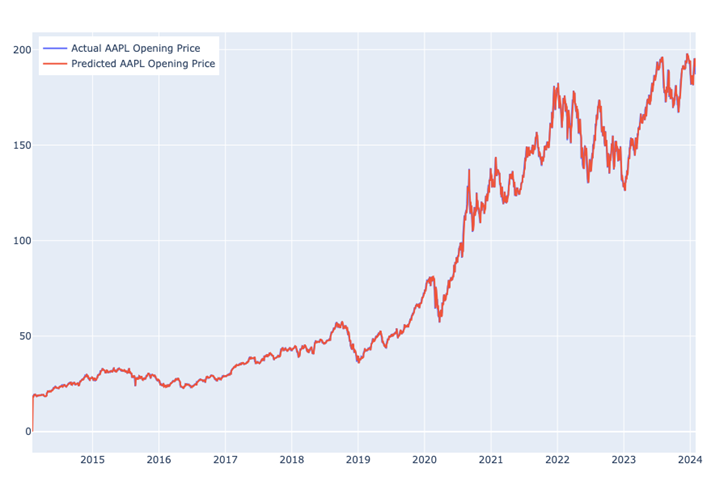
Figure 5. Predicted and Actual Daily Opening Price of AAPL in the Past Decade.
As shown in Figure 5, the predicted value fits the real value well, meaning that the ARIMA(1, 1, 1) model is a plausible model for forecasting the daily stock price of Apple. According to the error statistics computed and shown in Table 3, the Mean Absolute Percentage Error (MAPE) is only approximately 0.01315, indicating a rather high accuracy of the model. This has also been confirmed by checking the residual graph of the model. As Figure 6 shows, overall, the residuals are bounded within the range \( (-15, 15) \) US dollars every day. However, it is noticeable that the residuals of the predicted value are controlled within US $5 every day before the year 2020 and have an obvious tendency to increase after that time. Furthermore, a huge leap can be observed starting from 2020 from the original time-series graph of the AAPL opening price (Figure 1).
Table 3. Error Statistics of the ARIMA(1,1,1) Model.
Correlation | MAE | MAPE | MPE | RMSE |
0.9995 | 1.0676 | 0.0132 | -0.0012 | 1.8328 |
Considering the fact that the stock market will be easily affected by natural calamities, the author suspects that the COVID-19 pandemic may have greatly impacted the forecast of AAPL opening price. Therefore, this paper will now build 2 separate models to analyze the opening price of AAPL before and after the hit of the COVID-19 pandemic (Figure 6).
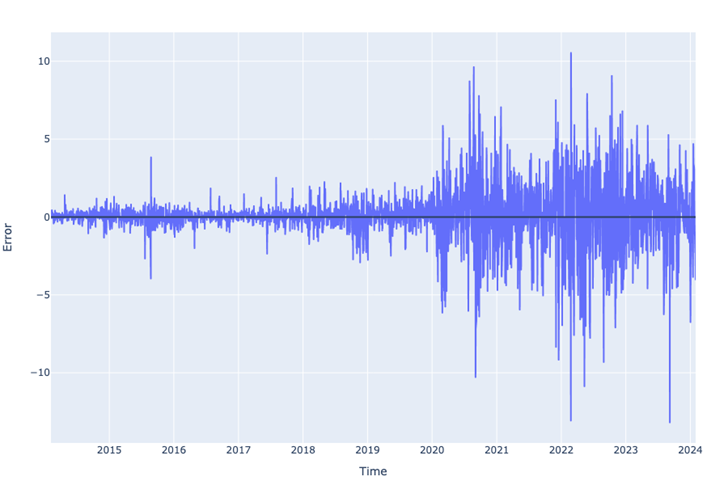
Figure 6. Residuals from the ARIMA (1,1,1) Model for AAPL Opening Price.
3.4. AAPL opening price before COVID-19
This paper defines the data obtained during the period February 4, 2014, to February 1, 2020, 1509 observations in total, as the pre-COVID AAPL opening price. Then, similar techniques have been applied to the data. The auto_arima() function returns the order (2, 1, 1) as the parameters for the ARIMA model. According to the statistical result shown in Table 4, the standard errors of data fitting are even smaller compared to the ARIMA (1, 1, 1) model for all the data introduced earlier (Table 4). The forecasted values and actual values of the opening price of AAPL are displayed in Figure 7.
Table 4. Statistical Result of the ARIMA(2,1,1) Model for the AAPL Opening Price.
Coefficient | Std Error | z | P > |z| | 0.025 | 0.975 | |
ar.L1 | 0.8718 | 0.028 | 30.854 | 0.000 | 0.816 | 0.927 |
ar.L2 | 0.1010 | 0.018 | 5.739 | 0.000 | 0.066 | 0.135 |
ma.L1 | -0.9542 | 0.023 | -41.324 | 0.000 | -0.999 | -0.909 |
sigma2 | 0.3625 | 0.007 | 52.998 | 0.000 | 0.349 | 0.376 |
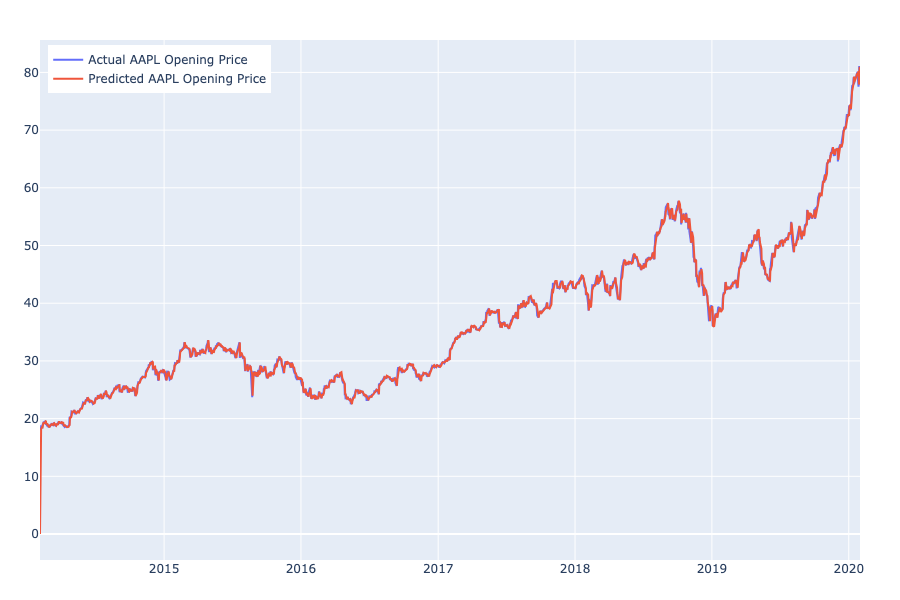
Figure 7. Predicted and Actual Daily Opening Price of AAPL Before COVID-19.
However, since there are too many observations plotted, the time series graph is unable to provide a detailed look for further analysis. Therefore, Table 5 and Figure 8 show the error statistics and the residual plot respectively.
Table 5. Error Statistics of the ARIMA(2,1,1) Model.
Correlation | MAE | MAPE | MPE | RMSE |
0.9981 | 0.4184 | 0.0117 | -0.0012 | 0.7606 |
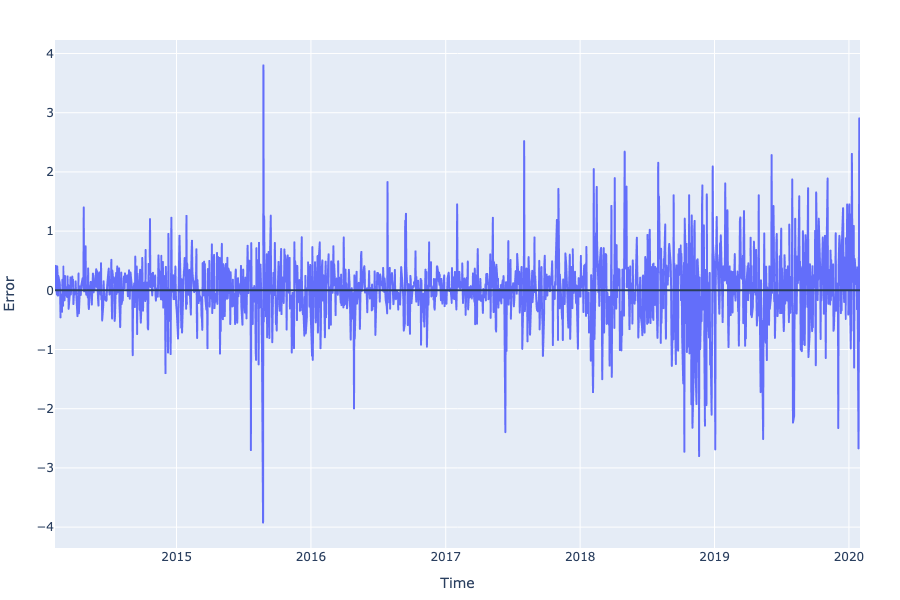
Figure 8. Residuals from the ARIMA(2,1,1) Model for Pre-COVID Data.
As can be seen from Table 5, the Mean Absolute Percentage Error (MAPE) has dropped to approximately 0.01175 from approximately 0.01315 of the previous ARIMA(1, 1, 1) model for the whole data set, indicating an even smaller error and higher accuracy. This conclusion can also be confirmed by the residual plot shown in Figure 8, with errors bounded within the range (-4, 4) US Dollars.
3.5. AAPL opening price after COVID-19
This paper defines the rest of the data in the data set obtained, i.e. the opening price of AAPL from February 1, 2020, to January 31, 2024, a total of 1006 observations as the post-COVID stock price. The auto_arima() function returns \( (0, 1, 0) \) as the parameters for the ARIMA model, indicating that the degrees of the Autoregressive model (AR) and Moving Average model (MA) are both 0 in this case, the data are only differenced once without any other computation (Table 6).
Table 6. Statistical Result of the ARIMA(0,1,0) Model for Post-COVID Data.
Coefficient | Std Error | z | P > |z| | 0.025 | 0.975 | |
sigma2 | 7.5394 | 0.240 | 31.475 | 0.000 | 7.070 | 8.009 |
The fitted values and the real AAPL Opening Price are plotted in Figure 9. It is easily noticed that more parts of the blue line which indicates the actual AAPL opening price can be observed from the graph, revealing that the ARIMA(0, 1, 0) model is less accurate for the data collected after the COVID-19 pandemic.
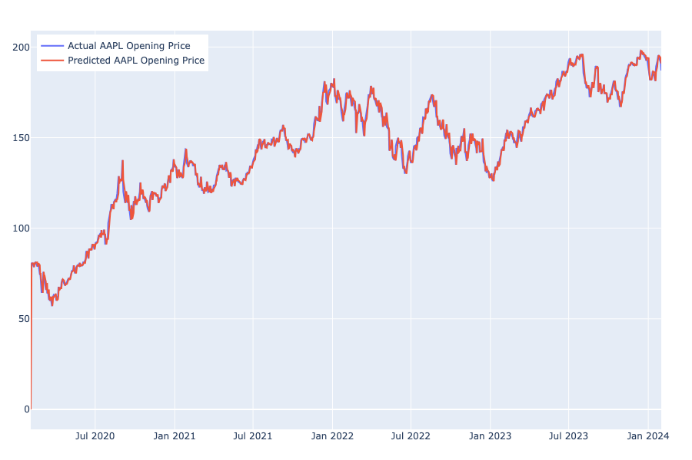
Figure 9. Predicted and Actual Daily AAPL Opening Price after COVID-19.
There is also an apparent increase in the Mean Absolute Percentage Error (MAPE), from approximately 0.01315 of the general ARIMA(1, 1, 1) model for all data regardless of the effect of the pandemic to approximately 0.01613 in this model shown in Table 7, indicating that the model is not as accurate when forecasting the post-COVID data. This result can also be confirmed by the residual plot shown in Figure 10.
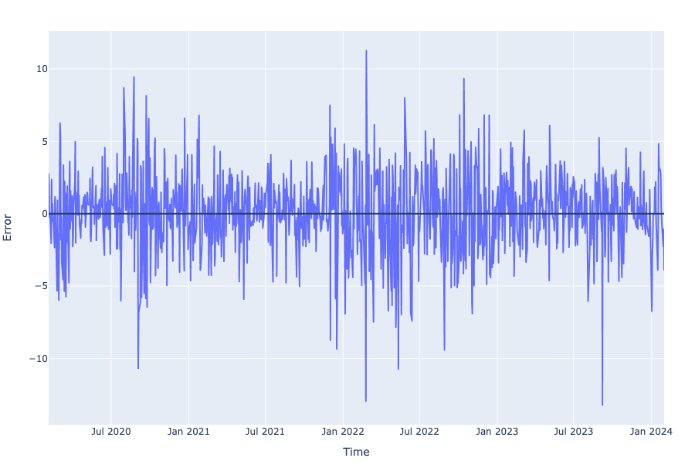
Figure 10. Residuals of the ARIMA(0,1,0) Model for Post-COVID Data.
Table 7. Error Statistics of the ARIMA(0,1,0) Model.
Correlation | MAE | MAPE | MPE | RMSE |
0.9939 | 2.1086 | 0.0161 | -0.0017 | 3.6448 |
The residuals generated from the ARIMA(0, 1, 0) model generally display a larger fluctuation and even exceed plus or minus US$10 at some point.
4. Conclusion
Based on the three ARIMA models established above, it is obvious that the outbreak of COVID-19 pandemic has brought certain effects to the stock market as the residual of the ARIMA(0, 1, 0) model for the post-pandemic opening price has significantly increased compared to that of the ARIMA(2, 1, 1) model for the pre-pandemic stock price. However, despite the increase in the residual during the pandemic, the ARIMA models generally successfully forecasted the stock opening price of Apple company with considerable accuracy. The research manifests that the ARIMA model is to some extent capable of predicting the stock price but also reveals its sensitivity to sudden changes caused by natural calamities such as the global pandemic since it only requires historical data and achieves stationarity by conducting differencing without considering external factors. On the other hand, as the world economy gradually recovers from the impact of COVID-19, the stock market may be less affected by uncontrolled external factors and therefore may allow researchers to produce more accurate predictions in the future.
References
[1]. Surya B G C 2006 Stock Market and Economic Development: A Causality Test. The Journal of Nepalese Business Studies, 3, 1.
[2]. Song D, Chung B A and Kim N 2021 Forecasting Stock Market Indices Using Padding-Based Fourier Transform Denoising and Time Series Deep Learning Models. in IEEE Access, 9, 83786-83796.
[3]. Sun L and Yuan H 2023 Research on the Tencent Company Stock Price Based on ARIMA Model. Advances in Economics, Management and Political Sciences.
[4]. Ahmar A 2016 Predicting Movement of Stock of Apple Inc Using Sutte Indicator. Proceedings The 3rd AISTSSE Trends in Science and Science Education.
[5]. Tiao G C 2001 Time Series: ARIMA Methods. International Encyclopedia of the Social & Behavioral Sciences. Pergamon, 15704-15709.
[6]. Khan S and Alghulaiakh H 2020 ARIMA Model for Accurate Time Series Stocks Forecasting. International Journal of Advanced Computer Science and Applications, 11.
[7]. Mehar V, et al. 2020 Stock Closing Price Prediction using Machine Learning Techniques. Procedia Computer Science, 167, 599-606.
[8]. Fang Y Q, Lu Z and Ge J W 2022 Joint RMSE loss LSTM CNN model for stock price prediction. Computer Engineering and Applications.
[9]. Zhang R X and Hao Y T 2023 Research on Stock Price Prediction Based on Deep Learning. Computer Knowledge and Technology, 33, 8-10.
[10]. Yang M and Wang J 2023 A spatial-temporal attention based BiLSTM for stock index prediction. Operations Research and Management Science, 32(8), 174-180.
Cite this article
Li,G. (2024). Predicting the stock opening price of Apple company. Theoretical and Natural Science,39,14-22.
Data availability
The datasets used and/or analyzed during the current study will be available from the authors upon reasonable request.
Disclaimer/Publisher's Note
The statements, opinions and data contained in all publications are solely those of the individual author(s) and contributor(s) and not of EWA Publishing and/or the editor(s). EWA Publishing and/or the editor(s) disclaim responsibility for any injury to people or property resulting from any ideas, methods, instructions or products referred to in the content.
About volume
Volume title: Proceedings of the 2nd International Conference on Mathematical Physics and Computational Simulation
© 2024 by the author(s). Licensee EWA Publishing, Oxford, UK. This article is an open access article distributed under the terms and
conditions of the Creative Commons Attribution (CC BY) license. Authors who
publish this series agree to the following terms:
1. Authors retain copyright and grant the series right of first publication with the work simultaneously licensed under a Creative Commons
Attribution License that allows others to share the work with an acknowledgment of the work's authorship and initial publication in this
series.
2. Authors are able to enter into separate, additional contractual arrangements for the non-exclusive distribution of the series's published
version of the work (e.g., post it to an institutional repository or publish it in a book), with an acknowledgment of its initial
publication in this series.
3. Authors are permitted and encouraged to post their work online (e.g., in institutional repositories or on their website) prior to and
during the submission process, as it can lead to productive exchanges, as well as earlier and greater citation of published work (See
Open access policy for details).
References
[1]. Surya B G C 2006 Stock Market and Economic Development: A Causality Test. The Journal of Nepalese Business Studies, 3, 1.
[2]. Song D, Chung B A and Kim N 2021 Forecasting Stock Market Indices Using Padding-Based Fourier Transform Denoising and Time Series Deep Learning Models. in IEEE Access, 9, 83786-83796.
[3]. Sun L and Yuan H 2023 Research on the Tencent Company Stock Price Based on ARIMA Model. Advances in Economics, Management and Political Sciences.
[4]. Ahmar A 2016 Predicting Movement of Stock of Apple Inc Using Sutte Indicator. Proceedings The 3rd AISTSSE Trends in Science and Science Education.
[5]. Tiao G C 2001 Time Series: ARIMA Methods. International Encyclopedia of the Social & Behavioral Sciences. Pergamon, 15704-15709.
[6]. Khan S and Alghulaiakh H 2020 ARIMA Model for Accurate Time Series Stocks Forecasting. International Journal of Advanced Computer Science and Applications, 11.
[7]. Mehar V, et al. 2020 Stock Closing Price Prediction using Machine Learning Techniques. Procedia Computer Science, 167, 599-606.
[8]. Fang Y Q, Lu Z and Ge J W 2022 Joint RMSE loss LSTM CNN model for stock price prediction. Computer Engineering and Applications.
[9]. Zhang R X and Hao Y T 2023 Research on Stock Price Prediction Based on Deep Learning. Computer Knowledge and Technology, 33, 8-10.
[10]. Yang M and Wang J 2023 A spatial-temporal attention based BiLSTM for stock index prediction. Operations Research and Management Science, 32(8), 174-180.