


1. Introduction
The first paper “Is There a Bias Against Education in the Jury Selection Process?”, written by Hillel Y. Levin and John W. Emerson in 2006, presented a study conducted in the United States District Court for the District of Connecticut to examine biases in the jury selection process, specifically related to the educational background of jurors [1]. The research found no statistically significant evidence of biases against education at any stage of the selection process, contrary to prevailing theories. And it suggests that juries are not systematically undereducated and provide valuable insights for policy discussion on jury selection and the need for empirical analysis in such matters. The second paper “Nationalistic Judging Bias in the 2000 Olympic Diving Competition”, written by John W. Emerson and Silas Meredith, examines nationalistic judging bias in the 2000 Olympic diving competition [2]. The study analyzes scoring data to determine if judges from certain countries showed favoritism toward their own divers, leading to potentially biased results. And the findings indicate that nationalistic bias was prevalent among many judges, which could have influenced the outcomes of very close competitions.
We chose these two papers for our reproduction because both papers address crucial issues related to biases in scoring and judgment, which are prevalent concerns in various domains, including sports competitions and legal proceedings, and the original papers presented compelling results indicating the presence of biases. Reproducing such influential findings is essential to validate their robustness and generalizability. By reproducing the studies, we can strengthen the evidence base and contribute to the scientific understanding of bias in scoring. Understanding and mitigating biases in these contexts are vital for ensuring fairness and impartiality. Moreover, the topics covered in these papers have real-world implications. Lastly, the availability of the dataset and our interest and curiosity in these topics drive us to finish this reproduction process.
The main focus of this report is undoubtedly reproducing the results from the two papers, and challenging the reproducibility of the results. Our study aimed to reproduce and validate the findings of the original paper, which sought to investigate the potential bias introduced by the level of education in jury selection. To achieve this objective, we adopted a systematic and comprehensive methodology, closely following the approach outlined in the original paper.
Throughout our investigation, we meticulously curated relevant subsets of data and applied visualization techniques and statistical tests to examine the relationship between education levels and jury composition. We utilized histogram visualizations to explore the distribution of education levels across different groups, seeking to identify any significant discrepancies that may indicate bias in the jury selection process.
Prior work in the field of bias in judging and scoring has seen various studies examining biases in sports competitions, jury selection, and other contexts. The original papers that form the basis of our report have contributed significantly to this area of research. The first paper delved into jury selection and uncovered intriguing insights into the potential presence of educational bias in the process. The second paper shed light on biases in the Olympic diving competition, providing evidence of nationalistic tendencies among judges. Some prior research has also delved into the impact of biases in jury selection, highlighting the significance of impartiality and fairness in the legal system.
The dataset we used in our reproduction process are the same as the ones used in the original papers, which are available for us to access. The report is structured as follows: Section 2.1 and 3.1 provides a comprehensive description of the data, detailing the data processing and merging techniques employed. In Section 2.2 and 3.2, we present our exploration and analysis of the two datasets, discussing the methodologies and findings. In Section 5, Finally, the report concludes with an examination of the significance of the reproduced results and their implications in understanding biases in scoring within the studied contexts. The rigorous reproduction process and alignment of the results reinforce the importance of examining biases in judging to uphold fairness and integrity in sports competitions.
2. Jury Selection
2.1. Data and Methods —— Jury Selection
As we embarked on the replication of the article, it was imperative to ensure the integrity and reliability of the data utilized, which necessitated a comprehensive data cleaning process. Throughout this process, we encountered a significant challenge in comprehending the implications of the “code” and “jcp” columns, as presented in the article’s content. The intricacies inherent in the jury selection process necessitated a substantial investment of time to decipher and align the labels within the provided CSV file to their respective group designations. To aid in our comprehension of the data, we consequently constructed a comprehensive reference table, which proved indispensable in elucidating the underlying patterns and relationships within the dataset.
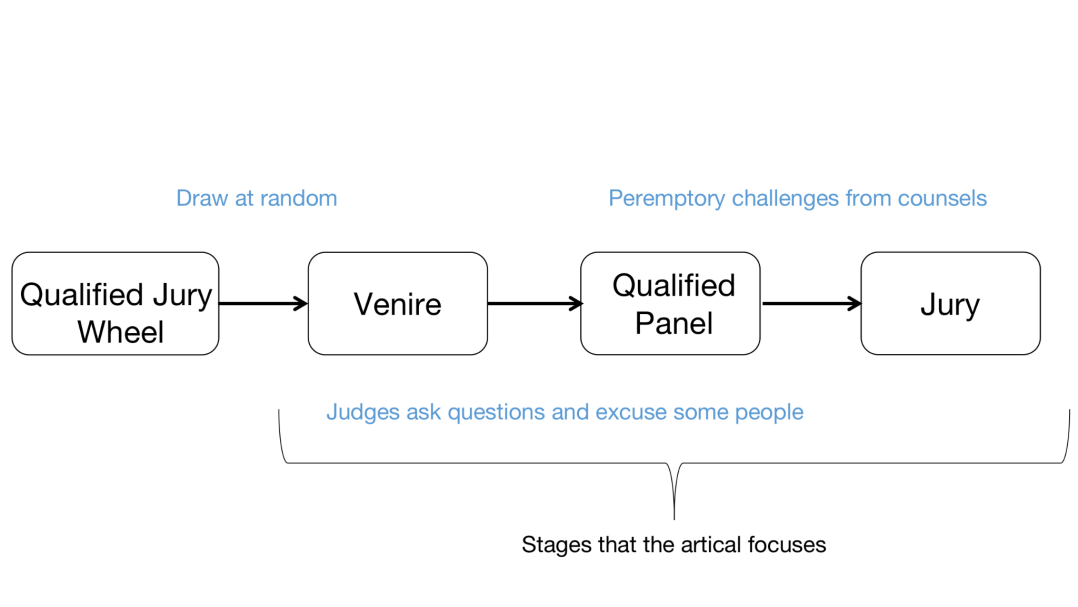
Figure 1. Flow Chart of the Jury Selection Process [3]
Table 1. Overview of Complex Terms in the Dataset
Difficult words to identify | Meaning | Expression in the data set |
Venire | People chosen at random on that day | All the people in the data set are venire, which is x |
Qualified panel | People who were not excused after the judge questioned them | People listed as “NCP” in the “jcp” column or “code” column in the data set |
Prosecution Challenges | People who was removed at the final stage by counsel for the prosecution | People listed as “PP” in “code” column in the data set |
Defense Challenges | People who was removed at the final stage by counsel for the defense | People listed as “PD” in “code” column in the data set |
Jury | The final jury members after three screenings | People listed as “J” in the “code” column in the data set |
2.2. Results
The present study adopts a comprehensive methodology to examine the survey results pertaining to jury selection. Initially, we conduct an in-depth analysis using R language [4] by aggregating data across all juries (Venire vs. Jury) to meticulously assess the presence of potential biases. The investigation reveals no indications of systematic biases when comparing jury composition to venires.
Proceeding to the subsequent phase, we further analyze the aggregated jury venires in comparison to panels qualified by judges, scrutinizing the tendency of judges to disproportionately excuse individuals with higher education levels—an assumption that has been widely accepted. To achieve this, we separately constructed two histograms—one for criminal cases (Figure 2) and another for civil cases (Figure 3).
In analyzing the histograms presented in figure 2 and figure 3, we carefully examined the distribution of education levels in the aggregated jury venires and compared them to the panels qualified by judges, for both civil and criminal cases. The red curves were overlaid on the histograms to provide a smooth representation of the data, allowing us to visualize the underlying trends and variations more clearly. By adding the red curves to each histogram, we could easily identify any potential disparities or patterns in the data related to education levels. Specifically, we looked for differences in the distribution of education levels between the two groups (jury venires and panels qualified by judges) to assess whether judges tended to disproportionately excuse individuals with higher education. The consistency of the red curves across the histograms further supported the absence of significant biases, as the distributions appeared remarkably similar. This meticulous visual analysis, supplemented by appropriate statistical tests, contributed to our conclusive findings that there were no substantial systematic biases based on education levels in the jury selection process for both criminal and civil cases.
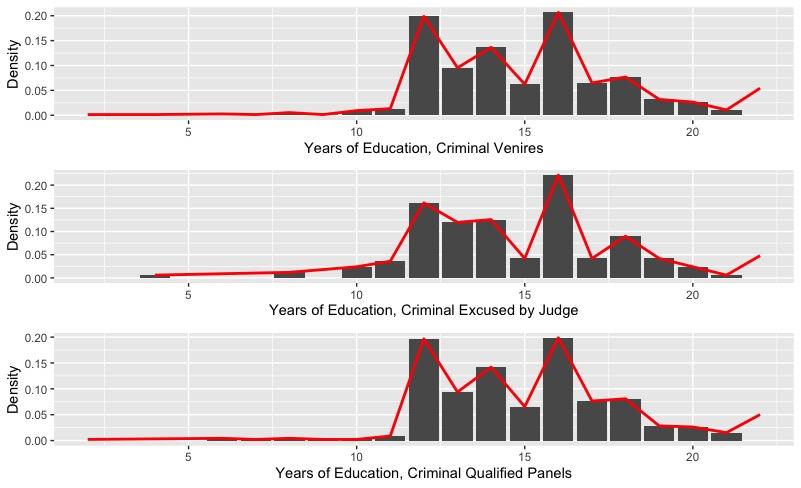
Figure 2. Distribution of Education Levels in Aggregated Jury Venires vs. Panels Qualified by Judges for Civil Cases
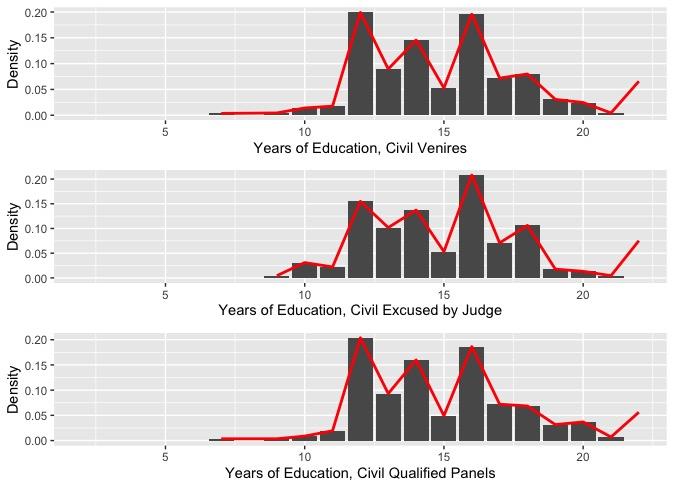
Figure 3. Distribution of Education Levels in Aggregated Jury Venires vs. Panels Qualified by Judges for Criminal Cases
Subsequently, we expanded our inquiry to investigate peremptory challenges exercised by attorneys. To facilitate comparative analysis, we employed histogram distributions to explore potential associations between the Years of Education and various aspects of jury selection, such as Criminal Qualified Panels, Criminal Prosecution Challenges, Criminal Defense Challenges, and Criminal Juries.
Remarkably, the outcomes of these analyses did not yield substantial evidence to support the hypothesis of systematic biases in jury selection. These findings were particularly surprising as they contradicted initial expectations and preconceived notions concerning the presumed relationship between education levels and the jury selection process.
In adhering to the original paper’s train of thought, we diligently reproduced their analyses and procedures to ensure consistency in our findings. However, upon conducting our rigorous analyses, we consistently obtained results that aligned with the original paper’s conclusions. Specifically, we found no substantial disparities in the histograms, which led us to the same conclusion as the original paper: education level does not exert a significant impact on jury selection.
To verify our findings, we performed 2-sample t-tests comparing the excused jurors to the qualified panelists. The p-values obtained from these tests, all greater than 0.1, supported our conclusion that there is no statistically significant difference between the education levels of these two groups. Additionally, we conducted t-tests comparing Prosecution / Defense Plaintiff Challenges to the jury. Only one p-value was found to be smaller than 0.1, indicating a potential difference in education levels between these groups. However, when performing t-tests comparing defense and plaintiff challenges, we found no p-values smaller than 0.1, suggesting no significant disparity in education levels.
Table 2. T-Tests comparing Prosecution / Defense Plaintiff Challenges to the Jury
case | Our p-value 1 | p-value 1 | Our p-value 2 | p-value 2 |
1 | 0.32 | 0.33 | 0.79 | 0.77 |
2 | 0.59 | 0.59 | 0.04 | 0.02 |
3 | 0.33 | 0.33 | 0.67 | 0.63 |
4 | 0.83 | 0.83 | 0.35 | 0.33 |
5 | 0.75 | 0.76 | 0.89 | 0.89 |
6 | 0.81 | 0.80 | 0.17 | 0.16 |
7 | 0.59 | 0.59 | 0.74 | 0.72 |
8 | 0.42 | 0.42 | 0.67 | 0.68 |
9 | 0.25 | 0.25 | 0.34 | 0.35 |
10 | 0.95 | 0.95 | 0.22 | 0.16 |
11 | 0.00007748 | <0.0001 | 1.00 | 1.00 |
12 | 0.71 | 0.72 | 0.47 | 0.47 |
During the t-test procedure, we encountered a slight discrepancy between our results and those reported in the original paper. The p-values in the original paper are “p-value 1 and p-value 2”, whereas the p-values we generated are “Our p-value1, Our p-value 2”; thus, there is always a difference between two columns of data. Upon further investigation, we identified that the assumption of equal variance in the two datasets played a crucial role in achieving consistent outcomes. Given the similarity and small size of the datasets, we appropriately set the var.equal parameter to TRUE in the t-test, aligning our results with the table presented in the original paper. Although this specific point was not explicitly mentioned in the original paper, we believe our updated annotations would enhance the reproducibility and clarity of our findings.
As a result of this reproduction study, we have corroborated the original paper’s findings and confirmed the lack of evidence supporting the presence of bias based on education levels in the jury selection process. Our adherence to the original paper’s methodology and comparison of results have added confidence to the validity of the initial research and its contribution to the understanding of fair and unbiased jury selection.
3. Diving2000
3.1. Data And Methods —— Diver’s Score
The focus of the article “Nationalistic Judging Bias in the 2000 Olympic Diving Competition” by John W. Emerson and Silas Meredith is to explore potential indications of nationalistic bias in the judging of the 2000 Olympic diving events. The choice of this specific competition is ideal due to the high degree of data transparency and accessibility; each score is paired with the nationality and identity of its judge. The data for this study were sourced from official score records. The analytical processing was done using the R Language and Environment for Statistical Computing. The data and the R code utilized for this investigation can be accessed at http://www.stat.yale.edu/~jay/diving.
Throughout the 2000 Olympic competition, there were a total of 25 judges who assessed 1541 dives performed by 156 divers across these four events. The judges used a scoring system ranging from 0 to 10 in increments of 0.5, with an average score of 6.83 and a median score of 7.
The researchers conducted an analysis focusing on the 3-meter springboard and 10-meter platform events for both male and female participants. Each of these events consisted of three rounds, and each round involved 4-6 dives that were evaluated by a panel of seven judges representing various countries. To ensure fairness, judges were not allowed to evaluate divers from their own country during the final round of the competition. Nonetheless, the researchers identified 314 dives that were scored by a judge whose nationality matched that of the respective diver. These specific “matching” or “matched” dives were the main focus of their analysis.
3.2. Results
Starting with a hypothesis of bias existence, the authors narrow down their definition to “bias” during the process of finding proof for it. The reproduction process began with Table 1, showing higher scores given by Judge Wang to Chinese diver Xiong in the 2000 Olympic diving semifinals. This led to the consideration of Bias Description 1 (BD1) in the paper, which suggests biased judgment favoring one’s countrymen. However, the higher scores for Chinese divers were justified by their overall better performance, challenging the assumption of BD1.
Subsequently, Bias Description 2 (BD2) was explored, which accounts for dive quality by comparing a judge’s scores to the panel average. Though initially indicating potential bias, further analysis revealed that Wang’s scoring behavior demonstrated enthusiasm for all divers, not just Chinese, undermining the accuracy of BD2 in identifying nationalistic bias in his judgments. And this leads to the discussion of BD3.
Under Bias Description 3 (BD3), which characterizes biased judges as those who exhibit a propensity to assign higher scores to athletes from their own country while not displaying the same inclination towards non-country athletes, a comparative analysis of Judge Wang and Judge Steve McFarland yields noteworthy observations. Both judges demonstrated a tendency to assign elevated scores to divers from their respective countries, indicating a form of national bias. However, diverging from this pattern, Judge McFarland exhibited a less balanced approach, as he did not show similar enthusiasm in awarding high scores to non-country divers. In contrast, Judge Wang displayed a more consistent scoring pattern by granting higher scores to both Chinese and non-Chinese divers, suggesting a potentially more impartial judging style in comparison to Judge McFarland’s discernible bias favoring American divers. These findings highlight the nuances in judges’ scoring behaviors and underscore the importance of recognizing and addressing biases in sports judging contexts.
To ascertain whether American judge Steve McFarland’s scoring discrepancies could be attributed to chance, researchers employed a permutation test, a statistical technique widely used for bias assessment. The term “discrepancy” refers to the difference between a specific judge’s score and the untrimmed mean of scores provided by all seven judges. The Difference of Average Discrepancies (DoAD) is a metric used to quantify potential bias in judgment. It is calculated by subtracting the discrepancy for non-matched dives from the discrepancy for matched dives assigned by the same judge. To create a sampling distribution under the assumption of an unbiased judge, the researchers performed multiple iterations of the permutation test, randomly reassigning the observed discrepancies to different drives or permuting nationality labels among the divers. By analyzing this distribution, researchers could estimate the probability of McFarland’s DoAD being +0.1902 or higher due to chance alone, providing crucial evidence for assessing bias in his scoring behavior within the sports judging context.
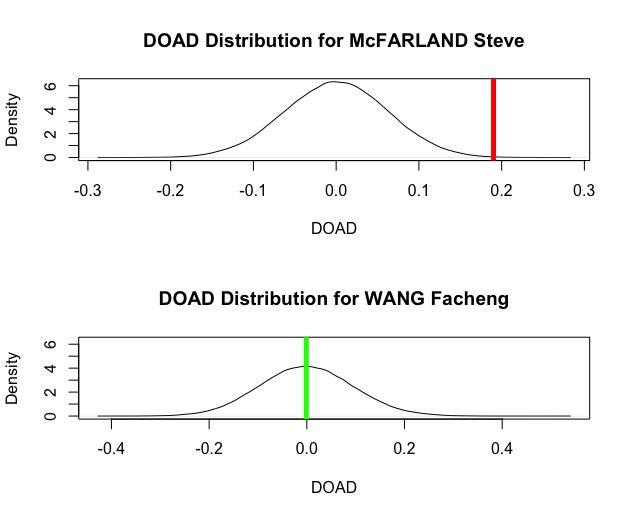
Figure 4. DOAD Distributions for two Judges
The graphs presented in Figure 4 depict the estimated sampling distributions of the test statistics for Judges Wang and McFarland, considering that discrepancies occur independently of nationality. The vertical lines in the graphs represent the observed values of the Difference of Average Discrepancies (DoAD) obtained from the actual competition data. For Judge Wang, the observed DoAD was proximate to zero, yielding a corresponding p-value close to 0.5. This suggests a 50% likelihood of a fair judge having a DoAD larger than 0. In contrast, for Judge McFarland, the observed DoAD was +0.1902, and the corresponding p-value was 0.00114. This indicates a considerably low probability of observing a DoAD as extreme as +0.1902 if his discrepancies were independent of the divers’ nationality. The tiny area under the curve to the right of the red line in the graph provides strong evidence supporting the conclusion that McFarland’s judgment exhibited a bias towards American divers.
Additionally, we employed the permutation test to shuffle the difference values for matched dives with American divers, calculating the permuted DoAD. Recognizing the need for robust evidence, we extended our analysis to include permutation tests on multiple judges. This approach strengthened the reliability and validity of our conclusions regarding potential biases in scoring towards American divers. Conducting permutation tests on various judges provided a comprehensive understanding of bias in sports judging contexts.
Table 3. Results for Permutation Test
Judge | Number of Matches Dives | Average Discrepan-cy for Matched Dives | Number of Non- Matched Dives | Average Discrepancy for Non- Matched Dives | DOAD | p-value |
Alt, Walter(GER) | 25 | +0.31 | 473 | -0.08 | 0.39 | 0 |
Barnett, Madeleine(AUS) | 38 | +0.18 | 623 | -0.11 | 0.29 | 2e-05 |
Boothroyd, Sydney(GBR) | 16 | +0.32 | 395 | +0.44 | 0.28 | 0.00413 |
Boussard, Michel (FRA) | 10 | 0.00 | 692 | -0.11 | 0.11 | 0.17786 |
Boys, Beverley (CAN) | 13 | +0.27 | 398 | +0.06 | 0.21 | 0.0209 |
Burk, Hans-Peter (GER) | 10 | +0.37 | 149 | -0.09 | 0.46 | 3e-04 |
Calderon, Felix (PUR) | 5 | +0.23 | 712 | -0.07 | 0.30 | 0.06857 |
Cruz, Julia (ESP) | 11 | +0.29 | 475 | -0.02 | 0.30 | 0.00298 |
Geissguhler, Michael (SUI) | 3 | +0.67 | 398 | -0.01 | 0.68 | 0.00134 |
Huber, Peter (AUT) | 8 | +0.31 | 374 | 0.00 | 0.31 | 0.01563 |
McFarland, Steve (USA) | 42 | +0.20 | 615 | +0.01 | 0.19 | 0.00114 |
Mena, Jesus (MEX) | 28 | +0.25 | 828 | -0.06 | 0.30 | 4e-05 |
Ruiz-Pedreguera, Rolando (CUB) | 11 | +0.29 | 470 | +0.01 | 0.28 | 0.00344 |
Seamen, Kathy (CAN) | 16 | +0.15 | 265 | -0.00 | 0.16 | 0.07389 |
Wang, Facheng (CHN) | 22 | +0.17 | 335 | +0.17 | 0.00 | 0.49576 |
Xu, Yiming (CHN) | 18 | +0.30 | 263 | +0.04 | 0.26 | 0.00138 |
Zaitsev, Oleg (RUS) | 38 | +0.27 | 557 | -0.02 | 0.28 | 2e-05 |
Table 3 presents the results of permutation tests and t-tests conducted on various judges in the 2000 Olympic diving competition to examine the presence of nationalistic bias. The table depicts the average discrepancies for judges’ scoring of matched and unmatched dives. The low p-values obtained from both the permutation tests and t-tests provide robust evidence of nationalistic bias, with a majority of judges displaying a tendency to favor their countrymen in their scoring.[5]
This table enhances the thoughtfulness and universality of our research, thus mitigating the potential fallacy of composition. By individually analyzing the scoring patterns of the judges, we are able to draw more nuanced conclusions regarding the existence of nationalistic bias in the competition. However, we acknowledge that numerous other factors warrant consideration, as previously stated in the paper. These additional aspects are addressed in more advanced studies that employ advanced techniques, such as linear algebra, to delve further into the subject. Nonetheless, for the scope of reproducing the current paper, the factors expressed in Table 3 suffice.
After our effort trying to reproduce the results in the table, we eventually obtained almost the same data in the table. This has great importance as it is the symbol that the paper written by Emerson is both reproducible and accurate.
4. Conclusion
Reproduction plays a pivotal role in scientific pursuits, as it not only verifies results but also aids in comprehending the logical sequence that leads to those outcomes. Consequently, this fosters scientific collaboration and the collective accumulation of knowledge, as fellow researchers can confidently delve into the same dataset and methods to conduct further investigations and confirm the findings.
According to the results we got, we have the conclusion that the reproducibility of both papers is quite high. We obtained the results by using our code to demonstrate the results accurately. Throughout the reproduction process, we encountered several challenges that required careful consideration and exploration. These challenges included the need to comprehend certain assumptions before obtaining p-values and deciphering the intricate logic presented in the advanced paper on diving results. This is an important part of the reproduction. While some part or detailed information is not presented in the paper we read, we need to think thoroughly about the contexts and carry our different assumptions of potential condition in the paper. For example, for the jury data, when we tended to test the p-value with annotations of 73 and 74 on the last page, we always found that our results always have a little bit of difference(around 0.01-0.02) with the results in the paper. We were confused at first but later found the pre-assumption which is the utilizing of pooled estimates when comparing two columns of data. Besides, we also gave our own opinions about both our p-value and the p-value in the paper.
Even after successfully reproducing the results, our assessment of reproducibility remained ongoing. Comparing the methods, we actually could find much intercommunity. Subsequently, we formulated our own judgments regarding the appropriateness of the methods employed in the paper to arrive at its conclusions, asserting that the methods used are indeed viable for obtaining the stated outcomes.
Acknowledgement
All the authors contributed equally to this work and should be considered as co-first author.
References
[1]. Levin H Y, Emerson J. Is There a Bias Against Education in the Jury Selection Process?[J].Social Science Electronic Publishing, 2006, 38(3).
[2]. Emerson, J.W. and Meredith, S., 2011. Nationalistic judging bias in the 2000 Olympic diving competition. Math Horizons, 18(3).DOI: 10.4169/194762111X12954578042812.
[3]. Null R C T R, Team R, Null R C T, et al. R: A language and environment for statistical computing[J]. Computing, 2011, 1:12-21. DOI:10.1890/0012-9658(2002)083[3097:CFHIWS] 2.0.CO;2.
[4]. Reider, B. J ury Selection[J]. The American Journal of Sports Medicine, 2006, 34(4):541-541.DOI:10.1177/0363546506287183.
[5]. Zitzewitz E. Nationalism in Winter Sports Judging and Its Lessons for Organizational Decision Making[J].Journal of Economics & Management Strategy, 2006, 15(1):67–99.DOI:10.1111/j.1530-9134.2006.00092.x.
Cite this article
Guo,J.;Mai,Y.;Wang,C.;Hao,C.;Wang,Z. (2024). Reproduction of two studies discussing bias: Jury selection bias and Diving2000 findings. Theoretical and Natural Science,34,342-350.
Data availability
The datasets used and/or analyzed during the current study will be available from the authors upon reasonable request.
Disclaimer/Publisher's Note
The statements, opinions and data contained in all publications are solely those of the individual author(s) and contributor(s) and not of EWA Publishing and/or the editor(s). EWA Publishing and/or the editor(s) disclaim responsibility for any injury to people or property resulting from any ideas, methods, instructions or products referred to in the content.
About volume
Volume title: Proceedings of the 3rd International Conference on Computing Innovation and Applied Physics
© 2024 by the author(s). Licensee EWA Publishing, Oxford, UK. This article is an open access article distributed under the terms and
conditions of the Creative Commons Attribution (CC BY) license. Authors who
publish this series agree to the following terms:
1. Authors retain copyright and grant the series right of first publication with the work simultaneously licensed under a Creative Commons
Attribution License that allows others to share the work with an acknowledgment of the work's authorship and initial publication in this
series.
2. Authors are able to enter into separate, additional contractual arrangements for the non-exclusive distribution of the series's published
version of the work (e.g., post it to an institutional repository or publish it in a book), with an acknowledgment of its initial
publication in this series.
3. Authors are permitted and encouraged to post their work online (e.g., in institutional repositories or on their website) prior to and
during the submission process, as it can lead to productive exchanges, as well as earlier and greater citation of published work (See
Open access policy for details).
References
[1]. Levin H Y, Emerson J. Is There a Bias Against Education in the Jury Selection Process?[J].Social Science Electronic Publishing, 2006, 38(3).
[2]. Emerson, J.W. and Meredith, S., 2011. Nationalistic judging bias in the 2000 Olympic diving competition. Math Horizons, 18(3).DOI: 10.4169/194762111X12954578042812.
[3]. Null R C T R, Team R, Null R C T, et al. R: A language and environment for statistical computing[J]. Computing, 2011, 1:12-21. DOI:10.1890/0012-9658(2002)083[3097:CFHIWS] 2.0.CO;2.
[4]. Reider, B. J ury Selection[J]. The American Journal of Sports Medicine, 2006, 34(4):541-541.DOI:10.1177/0363546506287183.
[5]. Zitzewitz E. Nationalism in Winter Sports Judging and Its Lessons for Organizational Decision Making[J].Journal of Economics & Management Strategy, 2006, 15(1):67–99.DOI:10.1111/j.1530-9134.2006.00092.x.