


1. Introduction
During the past years, the energy of nuclear collisions has drastically increased as large colliders and laboratories are now experimenting with high-energy nuclear collisions. Large particle accelerators involved in such research include Relativistic Heavy-Ion Collider (RHIC, USA) and Large Hadron Collider (LHC, Switzerland). Experiments conducted at these two sites aim to use properties of high-energy nuclear collision to study the quark-gluon plasma (QGP) [1], which is believed to have played a crucial role during the Big Bang. For instance, lead nuclei collisions (with 5.46 TeV energy per collision) were picked as a major research subject by LHC to research QGP. RHIC also selected gold ions to collide to study the particle flow of QGP. Furthermore, to study the particle flow without the impact of magnetic field formation like that of gold ion collisions, RHIC used uranium ions to perform the collision. With uranium ions collision, physicists can separate “tip-to-tip” collisions from “body-to-body” ones [2].
Quark gluon plasma is produced at high-energy nuclear collision events when hadronic matters in the nuclei are sufficiently compressed that they turn into a state where quarks and gluons exist unbounded to the hadrons. The resultant QGP only exists for approximately \( {10^{-22}}s \) and will turn into other particles. To understand QGP, which was found by RHIC and LHC experimental data to be very close to an ideal fluid, different parameters of heavy-ion collisions must be studied extensively. As studied in Quantum Chromodynamics, heavy-ions collision yielded QGP displays extensive collective behaviors, and the collective anisotropic particle distribution is represented by the harmonic flow coefficient in (1) [3],
\( {V_{n}}={v_{n}}{e^{in{ψ_{n}}}} \) (1)
where \( {ψ_{n}} \) is the phases, and \( {v_{n}} \) is the flow magnitude. The elliptical flow, which is an observable variable, is represented as \( {v_{2}} \) . This characteristic of a collision has been a major research topic at RHIC through gold nuclear collisions and was found to be proportional to eccentricity, or \( {ε_{2}} \) , which will be introduced in the following paragraph.
Eccentricity ( \( {ε_{2}} \) ) is the geometric quantity describing the shape of two nuclei’s overlapping area in a collision. This particular variable controls the elliptic flow, \( {v_{2}} \) , in which momentum is built up imbalanced along the x and y axes. The elliptic flow is also what asymmetries of RHIC data are attributed to. The definition of eccentricity is given as formula (2) [4],
\( {ε_{2}}=\frac{\sqrt[]{{(σ_{x}^{2}-σ_{y}^{2})^{2}}+4{({σ_{xy}})^{2}}}}{σ_{x}^{2}+σ_{y}^{2}} \) (2)
where \( σ_{x}^{2}, σ_{y}^{2}, \) and \( {σ_{xy}} \) , are the participants’ (nucleons participated in the collision) distribution covariances along x and y axes [5]. Under the condition of \( {ε_{2}}≠0 \) , the nuclear collision’s pressure gradient forces would have an elliptical imbalance and are greater in x direction, which would then possess more momentum. This shows the direct relationship between \( {ε_{2}} \) and \( {v_{2}} \) , which can also be described as formula (3) [6],
\( {v_{2}}={κ_{2}}{ε_{2}} \) (3)
The fact that elliptical flow would in turn affect the hadrons’ azimuthal distribution \( \frac{dN}{dϕ} \) and cause QGP expansion [7] verifies its research value.
This paper mainly focuses on the impact of participant eccentricity on the geometry of the interaction in Pb + Pb collision events on the description of data from the experiments at the Large Hadron Collider at the CERN laboratory.
2. Method
The setup of the project is based on the Glauber Monte-Carlo Model [4, 8 - 9], which is used to approximate \( Npart \) (the number of collided nucleons) geometrically, using an impact parameter b (the distance between two nuclei, which is a random generated number) and \( {σ_{NN}} \) (total/inelastic nucleon-nucleon cross section).
The model assumes that the directions of the participants are just the opposite. The interactions between nucleon pairs are treated as separate and non-interfering events. It also ignores the electromagnetic force within nuclei since it is a high-energy collision. The proton and neutron are treated in the same way geometrically. \( {σ_{NN}} \) is 65mb is such a pb-pb collision model [10]. To ensure that every collided nucleon is touched by another collided nucleon in the other lead nucleus, formula (4) should be guaranteed.
\( D \lt \sqrt[]{\frac{{σ_{NN}}}{π}} \) (4)
So, each lead nuclei have 208 nucleons with a diameter of 1.42 fm according to result from (4)
The model was simulated with a Python program, where each nucleon was plotted as a sphere with of diameter D = 1.42fm, located at the position provided in the data file. The model also assumes that the lead nuclei are transparent, which means that nucleons might not interact or scatter with every collision as they pass through each other. Each pair of nucleons with the distance between them smaller than D is marked as collided. According to where each nucleon is from, each nucleon is marked with nucleus A and nucleus B. As an example, Figure 1 illustrates a Pb-Pb collision event in the data file, Each colored sphere is touched by at least one sphere with the other color.
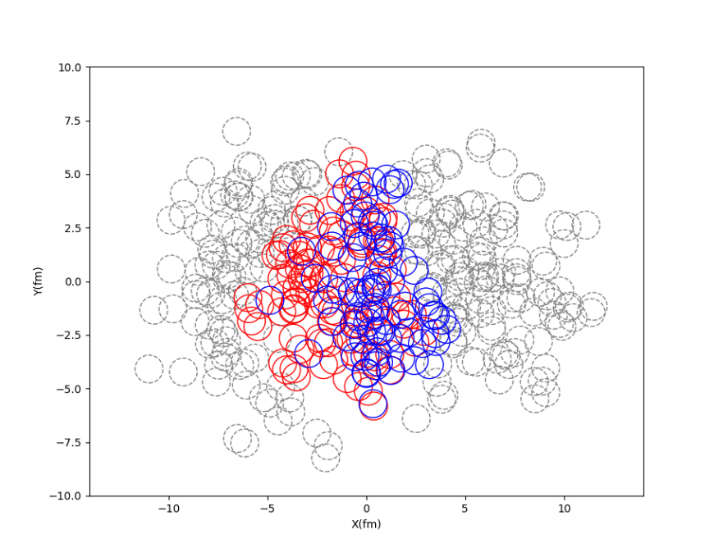
Figure 1. A collision of one Pb-Pb event in the 2D version, where the origin of the picture is at the middle of the center of nuclei. Nucleons that have no collision are grayed out. Red and blue orbs are collided nucleons from nucleus A and B.
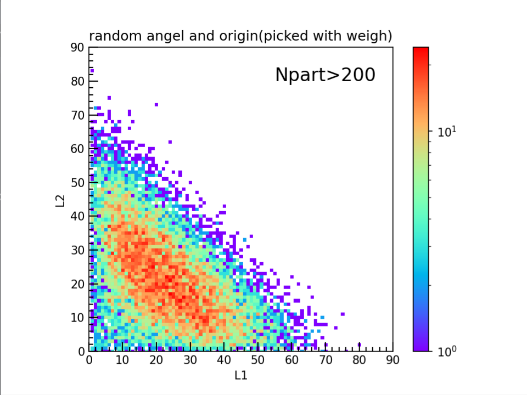
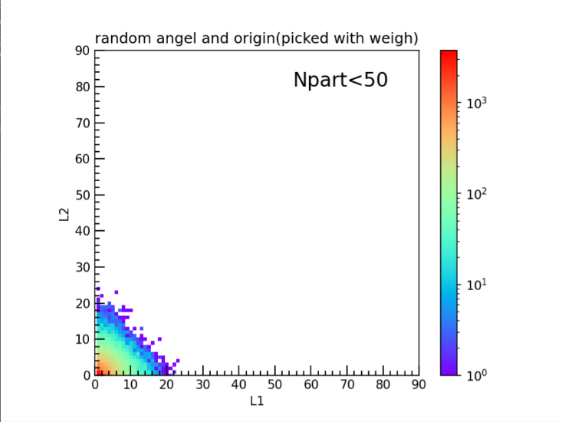
The interactions between nucleon pairs are treated as separate and non-interfering events. This means the outcome of one nucleon-nucleon collision doesn't influence the outcome of another, allowing for a simplified analysis of the collision process. Thus, the number of QGP in each event can be calculated by counting number of L1 and L2 (L1 and L2 are the number of collided nucleons in two opposite directions from the origin, where the origin was the position of a nucleon selected based on the weighted value of collision times). To discuss the pattern of L1 and L2 in different kind of collision events, data were chosen and separated into two groups according to the scale of \( Npart \) (<50 and >200 separately), Figure 2 use a 2D-histogram to show the data distribution within the two groups.
(a) (b)
Figure 2. The number of collided particles in the L1 and L2 direction calculated for two groups by applying the Glauber Monte-Carlo model. The color bar represents the frequency of data with L1L2 as the axis. (a) Data feature: \( Npart \) >200; (b) Data feature: \( Npart \) <50
The plots in Figure 2 shows the same results as Wang et al. found [11]. Which is a proof that there is nothing wrong with the data analysis and further steps could be conduct.
Considering that the collision shape could be like an ellipse or triangle, which means L1 and L2 could be relatively small if chosen in the direction of the minor axis of the elliptic. To rule out the interfering factor, \( L\_perp \) (the direction of L1 rotating \( 90° \) clockwise) and \( L\_perp2 \) (the direction of L1 rotating \( 90° \) anticlockwise) are also calculated. \( \lt L1 – L\_perp \gt \) and \( \lt L2 – L\_perp2 \gt \) are used to replace L1 and L2 to show the feature of the collision.
To avoid extreme data interference, the plot for exploration of the relation between \( {ε_{2}} \) and \( \lt L1 – L\_perp \gt \) will exclude data with \( Npart \) close to 0 and 416. Only events with \( 150 \lt Npart \lt 200 \) were counted in the program. Figure 3 shows the result in two kinds of plots. To show the impact of \( {ε_{2}} \) on the description of data more clearly, the influence of \( Npart \) is eliminated by the projection of data onto the y-axis.
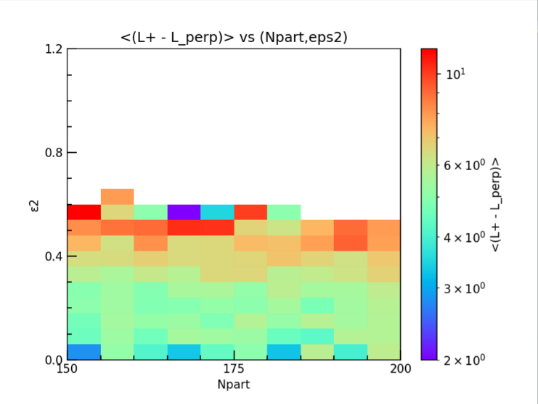
(a) (b)
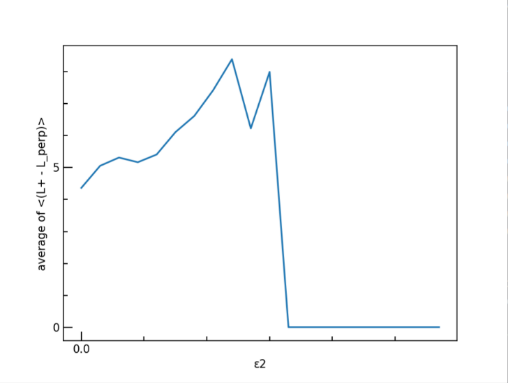
Figure 3. The 2D histograms showing the changing trend of \( \lt L2 – L\_perp2 \gt \) at different intervals of \( {ε_{2}} \) . (a) Sorted by different range of \( Npart \) and \( {ε_{2}} \) , the color bar on the right side represents the magnitude of \( \lt L2 – L\_perp2 \gt \) . (b) Y-axis is the projection of all \( \lt L2 – L\_perp2 \gt \) data onto \( {ε_{2}} \) .
3. Results and discussion
By studying the \( {ε_{2}} \) , with the sample data collected from nucleus collisions using programming analysis, we can sum up the collision geometry and behavior, which may help in finding the densest nucleus structure. The study was conducted based on data collected from experiments at the Large Hadron Collider (LHC) at CERN. However, all the current studies are not enough to find the particular correlation between parameters and the description of data. The results of our study will show the answer to the question. The histograms in Figure 3 are similar to the result from Wang et al.’s research [11], which also strengthens the credibility of the results.
Due to the definition of \( {ε_{2}} \) , the difference between L1 and L2 should increase as \( {ε_{2}} \) rises, there should be a significant correlation between participant eccentricity \( {ε_{2}} \) and the number of participant nucleons. There is supposed to be a relation between \( \lt L2 – L\_perp2 \gt \) and \( {ε_{2}} \) . Our analysis shows the effect of \( {ε_{2}} \) in Figure 3 (b). It can be seen from the plot that \( \lt L2 – L\_perp2 \gt \) has a positive correlation to \( {ε_{2}} \) , which agrees with our assumption. This gives a method for controlling the data from the experiment by restricting the range of \( {ε_{2}} \) . Delving into these parameters gives a deep observation of the change in the description of data. As the \( {ε_{2}} \) increases, the vigorous decrease of the average of \( \lt L2 – L\_perp2 \gt \) also makes sense, which shows there is no such type of data when the \( Npart \) number reaches such a height.
However, in Figure 3 (b), the average of \( \lt L2 – L\_perp2 \gt \) only increases from 5 to 9 as the \( {ε_{2}} \) changes, which is relatively small compared to theory. As shown in the figure, the sensible result should be an increase from 0 and should be a near-linear diagram. But in Figure 3 (b), as \( {ε_{2}} \) increases, the average of \( \lt L2 – L\_perp2 \gt \) even decreased vigorously to zero. This could be caused by the scale of the data file which is still not large enough. As a result, there are some bins in the plot with only a few data, especially those with extreme data.
4. Conclusion
This essay set out to discuss the role of the impact of participant eccentricity in Pb-Pb collision, which plays a decisive role in nuclear collision. To do this, Glauber Monte Carlo model was used to make the experimental data more concrete so research can be carried out further. Our data indicate that \( {ε_{2}} \) has a positive correlation with the description of data in general. Then it flattens out. It is a question of future research to continue to delve into the quantitative relationships between \( {ε_{2}} \) and participant nucleons. In future work, investigating the properties of \( {ε_{2}} \) might prove important. This study provides a feasible idea for an in-depth study of nuclear collision models.
Acknowledgment
We gratefully acknowledge Professor Gunther Roland for his instruction and precious help in this program.
References
[1]. Busza, W., Rajagopal, K. and Wilk, V.D.S, W. (2018) Heavy ion collisions: the big picture and the big questions. Annual Review of Nuclear and Particle Science, 68(1): 339–376. https://doi.org/10.1146/annurev-nucl-101917-020852.
[2]. Science, O.O. (2019) Shape matters in nuclear physics collisions. https://science.osti.gov/np/Highlights/2016/NP-2016-02-c.
[3]. Shen, C. (2021) Studying QGP with flow: A theory overview. https://doi.org/10.1016/j.nuclphysa.2020.121788.
[4]. Miller, M.L. et al. (2007) Glauber Modeling in High-Energy nuclear collisions. Annual Review of Nuclear and Particle Science, 57(1): 205–243. https://doi.org/10.1146/annurev.nucl.57.090506.123020.
[5]. Alver, B. et al. (2007) System size, energy, pseudorapidity, and centrality dependence of elliptic flow, Physical Review Letters, 98(24). https://doi.org/10.1103/physrevlett.98.242302
[6]. Dimri, A., Bhatta, S. and Jia, J. (2023) Impact of nuclear shape fluctuations in high-energy heavy ion collisions. The European Physical Journal A, 59(3). https://doi.org/10.1140/epja/s10050-023-00965-1.
[7]. Alver, B. and Roland, G. (2010) Collision-geometry Fluctuations and Triangular Flow in Heavy-ion Collisions. Physical Review, 81(5). https://doi.org/10.1103/physrevc.81.054905.
[8]. Giacalone, G., Jia, J. and Zhang, C. (2021) Impact of Nuclear Deformation on Relativistic Heavy-Ion Collisions: Assessing Consistency in Nuclear Physics across Energy Scales. Physical Review Letters, 127(24). https://doi.org/10.1103/physrevlett.127.242301.
[9]. Loizides, C., Nagle, J.L. and Steinberg, P. (2015) Improved version of the PHOBOS Glauber Monte Carlo. SoftwareX, 1–2: 13–18. https://doi.org/10.1016/j.softx.2015.05.001.
[10]. Caiati, A. (2018) Glauber Model Monte Carlo Simulation of Pb+Pb Collisions. https://london.ucdavis.edu/~reu/REU18/Papers/caiati.pdf
[11]. Wang, J. et al. (2020) Using the Optical Glauber Monte Carlo Model to Calculate RAA Related Results Produced by the ATLAS Collaboration. Natural Science, 12(03): 65–73. https://doi.org/10.4236/ns.2020.123010.
Cite this article
Liu,Y.;Liu,Y.;Liu,Z.;Ding,X. (2024). Exploring the effect of eccentricity on geometry nuclear collisions by Glauber Monte Carlo simulation. Theoretical and Natural Science,43,21-25.
Data availability
The datasets used and/or analyzed during the current study will be available from the authors upon reasonable request.
Disclaimer/Publisher's Note
The statements, opinions and data contained in all publications are solely those of the individual author(s) and contributor(s) and not of EWA Publishing and/or the editor(s). EWA Publishing and/or the editor(s) disclaim responsibility for any injury to people or property resulting from any ideas, methods, instructions or products referred to in the content.
About volume
Volume title: Proceedings of the 3rd International Conference on Computing Innovation and Applied Physics
© 2024 by the author(s). Licensee EWA Publishing, Oxford, UK. This article is an open access article distributed under the terms and
conditions of the Creative Commons Attribution (CC BY) license. Authors who
publish this series agree to the following terms:
1. Authors retain copyright and grant the series right of first publication with the work simultaneously licensed under a Creative Commons
Attribution License that allows others to share the work with an acknowledgment of the work's authorship and initial publication in this
series.
2. Authors are able to enter into separate, additional contractual arrangements for the non-exclusive distribution of the series's published
version of the work (e.g., post it to an institutional repository or publish it in a book), with an acknowledgment of its initial
publication in this series.
3. Authors are permitted and encouraged to post their work online (e.g., in institutional repositories or on their website) prior to and
during the submission process, as it can lead to productive exchanges, as well as earlier and greater citation of published work (See
Open access policy for details).
References
[1]. Busza, W., Rajagopal, K. and Wilk, V.D.S, W. (2018) Heavy ion collisions: the big picture and the big questions. Annual Review of Nuclear and Particle Science, 68(1): 339–376. https://doi.org/10.1146/annurev-nucl-101917-020852.
[2]. Science, O.O. (2019) Shape matters in nuclear physics collisions. https://science.osti.gov/np/Highlights/2016/NP-2016-02-c.
[3]. Shen, C. (2021) Studying QGP with flow: A theory overview. https://doi.org/10.1016/j.nuclphysa.2020.121788.
[4]. Miller, M.L. et al. (2007) Glauber Modeling in High-Energy nuclear collisions. Annual Review of Nuclear and Particle Science, 57(1): 205–243. https://doi.org/10.1146/annurev.nucl.57.090506.123020.
[5]. Alver, B. et al. (2007) System size, energy, pseudorapidity, and centrality dependence of elliptic flow, Physical Review Letters, 98(24). https://doi.org/10.1103/physrevlett.98.242302
[6]. Dimri, A., Bhatta, S. and Jia, J. (2023) Impact of nuclear shape fluctuations in high-energy heavy ion collisions. The European Physical Journal A, 59(3). https://doi.org/10.1140/epja/s10050-023-00965-1.
[7]. Alver, B. and Roland, G. (2010) Collision-geometry Fluctuations and Triangular Flow in Heavy-ion Collisions. Physical Review, 81(5). https://doi.org/10.1103/physrevc.81.054905.
[8]. Giacalone, G., Jia, J. and Zhang, C. (2021) Impact of Nuclear Deformation on Relativistic Heavy-Ion Collisions: Assessing Consistency in Nuclear Physics across Energy Scales. Physical Review Letters, 127(24). https://doi.org/10.1103/physrevlett.127.242301.
[9]. Loizides, C., Nagle, J.L. and Steinberg, P. (2015) Improved version of the PHOBOS Glauber Monte Carlo. SoftwareX, 1–2: 13–18. https://doi.org/10.1016/j.softx.2015.05.001.
[10]. Caiati, A. (2018) Glauber Model Monte Carlo Simulation of Pb+Pb Collisions. https://london.ucdavis.edu/~reu/REU18/Papers/caiati.pdf
[11]. Wang, J. et al. (2020) Using the Optical Glauber Monte Carlo Model to Calculate RAA Related Results Produced by the ATLAS Collaboration. Natural Science, 12(03): 65–73. https://doi.org/10.4236/ns.2020.123010.