


1.Introduction
From the seventeenth century, when the Dutch East India Company issued its first stock certificates, stocks have become an irreplaceable part of human socio-economic development and have even occupied an increasingly important position [1]. Before the introduction of computer science and modeling to the market, the unpredictability of the stock price forced people to make bold decisions based on experience and subjective judgments, which led to higher risks and probability of financial failure [2]. Thus, theories to justify the unpredictability of the stock price came into the mainstream. According to the “Efficient Market Hypothesis” (EMH), for example, price changes are unpredictable, and forecasting a financial market is a hopeless effort, which means that any attempt to predict the stock market is untenable under EMH [3].
However, as research progressed and criticism of EMH grew, the opinion that the stock market was, to some extent, predictable arose in the field, which led to the outset of method searching for the prediction of the stock market. Arévalo claims that this criticism has boosted the number of studies that try to question and replace EMH with other new and effective methods that consist of technical analysis indicators and chart patterns conducted by methodologies from econometrics, statistics, data mining, and AI [4]. With the advent and rapid development of computer science and mathematical modeling, and the extreme desire to grasp the certainty of the market, people constantly look for a variety of forecasting methods for the stock market, which gave birth to the application of the time series model in financial forecasting.
There are increasingly more studies analyzing the effectiveness and accuracy of the financial prediction of the ARIMA model [5-7], and it turns out that the model is highly accuracy in short-term prediction in many countries. Ariyo claims that ARIMA models are especially effective and robust in short-term financial time series forecasting [6]. However, the accuracy of the model in China, which has risen rapidly in recent years in various fields such as economy, politics, and military, and the total GPA of which is now ranked second in the world, seems not to be tested, even though there is no denying that China’s A-share market has been making a significantly positive effect on the country’s economic development ever since its establishment in 1990[8]. At the same time, the high complexity and large capacity of the market seem to challenge the model prediction. Therefore, in this paper, the ARIMA model is applied to financial prediction in China’s A-share market to examine its effectiveness and accuracy. Closing Prices of representative stocks are collected to test the model’s effectiveness, and the results will be discussed. This may act as a reference for investors to select their model in the financial prediction of China’s A-share market in a more rational way.
The main structure of the paper is as follows: the first section introduces the dataset, the second section describes the paper’s methodology, the third section examines the experimental results, and finally, the conclusion and discussion will be presented.
2.Datasets
As Table 1 shows, 3 stock closing prices from 3 different sectors of China’s A-share market have been collected. The time span of the data is 24 months from August 11, 2021, to August 11, 2023, which has been divided into two parts: data of the first 23 months will be as training data for model fitting and data in the remaining month will be set as testing data to examine the accuracy of the model prediction. All data is collected in the database of Wind Information Co., Ltd (wind.com.cn).
Table 1. Information of Data for Model Implementation.
|
Sectors |
Stock Name |
Market Values (Unit: billion/CNY) |
|
Food and beverage |
Kweichow Moutai Co., Ltd |
2,303.866 |
|
Electric power equipment manufacturing |
Contemporary Amperex Technology Co. Limited |
1,061.704 |
|
Nonferrous metals |
Zijin Mining Group Co., Ltd. |
323.653 |
3.Methodology
3.1.Model Identification, Parameter Selection and Model Forecasting
3.1.1.Model Identification. The ARIMA (Autoregressive Integrated Moving Average; Box-Jenkins model) model is a statistical model commonly used in time series forecasting, which is based on historical time series data and builds a mathematical model for forecasting by analyzing the characteristics of the data such as trends, seasonality, and stochasticity. In the ARIMA model, the future value of a variable is a linear combination of past values and past errors. The equation is presented as Eq.(1).
\( ∆{X_{t}}=c+{α_{1}}∆{X_{t-1}}+…+{α_{p}}∆{X_{t-p}}+{ε_{t}}-{θ_{1}}{ε_{t-1}}-…-{θ_{q}}{ε_{t-q}} \ \ \ (1) \)
where\( {X_{t}} \)is the actual value and\( {ε_{t}} \)is the random error at t,\( {α_{i}} \)and\( {θ_{j}} \)are the coefficients, p, and q are integers that are often referred to as autoregressive and moving average, respectively and\( ∆ \)refers to the integration order of data.
What has to be noticed is that the ARIMA model consists of three parts: the Auto Regression (AR) part, the moving average (MA) part, and the difference (I) part.
Auto Regression (AR) part: Shown as Eq.(2), an AR model describes the relationship between current and historical values, using the variable’s historical time data to predict itself. In other words, a given time series data are regressed on their own lagged values, and the lag order is represented by the “p” values in the model. The AR(p) model is the primary form of the time series model. However, its vague explanation of the error term has a significantly negative effect on the model’s accuracy.
\( {X_{t}}=c+{α_{1}}∆{X_{t-1}}+{α_{2}}∆{X_{t-2}}…+{α_{p}}∆{X_{t-p}}+{ε_{t}} \ \ \ (2) \)
Moving Average (MA) component: Shown as Eq.(3) this component is set to more precisely explain the model’s error. The moving average nature of the model is represented by the “q” value, which is the order of lagged values of the error term.
\( {X_{t}}={ε_{t}}-{θ_{1}}{ε_{t-1}}-…-{θ_{q}}{ε_{t-q}} \ \ \ (3) \)
Additionally, The ARMA (p, q) model is also applied to forecasting, but it performs with higher accuracy when processing data without stability.
\( {X_{t}}=c+{α_{1}}{X_{t-1}}+…+{α_{p}}{X_{t-p}}+{ε_{t}}-{θ_{1}}{ε_{t-1}}-…-{θ_{q}}{ε_{t-q}} \ \ \ (4) \)
Difference (I-for integrated) Part: This involves differencing the time series data to remove trends and convert non-stationary time series to stationary ones. This is represented by the value of “d” in the model. If d = 1, look at the difference between the two time series entries. If d = 2, look at the difference of the difference obtained at d = 1, and so on.
By determining the orders (p, d, q) of the AR, MA, and I, an ARIMA model can be built and used to predict stock prices.
3.1.2.Parameter Selection. Initially, the appropriate ARIMA model with proper parameters (p, d, q) should be identified for particular data, and the Akaike Information Criteria (AIC), which is a widely used measure for model identification, will be used in this paper for parameter selection of p and q. Under AIC, the model with the lowest AIC value will be considered the most appropriate.
Additionally, both AIC and BIC (Bayesian Information Criterion) can be used for AIRMA model identification. However, Yang claims that AIC is under the presumption that the true model is not in the candidate set, which is usually tenable. In contrast, BIC is the opposite, which leads to the case that AIC is asymptotically optimal in parameter selection while BIC is not [9]. Therefore, AIC is mainly used in the paper and BIC is set as a reference.
The utilization of AICc (Corrected Akaike Information Criterion) is motivated by its ability to address the challenges posed by small sample sizes, providing a refined balance between model fit and complexity [10]. Particularly in our study, where the available time series data is characterized by a limited sample size (around 400), AICc offers a more robust approach than the traditional AIC in mitigating the risk of selecting overly complex models. By leveraging AICc, we can identify time series models that are more adept at capturing the underlying data patterns in situations with limited data points.
As the Box-Jenkins method suggested, the value p and q should be less than 2 or the total number of the two parameters should be less than 3[11]. Therefore, only p and q values 2 or less are examined, and the model with the least AICc value is selected.
Python is used for all the experiments.
3.1.3.Model Checking. The residual (difference between the predicted values and the actual values) of the model could reflect the suitability. If the model is suitable, the residual will not follow any pattern but randomly distributed [6]. Therefore, the PACF (Partial AutoCorrelation Function) and ACF (AutoCorrelation Function) of the residual will be visualized. If there are no significant spikes of PACF and ACF, which means that there are no significant correlations within the residuals series which means that they are not in certain growth pattern, the residuals can be considered as white noise, and there is no need for further examination of another AR(p) and MA(q).
3.1.4.Model Forecasting. Closing prices of ten stocks in the A-share market will be taken into implementation. The closing prices of the following month (24 days) will be forecasted. All implementation is done through Python.
3.2.Accuracy Measurement
Three methods are mainly used in this paper for accuracy measurement.
3.2.1.Error-free Growth Point. The point in the forecast stock price where the error is less than 3% will be referred to as the error-free growth point (EFP). The number of EFP will be an indicator for accuracy measurement. The error rate is calculated in the equation Where\( \hat{y} \)refers to the predicted price and\( y \)refers to the actual price.
\( rate of error=\frac{|\hat{y}-y|}{y} \ \ \ (5) \)
3.2.2.Visualization of Data with Accepted Error. Visualization of each model with predicted prices and testing data (actual prices) with and accepted error of 3% in ratio will be evaluated. Considering the common fluctuations of stock prices in the financial market, the very first number of days where the predicted prices are not out of the accepted error will be set as a significant indicator for accuracy evaluation.
3.2.3.MAE Method for Accuracy. Mean Absolute Error (MAE) is used to compute the accuracy in percentage. Accuracies of predicted prices of 1 to 24 days will all be examined using vector calculation as below:
Firstly, error\( {ER_{24×1}} \)will be calculated by vector subtraction as Eq.(6):
\( {ER_{24×1}}=abs({\hat{Y}_{24×1}}-{Y_{24×1}}) \ \ \ (6) \)
Where\( {\hat{Y}_{24×1}} \)refers to the vector containing all predicted prices of a model in. column, so as.\( {Y_{24×1}} \)for actual prices.
Then the\( MAE \)of 1-24 days will be calculated in the Eq.(7) , using the method of cumulative sum.
\( MAE=\bar{ C}, where \bar{{c_{i}}}=\frac{1}{i}\sum _{j=1}^{i}{err_{j}} for {err_{j}} in {ER_{24×1}} \ \ \ (7) \)
Vector\( acc \)which contains accuracies of predicted prices in the time span from 1 to 24 days is then be calculated as Eq.(8):
\( acc=I-\frac{MAE}{\dot{Y}} where \dot{{y_{i}}}=\frac{1}{i}\sum _{j=1}^{i}{y_{j}} for {y_{j}} in {Y_{24×1}} \ \ \ (8) \)
\( acc \)will then be visualized for evaluation.
4.Experimental Results
4.1.Kweichow Moutai Co., Ltd
4.1.1.Model for Kweichow Moutai Co., Ltd. In figure 1, the ARIMA (0,2,1) shows the lowest AICc of 6366.42 and relatively low BIC of 6373.63. Therefore, the model is selected. After model fitting, the model shows the coefficient of its component ma (1) as -0.9986, with a standard error of 0.0312. figure 2 is the visualization of the ACF and PACF of the residuals of the models, which shows the no significant spikes of both, which means that the residuals are not in a certain growth pattern, and the residuals can be considered as white noise. Therefore, there is no need for further examination of another AR(p) and MA(q).
What has to be noticed is that the PACF and ACF of residuals show a relatively high value of -0.04 in several lags initially. However, the stock price of Kweichow Moutai Co., Ltd. is in a significantly high multitude of ten thousand, rather than ten or hundreds of that in the other 2 stocks, which leads to a more reasonable interpretation that the PACF and ACF of residuals are randomly distributed in the scale of -0.04 to 0.04, rather than there are significant spikes in these two values.
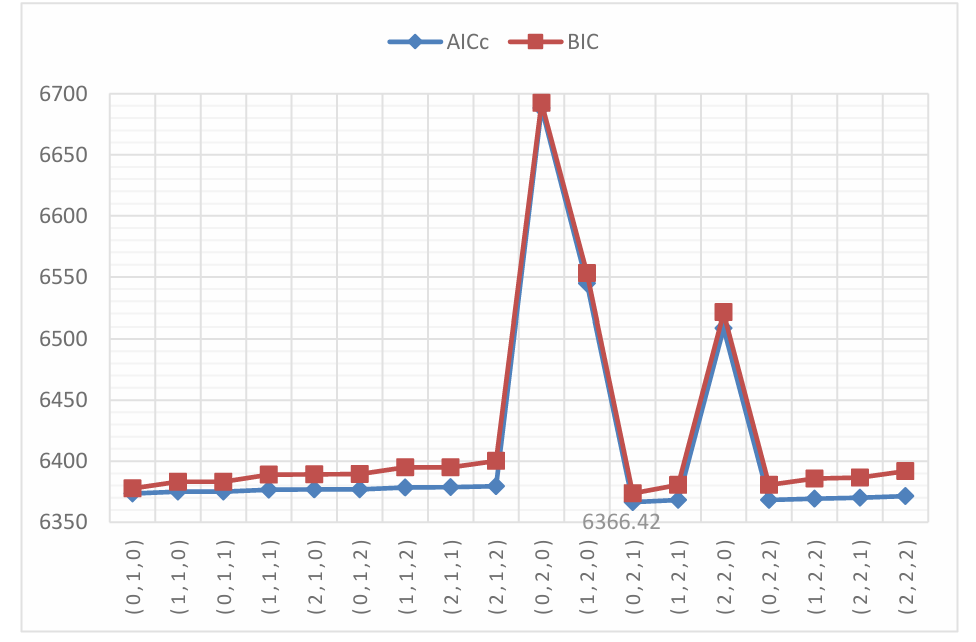
Figure 1. Visualization of AICc and BIC.
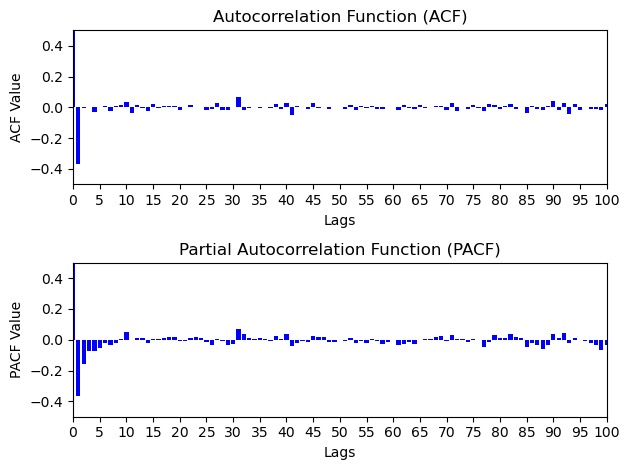
Figure 2. PACF and ACF of residuals of ARIMA (0,2,1).
4.1.2.Prediction of Model for Kweichow Moutai Co., Ltd. As Figure 3 demonstrates, the first eight points all fall within the error rate area of the scale of 0.03, which means that the first eight days of the overall prediction are within 0.03 of each other out of the 24 days of the overall prediction. On the other hand, Figure 4 shows the accuracy calculated by MAE within 24 days, which shows a decreasing trend when time accumulates. Predicted prices for the following 24 days are presented in Figure 5. It can be seen that in the prediction of Kweichow Moutai Co., Ltd., the actual price is always greater than the predicted value. As shown in Figure 5, the red area represents the range of acceptable error, and the first eight points fall inside the red area, that is, the predicted price for the first 8 days is relatively close to the real price, and after that the predicted price will become relatively untrustworthy. As Nikkei Asia mentioned, Kweichow Moutai is a Chinese state-owned producer of baijiu, which is actually a high level of alcohol brewed from grain ingredients, and is often given as a luxury gift to others in China. However, its overall consumption is declining because of the current voluntary ban on extravagant banquets in the wake of President Xi Jinping’s anti-graft campaign[11].Since the data used for the forecast is less than one month old, and long-term forecasts are subject to a large number of confounding factors it cannot be used to determine that Kweichow Moutai Co., Ltd share price will always be in a growth phase, even as a result of the above events the stock price will be in decline in the long term. But the point that can’t be ignored is that the model is significantly accurate in predicting short-term stock [12].
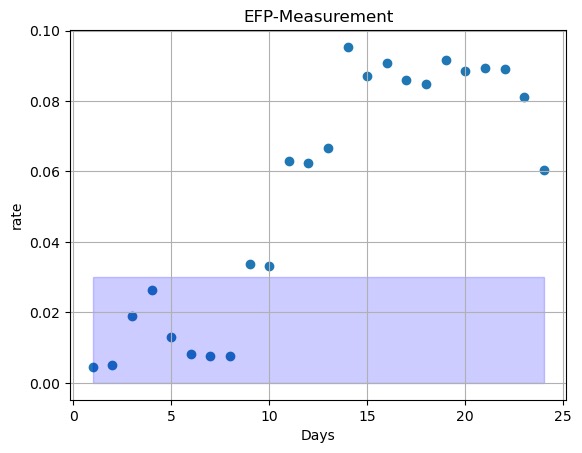
Figure 3. Visualization of Error Rate.
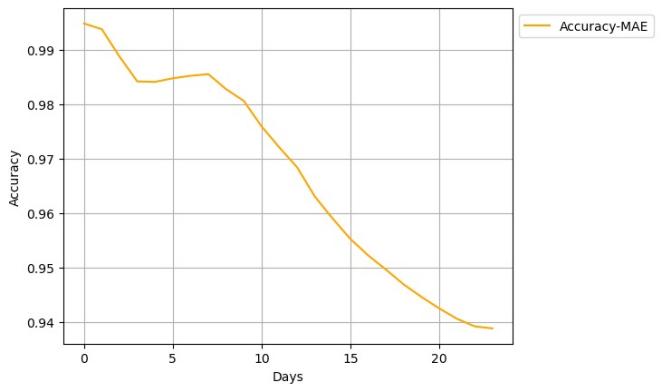
Figure 4. Visualization of Accuracy in Different Time Spans.
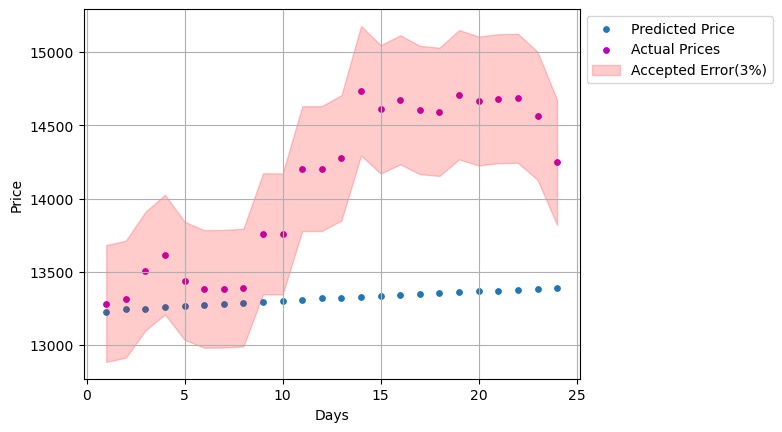
Figure 5. Visualization of Actual and Predicted Prices with Accepted Error.
4.2.Contemporary Amperex Technology Co., Ltd
4.2.1.Model for Contemporary Amperex Technology Co., Ltd. In Figure 6, the ARIMA(0,2,1) model exhibits the most favorable AICc value of 3712.79 and a comparatively modest BIC score. Hence, this model is opted for selection. Post the fitting of the model, its components’ coefficients are as follows: ar1 (-0.996), ar2 ( -0.966),ma1(1.049), and ma2 (1.000). The standard errors are 0.014, 0.014, 0.114, and 0.215, respectively. Furthermore, depicted in Figure 7 are the visual representations of the ACF and PACF plots pertaining to the residuals of these models. These plots reveal the absence of significant spikes in both, implying an absence of discernible growth patterns within the residuals. Consequently, the residuals can be characterized as exhibiting white noise behavior. Consequently, there exists no necessity to conduct further analyses for additional AR(p) and MA(q) terms.
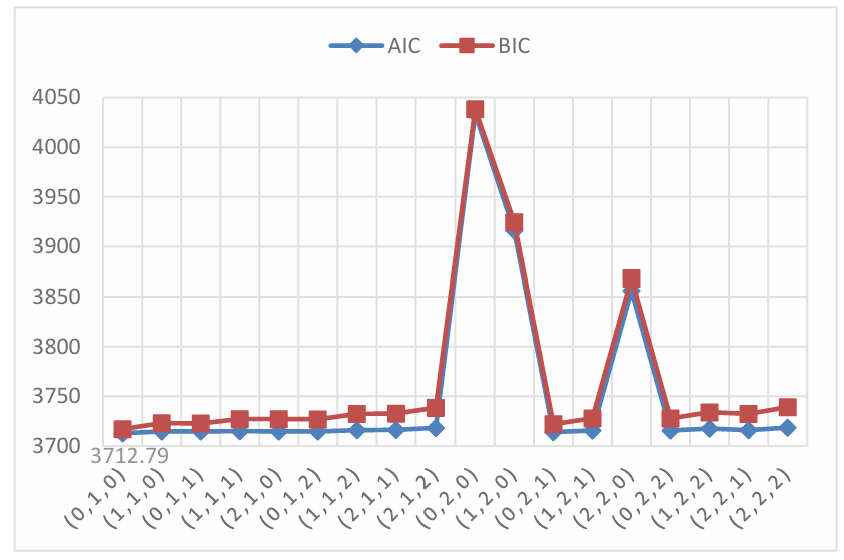
Figure 6. Visualization of AICc and BIC.
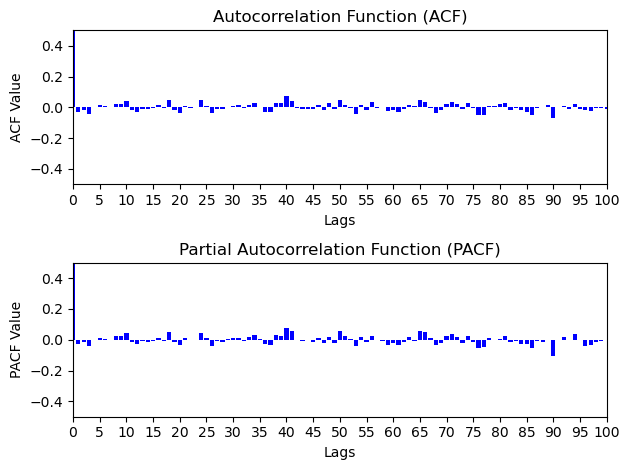
Figure 7. PACF and ACF of residuals of ARIMA (0,1,0).
4.2.2.Prediction of Model for Contemporary Amperex Technology Co., Ltd. As shown in Figure 8, there are 10 EFPs within the 0.03 accuracy area of the model prediction. Figure 9 shows the accuracy calculated by MAE, although there are some volatilities mentioned above, the figure still shows a decreasing trend when time accumulates in general.
Finally, as Figure 10 shows, the first 6 predicted prices in blue are inside the scale of accepted area in red, meaning that the predicted price is quite close to the actual price for the first 6 days, and after that, despite the fact that there are 4 days in which the two prices are equally close, we can only consider the first 6 days as having short-term predictive accuracy, and the subsequent 4 days that fall in the blue area as contingent on stock price volatility, since the stock market is susceptible to unexpected events like the news ,which leads to unpredictable volatility in stock prices[13].
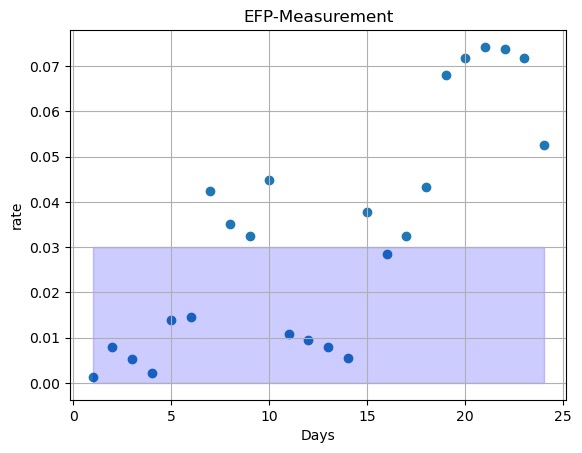
Figure 8. Visualization of Error Rate.
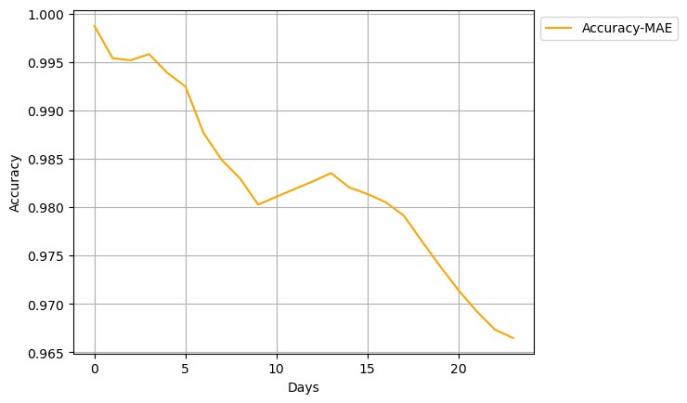
Figure 9. Visualization of Accuracy in Different Time Spans.
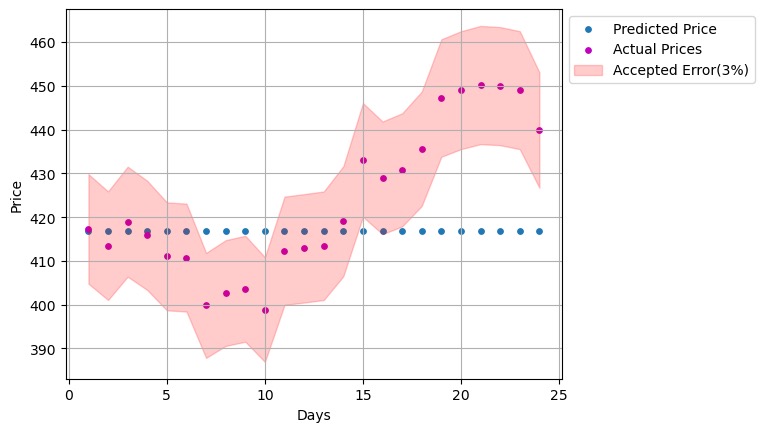
Figure 10. Visualization of Actual and Predicted Prices with Accepted Error.
4.3.Zijin Mining Group Co., Ltd
4.3.1.Model for Zijin Mining Group Co., Ltd. Incorporating the findings from Figure 12, it becomes apparent that the ARIMA(2,1,2) configuration emerges with the lowest AICc of 684.17 and relatively low BIC value. Consequently, this particular model is opted for prediction. Notably, the analysis of Figure 12 unveils the absence of noteworthy spikes within the residual PACF and ACF, implying a lack of discernible growth patterns in these correlations. This signifies that the residuals can be classified as white noise, thereby obviating the necessity for additional scrutiny into alternative AR(p) and MA(q) models (see Figure 11).
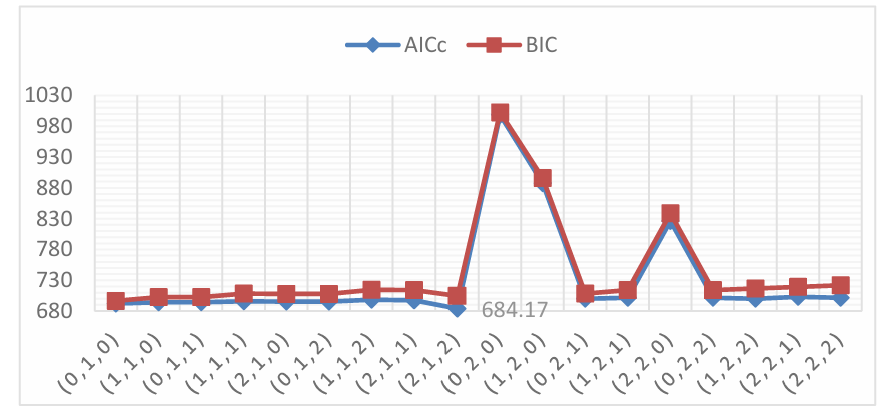
Figure 11. Visualization of AICc and BIC.
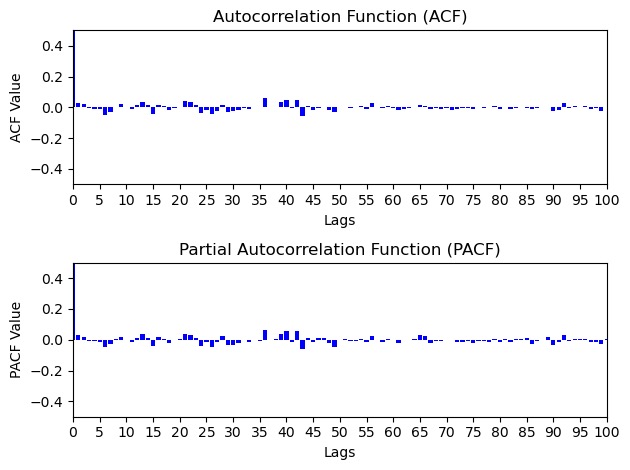
Figure 12. PACF and ACF of residuals of ARIMA (2,1,2).
4.3.2.Prediction of Model for Zijin Mining Group Co., Ltd. As shown in Figure 13, there are only 2 EFPs in the model prediction. Figure 14 shows the accuracy calculated by MAE, and shows a clear decreasing trend when time accumulates. Predicted prices for the following 24 days are presented in Figure 15. Only two of the blue dots are within the red zone, and they are also some distance away from the corresponding red dots, which indicates that the prediction of the future stock price is only accurate on 2 days, while the remaining 22 days have a relatively large difference, exceeding the set acceptable error zone. Notice that both the new crown epidemic and geopolitical conflicts exacerbated the risks of trading mining stocks, leading to volatility in share prices [14]. Therefore, it can be concluded that even for short-term forecasts, as the mining industry is likely to be subject to more disruptive factors and is likely to be somewhat cyclical, the ARIMA model is still slightly less accurate for mining than for other industries.
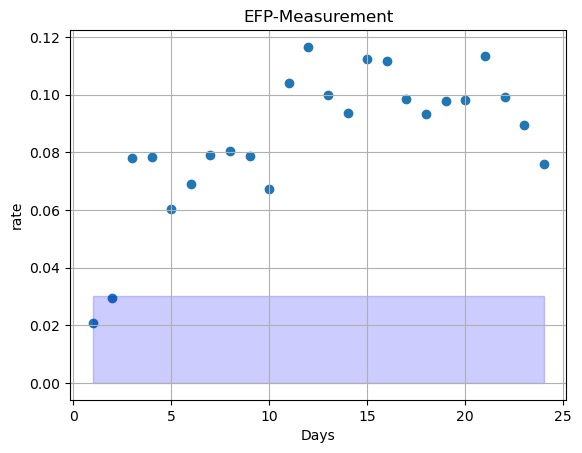
Figure 13. Visualization of Error Rate.
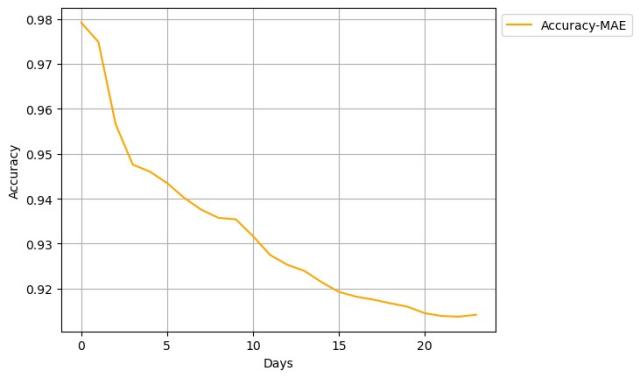
Figure 14. Visualization of Accuracy in Different Time Spans.
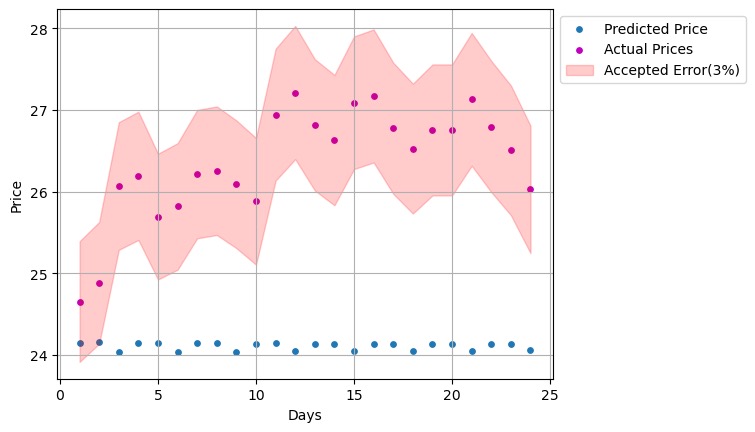
Figure 15. Visualization of Actual and Predicted Prices with Accepted Error.
5.Conclusion
In this paper, the ARIMA model and its non-negligible role in stock forecasting are initially introduced, and the importance of effective forecasting of Chinese A-shares is emphasized. After that, three typical stocks from China A-share are analyzed by the ARIMA model, which are divided into the first 23 months for model training and the data of the following 24 days as the test data for model prediction. In the next section, the parameter selection in the ARIMA model is demonstrated and the accuracy of the model for each stock is tested.
The ARIMA model, which is a more accurate model for short-term forecasting, is within the accepted area of error and ignores the volatility of the stock price for 8, 6, and 2 days, respectively, of the 24-day stock price forecasts for the three representative stocks. It is difficult to predict long-term stock prices with the ARIMA model in the A-share market, which requires further improvement of the model or using other prediction methods. Additionally, the accuracy may be calculated in different system or equation in the financial field, thus what is shown in the paper are acting more as a reference for the trends of accuracy changing, rather the demonstration for the exact values representing the accuracy for model applications in the financial field. In further research, the ARIMA model should be tested by testing the accuracy of prediction for more representative stocks in the A-share market or adjusting the timing of prediction.
The Zijin Mining Group Co., Ltd. predicted price is closer to the actual price only for the initial two days, and the predicted price for these two days is at the edge of the 0.03 area we set. It can be seen that even for predicting short-term stock prices, the ARIMA model still has limitations for stocks in different industries. Therefore, studying the ARIMA model for predicting stock prices in different fields in the A-share market, with adequate and typical data that could reflect common financial features in the field, is also a direction that can be explored in the future. In addition, another condition that cannot be ignored is that the stocks we selected this time are relatively well-known enterprises in the industry. A potential research direction is to examine the effectiveness of the ARIMA model for the price prediction of small and medium-sized stocks, considering that small and mid-sized stocks may have greater volatility in the short term.
References
[1]. Masoud, N. M. H. (2013). The Impact of Stock Market Performance upon Economic Growth. International Journal of Economics and Financial Issues, 3(4), 788-798. https://dergipark.org.tr/en/pub/ijefi/issue/31960/351956?publisher=http-www-cag-edu-tr-ilhan-ozturkstock
[2]. Agrawal, J., et al. (2013). State-of-The-Art in Stock Prediction Techniques. International Journal of Advanced Research in Electrical, Electronics and Instrumentation Engineering, 2, 2278-8875. https://citeseerx.ist.psu.edu/document?repid=rep1&type=pdf&doi=8bbc6b03515a9f7de2464897f0bc10a7cd0b8347
[3]. Shah, D., et al. (2019). Stock Market Analysis: A Review and Taxonomy of Prediction Techniques. International Journal of Financial Studies, 7(2), 26. https://doi.org/10.3390/ijfs7020026
[4]. Arévalo, R., et al. (2017). A Dynamic Trading Rule Based on Filtered Flag Pattern Recognition for. Stock Market Price Forecasting. Expert Systems with Applications, 81, 177-192. https://doi.org/10.1016/j.eswa.2017.03.028
[5]. Prapanna, L., et al. (2014). Study of Effectiveness of Time Series Modeling (ARIMA) in. Forecasting Stock Prices. International Journal of Computer Science, Engineering and Applications (IJCSEA), 4(2). https://doi.org/10.5121/ijcsea.2014.4202
[6]. Ariyo, A. A., Adewumi, A. O., & Ayo, C. K. (2014). Stock price prediction using the. ARIMA model. In 2014 UKSim-AMSS 16th International Conference on Computer Modeling and Simulation (pp. 106-112). IEEE.
[7]. Abonazel, M. R., & Abd-Elftah, A. I. (2019). Forecasting Egyptian GDP Using ARIMA Models. Reports on Economics and Finance, Vol. 5, no. 1, 35-47. HIKARI Ltd. Retrieved from www.m-hikari.com. https://doi.org/10.12988/ref.2019.81023
[8]. Segal, T. (2021). China A-Shares: Definition, History, vs. B-Shares. Investopedia. https://www.investopedia.com/terms/a/a-shares.asp
[9]. Yang, Yuhong. (2005). Can the strengths of AIC and BIC be shared? A conflict between model. identification and regression estimation. Biometrika, 92(4), 937-950.
[10]. Hurvich, C. M., & Tsai, C. L. (1989). Regression and time series model selection in small samples. Biometrika, 76(2), 297-307.
[11]. L-Stern Group Ly Pham (2013). Time Series Analysis with ARIMA-ARCH/GARCH in R.
[12]. Kweichow Moutai Co., Ltd. (2023). Nikkei Asia. https://asia.nikkei.com/Companies/Kweichow-Moutai-Co.-Ltd
[13]. Chinese battery manufacturer reveals new LFP battery-Xinhua. (2023). English.news.cn. http://english.news.cn/20230816/951e8432cec64042b9161d0df9f5a318/c.html
[14]. Zhu, M., Zhang, H., Xing, W., Zhou, X., Wang, L., & Sun, H. (2023). Research on price. transmission in Chinese mining stock market: Based on industry. Resources Policy, 83, 103727. https://doi.org/10.1016/j.resourpol.2023.103727
Cite this article
Liang,K.;Wu,H.;Zhao,Y. (2024). Study of effectiveness of the ARIMA method in forecasting stock process in China. Theoretical and Natural Science,43,33-44.
Data availability
The datasets used and/or analyzed during the current study will be available from the authors upon reasonable request.
Disclaimer/Publisher's Note
The statements, opinions and data contained in all publications are solely those of the individual author(s) and contributor(s) and not of EWA Publishing and/or the editor(s). EWA Publishing and/or the editor(s) disclaim responsibility for any injury to people or property resulting from any ideas, methods, instructions or products referred to in the content.
About volume
Volume title: Proceedings of the 3rd International Conference on Computing Innovation and Applied Physics
© 2024 by the author(s). Licensee EWA Publishing, Oxford, UK. This article is an open access article distributed under the terms and
conditions of the Creative Commons Attribution (CC BY) license. Authors who
publish this series agree to the following terms:
1. Authors retain copyright and grant the series right of first publication with the work simultaneously licensed under a Creative Commons
Attribution License that allows others to share the work with an acknowledgment of the work's authorship and initial publication in this
series.
2. Authors are able to enter into separate, additional contractual arrangements for the non-exclusive distribution of the series's published
version of the work (e.g., post it to an institutional repository or publish it in a book), with an acknowledgment of its initial
publication in this series.
3. Authors are permitted and encouraged to post their work online (e.g., in institutional repositories or on their website) prior to and
during the submission process, as it can lead to productive exchanges, as well as earlier and greater citation of published work (See
Open access policy for details).
References
[1]. Masoud, N. M. H. (2013). The Impact of Stock Market Performance upon Economic Growth. International Journal of Economics and Financial Issues, 3(4), 788-798. https://dergipark.org.tr/en/pub/ijefi/issue/31960/351956?publisher=http-www-cag-edu-tr-ilhan-ozturkstock
[2]. Agrawal, J., et al. (2013). State-of-The-Art in Stock Prediction Techniques. International Journal of Advanced Research in Electrical, Electronics and Instrumentation Engineering, 2, 2278-8875. https://citeseerx.ist.psu.edu/document?repid=rep1&type=pdf&doi=8bbc6b03515a9f7de2464897f0bc10a7cd0b8347
[3]. Shah, D., et al. (2019). Stock Market Analysis: A Review and Taxonomy of Prediction Techniques. International Journal of Financial Studies, 7(2), 26. https://doi.org/10.3390/ijfs7020026
[4]. Arévalo, R., et al. (2017). A Dynamic Trading Rule Based on Filtered Flag Pattern Recognition for. Stock Market Price Forecasting. Expert Systems with Applications, 81, 177-192. https://doi.org/10.1016/j.eswa.2017.03.028
[5]. Prapanna, L., et al. (2014). Study of Effectiveness of Time Series Modeling (ARIMA) in. Forecasting Stock Prices. International Journal of Computer Science, Engineering and Applications (IJCSEA), 4(2). https://doi.org/10.5121/ijcsea.2014.4202
[6]. Ariyo, A. A., Adewumi, A. O., & Ayo, C. K. (2014). Stock price prediction using the. ARIMA model. In 2014 UKSim-AMSS 16th International Conference on Computer Modeling and Simulation (pp. 106-112). IEEE.
[7]. Abonazel, M. R., & Abd-Elftah, A. I. (2019). Forecasting Egyptian GDP Using ARIMA Models. Reports on Economics and Finance, Vol. 5, no. 1, 35-47. HIKARI Ltd. Retrieved from www.m-hikari.com. https://doi.org/10.12988/ref.2019.81023
[8]. Segal, T. (2021). China A-Shares: Definition, History, vs. B-Shares. Investopedia. https://www.investopedia.com/terms/a/a-shares.asp
[9]. Yang, Yuhong. (2005). Can the strengths of AIC and BIC be shared? A conflict between model. identification and regression estimation. Biometrika, 92(4), 937-950.
[10]. Hurvich, C. M., & Tsai, C. L. (1989). Regression and time series model selection in small samples. Biometrika, 76(2), 297-307.
[11]. L-Stern Group Ly Pham (2013). Time Series Analysis with ARIMA-ARCH/GARCH in R.
[12]. Kweichow Moutai Co., Ltd. (2023). Nikkei Asia. https://asia.nikkei.com/Companies/Kweichow-Moutai-Co.-Ltd
[13]. Chinese battery manufacturer reveals new LFP battery-Xinhua. (2023). English.news.cn. http://english.news.cn/20230816/951e8432cec64042b9161d0df9f5a318/c.html
[14]. Zhu, M., Zhang, H., Xing, W., Zhou, X., Wang, L., & Sun, H. (2023). Research on price. transmission in Chinese mining stock market: Based on industry. Resources Policy, 83, 103727. https://doi.org/10.1016/j.resourpol.2023.103727