


1. Introduction
With the development of the economy, people’s living standards have been improving gradually, and their happiness index has been increasing continuously. To facilitate travel, cars have become an essential part of people’s daily lives [1]. However, high purchase costs for new cars and rapid depreciation have always troubled consumers. Consequently, more and more consumers are turning to the second-hand car market, seeking more cost-effective car buying options. In the United States, for example, second-hand cars are traded at roughly three times the rate of new cars [2]. Against this backdrop, the trading volume of the second-hand car market is gradually increasing, and the importance of predicting second-hand car prices is becoming increasingly prominent.
The volatility of the second-hand car market brings significant uncertainty to both sellers and buyers, with various factors influencing second-hand car prices to varying degrees. Wang researched the different degree effects of vehicle age, power, mileage, model and other factors on the price [3]. In reality, buyers might fear purchasing vehicles with low value at high prices, while sellers worry that their vehicles may not fetch reasonable prices [4]. This uncertainty not only affects the market’s trading efficiency but also constrains its healthy development. Therefore, establishing a scientific price prediction model for second-hand cars is crucial in reducing market uncertainty and enhancing trading efficiency.
Research on old car price prediction can enhance market efficiency and promote its healthy development [5]. By predicting second-hand car prices, consumers and car dealers can grasp market dynamics more accurately, thus making more rational decisions. Moreover, second-hand car prediction is conducive to stabilize market prices, prevent excessive price fluctuations, and maintains a level playing field in the market. Finally, predicting second-hand car prices is beneficial to avoid negotiations and disputes caused by unreasonable prices between consumers and car dealers. This reduces transaction costs and improves the overall efficiency of the market.
There are multiple methods and models to predict the price of second-hand cars. This paper tries to put the influencing factors of second-hand car prices under the test of objective data. Linear regression is a classical method in statistics. With the advent of the era of big data, machine learning algorithms have been studied and applied by more people. Zhu used several machine learning models and neural network models to predict the price of second-hand cars [6]. Zheng and others analyzed and compared the multiple linear regression model and the neural network model [7]. Zhu and Zheng concluded that neural network predictions have more accurate results for respective research problems. Jia built a model based on the Light Gradient Boosting Machine (GMB) algorithm and analyzed and compared it with other algorithms in machine learning to get the advantages of Light GMB [8]. Chetna and other researches compared the random forest algorithm with the e Xtreme gradient boosting algorithm through the integration technique. Finally, it is concluded that the e Xtreme boost algorithm is better [9]. Chen and his companions studied the different advantages of random forest and linear regression models in different situations, and random forest is better for dealing with complex models [10]. This paper mainly uses the linear regression method and random forest model to solve this problem and test the model effect. Preprocessing the data and performing descriptive statistics. This article will explore the relationship between second-hand price and vehicle condition. Because there are categorical variables in the independent, this article chooses to use dummy variable regression. In addition, this paper will also study random forest models to comprehensively analysis to solve this regression problem.
2. Methodology
2.1. Data source and description
The data for this article comes from the Kaggle website and has been updated by Milan Vaddoriya. There are a total of 5513 samples, 8 influencing factors and 1 dependent variable--car price.
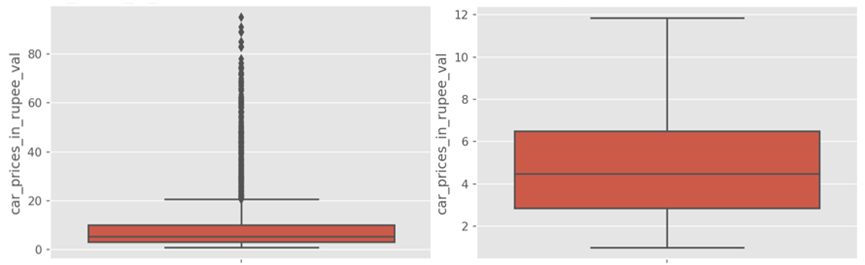
Figure 1. Car price in rupee (Lakh) before and after removing outliers
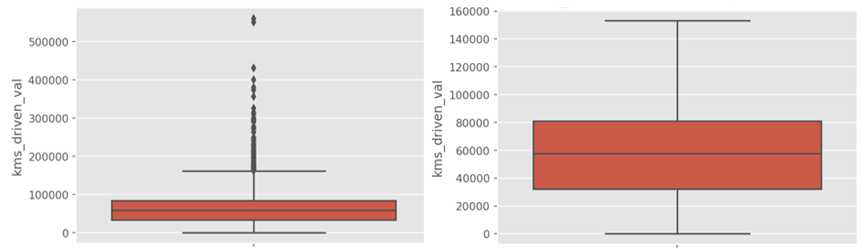
Figure 2. Kilometers driven before and after removing outliers
It can be seen from the box plot (Figure 1, 2) that there are too large values in the car price and kilometers traveled in the data, which not be conducive to the accuracy of the model. Therefore, these outliers are deleted. Now there are 4032 samples.
2.2. Index selection and description
Independent variables include fuel type, transmission type, ownership, seats, kilometers driven, manufacture year, engine capacity and car name. Ownership means the number of transfers, and the number of seats represents the size of the car. According to the objective phenomenon, the second-hand car brand is positively correlated with the price. In other words, the better the brand, the higher the price. However, car brands are used as categorical data, which cannot be assigned a specific value. Therefore, this variable will not be analyzed and further discussed for the following models.
To make the data better for modeling, it is necessary to analyze the data further. There are categorical variables and numeric variables in the influencing factors of second-hand car prices (Table 1). Although the year of manufacturing and the number of transfers is usually treated as discrete variables, to describe the effect of their changes on dependent variables, they are quantified as continuous variables and applied in mathematical methods. The significance of this is to describe their trends, not their numbers themselves.
Table 1. Variable description.
variable | symbol | type | range |
car prices in rupee | \( {x_{1}} \) | numeric | 1-11.85 |
kms driven | \( {x_{2}} \) | numeric | 900-153367 |
cc _engine | \( {x_{3}} \) | numeric | 0-5461 |
car name | \( {x_{4}} \) | - | - |
fuel type | \( {x_{5}} \) | category | 1=diesel, 2=petrol, 3=electric, 4=CNG, 5=LPG |
ownership | \( {x_{6}} \) | numeric | 1-5 |
seats | \( {x_{7}} \) | category | 2,4,5,6,7,8 |
manufacture | \( {x_{8}} \) | numeric | 1995-2022 |
transmission | \( {x_{9}} \) | category | 1=automatic 2=manual |
2.3. Method introduction
2.3.1. Multiple linear regression
Because there are categorical variables (transmission type, fuel type, seats) in the independent variables, the multiple linear regression analysis cannot be carried out directly. Therefore, it is necessary to use dummy variables and then carry out general linear regression. Dummy variables are created using petrol, automatic and ownership=5 as reference groups.
\( {y_{i}}={β_{0}}+{β_{1}}{x_{1}}+{β_{2}}{x_{2}}+…+{β_{i}}{x_{i}}+{ε_{i}}\ \ \ (1) \)
2.3.2. Random forest
Random forest is an integrated learning algorithm based on decision trees, which can be used to solve regression problems. Random forest has good accuracy and stability. In the study of the factors affecting the price of second-hand cars, 90% of the data is used as a training set, and 10% is used as a test. Data normalization is used to train the data, and parameters are adjusted to find the optimal model.
3. Results and discussion
3.1. Descriptive statistics
There are five fuel types, mainly diesel and petrol, which far outnumber the other three. The number of second-hand petrol cars is almost 2500, and the number for diesel is about 1500. The number of second-hand cars of CNG, electric and LPG types is less than 100 (Figure 3).
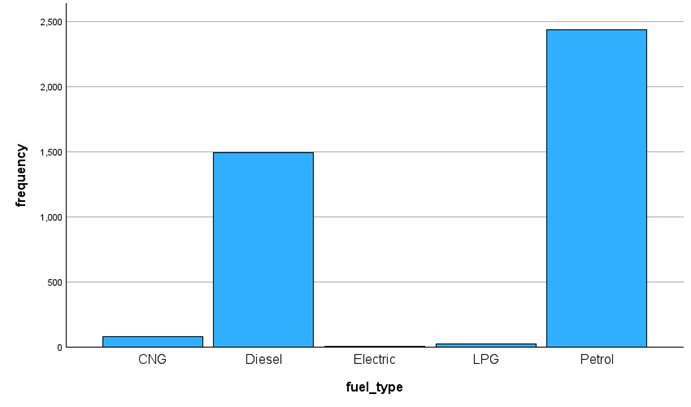
Figure 3. Bar Plot of Fuel Types
It can be seen that most of the cars in this data set are manual transmission cars. There are about seven times as many manual cars as automatic cars. The number of manual cars is about 3500, and the number of automatic cars is about 500 (Figure 4).
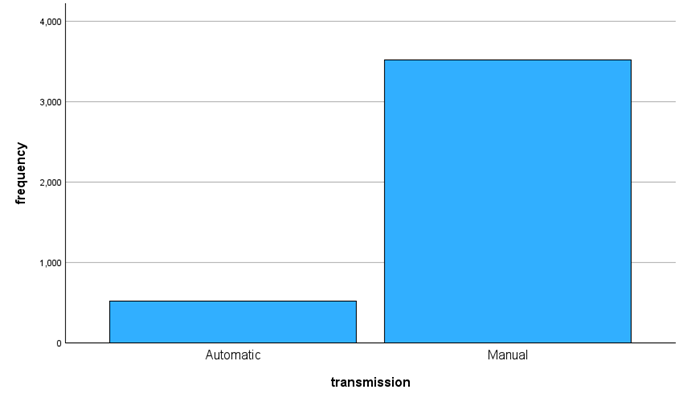
Figure 4. Bar Plot of Transmission Type
The manufacturing years of the cars in the data are mainly concentrated between 2010 and 2020. The most cars were produced in 2017, with nearly 500. Few cars were produced in the years before 2009, less than 100 cars a year (Figure 5).
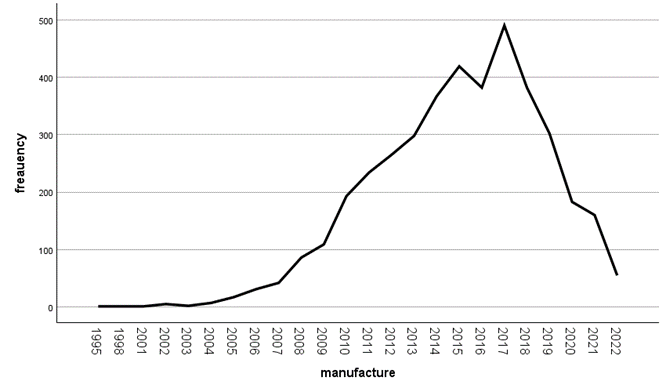
Figure 5. Line Plot of Car Counts by Manufacture Year
As can be seen from the figure, fuel type has a certain impact on second-hand car prices. The average price of second-hand cars of diesel type is the highest, and that of LPG is the lowest (Figure 6).
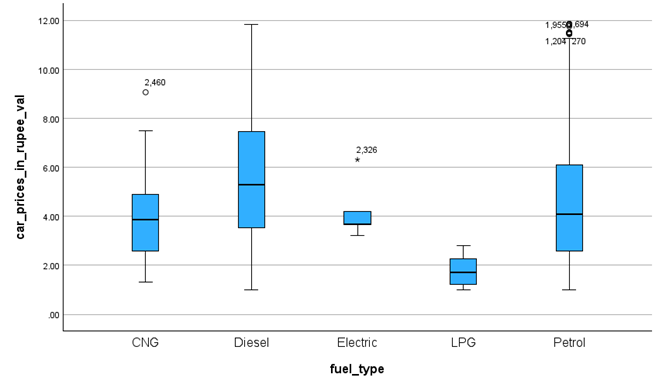
Figure 6. Box Plot of Fuel Type
The price of second-hand cars with automatic transmission is generally higher than manual transmission second-hand cars. The average price of a second-hand car with an automatic transmission is about 3 Lakh more expensive than a manual transmission (Figure 7).
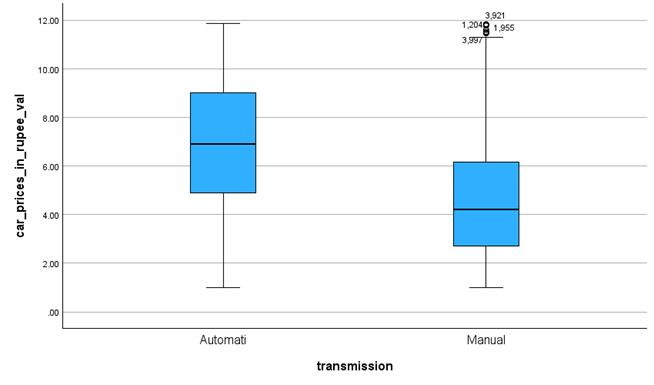
Figure 7. Box Plot of Transmission Type
The number of transfers is negatively correlated with the mean value of the car price. Within three transfers, the price decreases significantly with the increase in the number of transfers (Figure 8).
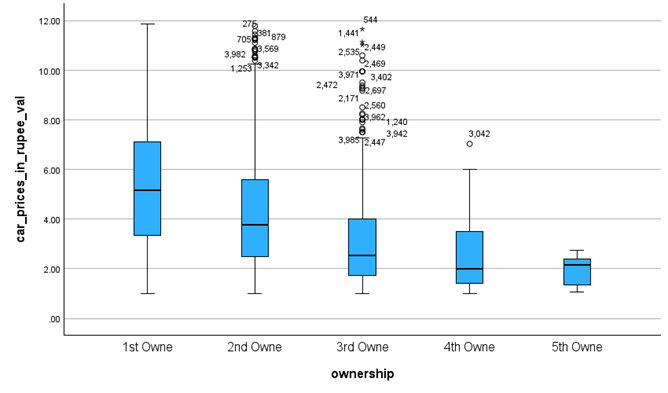
Figure 8. Box Plot of Ownership
There are 85.66% of second-hand cars are five-seater, accounting for the largest proportion. Followed by seven seats, and the proportion of other seats is seldom. The smallest number is the two-seater, with only four cars (Figure 9).
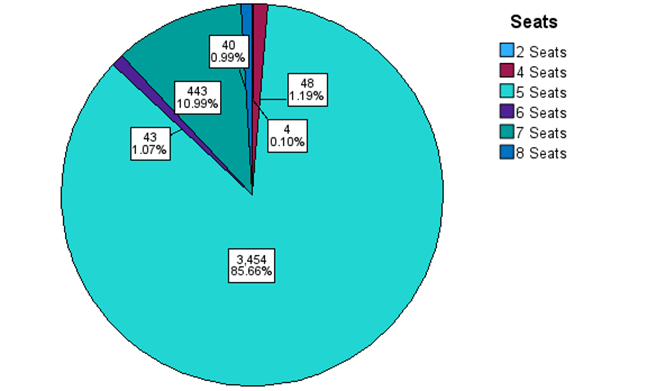
Figure 9. Pie Chart of Seats
3.2. Correlation analysis
This can be seen from Figure 10, the car price is positively correlated with the year of manufacture and is not significantly positively correlated with engine displacement and number of seats, negatively correlated with the number of kilometers driven and ownership. The number of kilometers traveled is positively correlated with the year of production and the number of transfers. There is a negative correlation between the year of production and the number of transfers. In addition, there is no obvious linear correlation between the other variables.
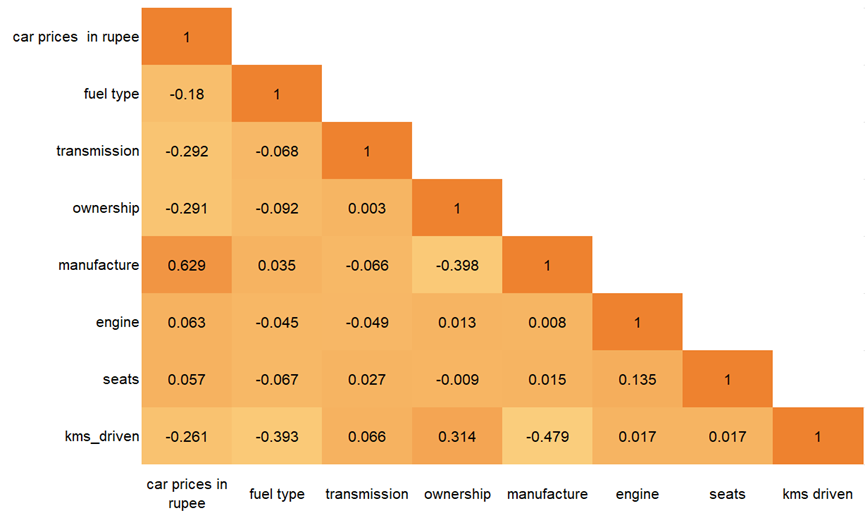
Figure 10. Pearson correlation
3.3. Multiple linear regression model results
From Table 2, note that VIF is much less than 5, and there is no multicollinearity between the independent variables. The model can be carried out accurately, and the parameter estimation is more reliable and accurate. As can be seen from Table 3, kms driven, transmission, fuel type, manufacture, and ownership have a significant impact on the dependent variable second-hand car price.
Table 2. Linear Model Coefficient
model | Unstandardized coef, | standardized | significance | VIF | |
B | SE | Beta | |||
(constant) | -801.804 | 18.604 | <0.001 | ||
kms driven | -4.498E-6 | 0.000 | -0.058 | <0.001 | 1.63 |
transmission= manual | -2.041 | 0.084 | -0.265 | <0.001 | 1.027 |
fuel type=CNG | -0.692 | 0.201 | -0.038 | <0.001 | 1.03 |
fuel type=Diesel | 1.467 | 0.064 | 0.275 | <0.001 | 1.266 |
fuel type=Electric | -3.637 | 0.789 | -0.05 | <0.001 | 1.013 |
fuel type=LPG | -0.452 | 0.386 | -0.013 | 0.242 | 1.013 |
seats=2 seats | -0.758 | 0.877 | -0.009 | 0.388 | 1.001 |
seats=4 seats | -0.601 | 0.256 | -0.025 | 0.019 | 1.011 |
seats=6 seats | -0.246 | 0.269 | -0.01 | 0.361 | 1.006 |
seats=7 seats | 0.253 | 0.09 | 0.031 | 0.005 | 1.032 |
seats=8 seats | 0.078 | 0.28 | 0.003 | 0.779 | 1.008 |
manufacture | 0.401 | 0.009 | 0.571 | <0.001 | 1.493 |
engine | 0.000 | 0.000 | 0.028 | 0.01 | 1.04 |
ownership | -0.258 | 0.043 | -0.071 | <0.001 | 1.223 |
The prediction value of second-hand:
\( car({x_{1}})=-801.804-(4.498E-6){x_{2}}-…+2.041transmission2manual+ε\ \ \ (2) \)
However, there are some non-significant variables here that require further simplification of the model. A new linear regression model is obtained without considering the effect of seat number on price (Table 3).
Table 3. Simplified model parameters
model | Unstandardized coefficient | standardized | significance | |
B | SE | Beta | ||
(constant) | -803.901 | 18.613 | <0.001 | |
kms driven | -4.493E-6 | 0.000 | -0.058 | <0.001 |
transmission= manual | -2.040 | 0.084 | -0.265 | <0.001 |
fuel type=CNG | -0.682 | 0.201 | -0.037 | <0.001 |
fuel type=Diesel | 1.467 | 0.064 | 0.275 | <0.001 |
fuel type=Electric | -3.598 | 0.790 | -0.49 | <0.001 |
fuel type=LPG | -0.452 | 0.386 | -0.013 | 0.242 |
manufacture | 0.402 | 0.009 | 0.572 | <0.001 |
engine | 0.000 | 0.000 | 0.030 | 0.005 |
ownership | -0.258 | 0.043 | -0.072 | <0.001 |
The regression equation after the simplified model is:
\( car({x_{1}})=-803.901-(4.493E-6){x_{2}}-2.040transmission2manual-…+ε\ \ \ (3) \)
Table 4. Model summary
R | R square | adjusted R2 | SE | DW | |
0.732 a | 0.536 | 0.535 | 1.75450 | 1.784 | |
\( SE=\sqrt[]{\frac{SSE}{n-k-1}}=1.7545\ \ \ (4) \)
The smaller the SE, the better the representation of the regression line to each observation point (Table 4). R2 measures the degree of fitting of the model to the data.
\( {R^{2}}=\frac{SSR}{SST}\ \ \ (5) \)
The closer the model is to 1, the better the fitting effect is. \( {R^{2}} \) is equal to 0.536. Avoid overfitting the adjusted value \( R_{a}^{2}=0.535 \) . The model has a certain interpretability, but it does not have a high degree of fit.
3.4. Random forest model results
Of these factors, the most influential is manufacture year (58.79%), followed by kilometers driven (10.63%), the type of fuel and the transmission type, and the engine displacement, and finally the number of transfers and the number of seats (Table 5, 6).
Table 5. Characteristic weight value
variable | weighted value |
manufacture | 0.588 |
kms driven | 0.106 |
fuel type diesel | 0.092 |
transmission manual | 0.090 |
engine | 0.068 |
transmission automatic | 0.029 |
ownership | 0.015 |
seats | 0.007 |
fuel type petrol | 0.003 |
Fuel type CNG | 0.001 |
fuel type LPG | 0.000 |
fuel type electric | 0.000 |
Table 6. Model evaluation
index | training set | test set |
R-squared | 0.701 | 0.602 |
MAE | 1.059 | 1.182 |
MSE | 1.983 | 2.595 |
RMSE | 1.408 | 1.611 |
MAD | 0.807 | 0.894 |
MAPE | 9.382 | 1.135 |
EVS | 0.701 | 0.602 |
MSLE | 0.055 | 0.067 |
For test set,
\( SSE=MSE*n=2.595*4032=10463.04\ \ \ (6) \)
The sum of squares of error between the predicted value and the observed value is 10463.04. \( {R^{2}}=0.602 \) . This means that the independent variables can explain 60.2% dependent variables.
3.5. Discussion
In the multiple linear regression model, \( SSE=13080.80. \) SSE is directly related to the model quality, the smaller its value, the higher the model fitting accuracy. The SSE in the multiple linear regression model is 1.19 times that of the test data in the random forest model. And the R-square in the random forest is greater than the R-square value in the linear regression model. The random forest model has a better fitting effect and accuracy than the regression model.
4. Conclusion
Compared with the multiple linear regression model, the random forest model can better predict second-hand car prices, the fitting effect of this model is better, and the error is relatively small. Among these factors, the year of production of a car has the greatest impact on the price of second-hand cars. For multiple linear regression models, some independent variables may not have linear effects on dependent variables, or the linear relationship between them is not obvious. These independent variables may include but are not limited to fuel type, and transmission type. This situation may lead to increased errors, which is a limitation of a linear regression model. Due to the excessive complexity of car names, this variable is not introduced into the model, and other factors not mentioned in the data affect second-hand car prices, which also leads to a decrease in the accuracy of the fit. The number of car accidents, car color and geographical location factors have a certain impact on the price of second-hand cars. If more factors are taken into account, the model will work better. This can be seen in the model results, the year of production is an important factor in the price of a second-hand car, while the number of seats and most fuel types have little effect on the price.
References
[1]. Alhakamy A A, et al. 2023 Are used cars more sustainable? Price prediction based on linear regression. Sustainability, 15(2), 911.
[2]. Gavazza A, Lizzeri A and Roketskiy N 2014 A quantitative analysis of the used-car market. American Economic Review, 104(11), 3668-3700.
[3]. Wang J 2019 Master of second-hand car valuation model based on random forest algorithm. Beijing Jiaotong University.
[4]. Gajera P, Gondaliya A and Kavathiya J 2021 Old car price prediction with machine learning. Int. Res. J. Mod. Eng. Technol. Sci, 3, 284-290.
[5]. Andrews T and Benzing C 2007 The determinants of price in internet auctions of used cars. Atlantic Economic Journal, 35, 43-57.
[6]. Zhu X 2023 Master’s degree in price prediction of used cars based on deep learning. Shandong Normal University.
[7]. Zheng A, Li B and Guo C 2023 Predictive analysis of used car transaction price based on linear regression and neural network model. Intelligent Computer and Applications, 9, 103-110.
[8]. Jia P 2021 Master of second-hand car price prediction based on LightGBM. Shandong Normal University.
[9]. Longani C, Prasad Potharaju S and Deore S 2021 Price prediction for pre-owned cars using ensemble machine learning techniques. In Recent Trends in Intensive Computing, 178-187.
[10]. Chen C, Hao L and Xu C 2017 Comparative analysis of used car price evaluation models. In AIP Conference Proceedings.
Cite this article
Gao,J. (2024). Second-hand car price prediction based on multiple linear regression and random forest. Theoretical and Natural Science,52,31-40.
Data availability
The datasets used and/or analyzed during the current study will be available from the authors upon reasonable request.
Disclaimer/Publisher's Note
The statements, opinions and data contained in all publications are solely those of the individual author(s) and contributor(s) and not of EWA Publishing and/or the editor(s). EWA Publishing and/or the editor(s) disclaim responsibility for any injury to people or property resulting from any ideas, methods, instructions or products referred to in the content.
About volume
Volume title: Proceedings of CONF-MPCS 2024 Workshop: Quantum Machine Learning: Bridging Quantum Physics and Computational Simulations
© 2024 by the author(s). Licensee EWA Publishing, Oxford, UK. This article is an open access article distributed under the terms and
conditions of the Creative Commons Attribution (CC BY) license. Authors who
publish this series agree to the following terms:
1. Authors retain copyright and grant the series right of first publication with the work simultaneously licensed under a Creative Commons
Attribution License that allows others to share the work with an acknowledgment of the work's authorship and initial publication in this
series.
2. Authors are able to enter into separate, additional contractual arrangements for the non-exclusive distribution of the series's published
version of the work (e.g., post it to an institutional repository or publish it in a book), with an acknowledgment of its initial
publication in this series.
3. Authors are permitted and encouraged to post their work online (e.g., in institutional repositories or on their website) prior to and
during the submission process, as it can lead to productive exchanges, as well as earlier and greater citation of published work (See
Open access policy for details).
References
[1]. Alhakamy A A, et al. 2023 Are used cars more sustainable? Price prediction based on linear regression. Sustainability, 15(2), 911.
[2]. Gavazza A, Lizzeri A and Roketskiy N 2014 A quantitative analysis of the used-car market. American Economic Review, 104(11), 3668-3700.
[3]. Wang J 2019 Master of second-hand car valuation model based on random forest algorithm. Beijing Jiaotong University.
[4]. Gajera P, Gondaliya A and Kavathiya J 2021 Old car price prediction with machine learning. Int. Res. J. Mod. Eng. Technol. Sci, 3, 284-290.
[5]. Andrews T and Benzing C 2007 The determinants of price in internet auctions of used cars. Atlantic Economic Journal, 35, 43-57.
[6]. Zhu X 2023 Master’s degree in price prediction of used cars based on deep learning. Shandong Normal University.
[7]. Zheng A, Li B and Guo C 2023 Predictive analysis of used car transaction price based on linear regression and neural network model. Intelligent Computer and Applications, 9, 103-110.
[8]. Jia P 2021 Master of second-hand car price prediction based on LightGBM. Shandong Normal University.
[9]. Longani C, Prasad Potharaju S and Deore S 2021 Price prediction for pre-owned cars using ensemble machine learning techniques. In Recent Trends in Intensive Computing, 178-187.
[10]. Chen C, Hao L and Xu C 2017 Comparative analysis of used car price evaluation models. In AIP Conference Proceedings.