1. Introduction
Gold as a special non-ferrous metal, both commodity properties and monetary properties, its good ductility, stable chemical properties determine it to become the most suitable for human commodity society as a currency commodity. At the same time, gold also has a good investment, the value of the storage function [1]. Gold tends to follow inflation, so when inflation is very high, the price of gold will also be high. At the same time, when inflation falls, the price of gold will fall. When the price of gold rises, investors will be more willing to invest in gold than in stocks [2]. Gold has been one of the most sought-after commodities for nearly a century and continues to hold a place in asset allocation. In March this year, the price of gold repeated record highs, has a very high potential for growth, the international price of gold has exceeded 2200 USD/ounce. This news has caused a high degree of concern of investors in the market.
With the development of the global economy and the increasing complexity of financial markets, the gold futures market has gradually become the focus of investors’ attention. According to the World Gold Council, total positions in the global gold futures market reached more than $100 billion by the end of 2021, and trading volume in the global gold futures market grew by about 50% from 2010 to 2021. The status of gold futures market is increasing and gradually becoming a financial investment market as important as stock market, futures market, bond market and so on [3].
China has always been a major producer and consumer of gold, and in recent years China’s economy is growing rapidly, China’s investment demand for gold is increasing. Therefore, China has continuously strengthened the establishment and improvement of the gold market. The People’s Bank of China in April 2001 announced the lifting of the “unified purchase and distribution”. And then, the Shanghai gold exchange in October 2002 formally opened, mainly engaged in spot on-site gold trading, on the establishment of the gold hallmarks of China’s entry into the era of market-oriented reform of the gold management system [4].
As an investment tool, the price of gold has stabilized and is always on an upward trend. When the financial market systemic risk, gold will become a hedge tool. 2008 after the financial crisis, the world economy is in the doldrums, but the price of gold is still strong, and since then the investment value of gold by a wide range of concerns. 2020 public health events superimposed on geopolitical conflicts, the financial markets of various countries have caused a serious impact on the many times triggered by the meltdown of the global stock market, the financial market turmoil, during the period of the price of gold has risen against the trend, and the hedge value has been revealed [5]. Therefore, accurately predicting the future direction of the price of gold can effectively avoid certain market risks, help investors to fully understand the market situation, but also can promote the development of the futures market.
Price forecasts for gold futures and the factors that influence the price of gold have been quite controversial in academia. Tully and Lucey investigated the relationship between the price of gold and the price of the USD using the Asymmetric Power generalized autoregressive conditional heteroscedasticity (APGARCH) model and found that the USD is an influential factor in the price of gold futures [6]. Zeng et al. provided a very accurate prediction of gold price based on an improved model of BP neural network with projection seeking optimization [7]. Singh et al. suggested an innovative periodic extreme learning machine for forecasting gold price data. It was found that there are now important links between the various factors [8]. Rapach et al. found that fusion models can fully utilize information from multiple variables and reduce volatility substantially [9].
Therefore, accurately predicting the future direction of the price of gold can effectively avoid certain market risks, help investors to fully understand the market situation, but also can promote the development of the futures market. In addition, gold futures are inextricably linked to the spot, and the price of gold futures is of great significance to the country’s macroeconomy [10].
In summary, predicting the price of gold is of great importance. For gold futures price data, the use of machine learning methods for prediction works well, so this paper decides to use the ARIMA model to predict the settlement price of gold futures.
2. Methodology
2.1. Date source
The study used data form the website Kaggle website. This data set provides a comprehensive record of daily gold prices from January 1, 2020, to January 22, 2024. The data included key financial metrics for each trading day (Table 1).
Table 1. Descriptive statistics
Indicator | mean | standard error | standard deviation | Variance |
Close | 1498.726 | 5.9634 | 298.8248 | 89296.267 |
Volume | 185970.7 | 1947.735 | 97600.769 | 9525910184 |
Open | 1498.726 | 5.9692 | 299.1182 | 89471.69 |
High | 1508.451 | 6.012 | 301.2622 | 90758.94 |
Low | 1488.87 | 5.9154 | 296.4177 | 87863.455 |
As the settlement price of gold futures has the characteristics of non-linear and unstable fluctuation, and is closely related to many indicators, this paper refers to the research results of related scholars, based on which five variables are selected as the influencing factors of the settlement price of gold futures. It includes the closing price, turnover, opening price, maximum price and minimum price. These indicators are the most used basic indicators in futures price forecasting studies (Table 1).
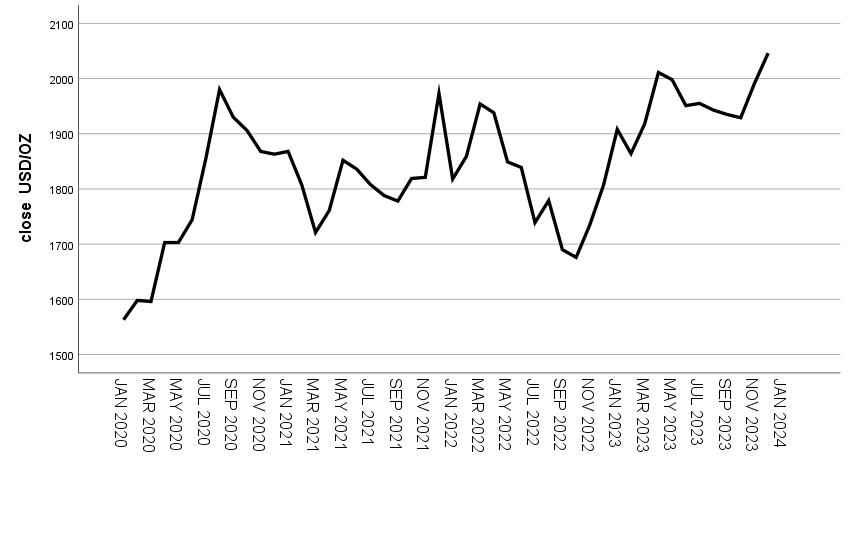
Figure 1. Monthly gold settlement price chart for the period 2020-2024
To see the changes more intuitively, the raw time series plot was chosen to be the average of the settlement price of each month from 2020 to 2024. As can be seen in Figure 1 between 2020 and 2024 the settlement price of gold futures is more volatile, with an overall range of $1,484 to $2,073 per ounce. However, there are two time periods with significant price increases and significantly higher price volatility: one in early 2020 and one in 2022. Since 2020, the global economy has faced multiple challenges. The rapid spread of the new Crown Pneumonia epidemic around the world resulted in a severe shock to the global economy. Governments have adopted restrictive measures that have led to lower corporate earnings, supply chain disruptions and poor logistics and transportation. Trade frictions between the United States and countries such as China and the European Union have also exacerbated uncertainty and turmoil in the global economy. And gold, as a relatively stable and safe asset, has naturally become the first choice of investors. Therefore, the deterioration of the global economic situation is an important factor driving up the price of gold.
2.2. Method introduction
Time series model is a statistical model used to analyze and forecast data over time. These data may be trending, seasonal or cyclical, so time series modeling can help people understand the structure of the data and make forecasts.
One of them is Autoregressive Integral Sliding Average (ARIMA) Model which is a classical time series analysis method for forecasting future time series data. ARIMA model is based on the autocorrelation and trendiness of the time series and models the intrinsic structure of the data through the three components of Autoregression (AR), Integration (I) and Moving Average (MA).
The modeling process of the ARIMA model requires the selection of appropriate values of p, d and q, where p is the order of the AR term, d is the number of differences which is required to make the time series stationery and q is the order of the MA term. These values are determined by looking at the autocorrelation (ACF) and partial autocorrelation (PACF) plots. Finally, an ARIMA model was fitted using historical data, residual analysis was performed, and future projections were made.
3. Results and discussion
3.1. Stationarity tests
The ARIMA model requires that the time series must be smooth, so the original data needs to be tested for smoothness. The Figure 1 shows that the series has a long term upward trend. Therefore, this paper needs to perform a first order difference on the data and the first order difference result is shown in Figure 2.
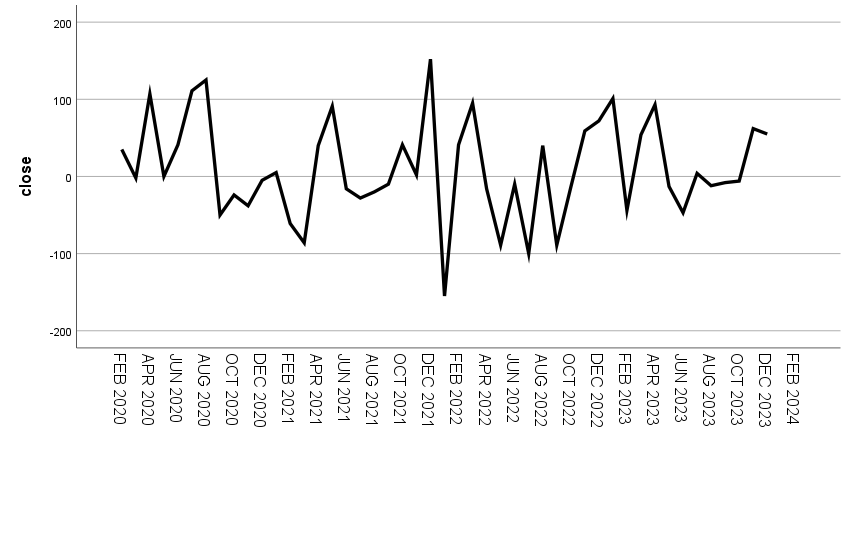
Figure 2. 1st order difference sequence
3.2. Determining ARIMA model order
The first order difference results shows that the data has smoothed out. Then the ACF and PACF plots are examined to observe the tailing, and the results are shown in Figure 3 and 4.
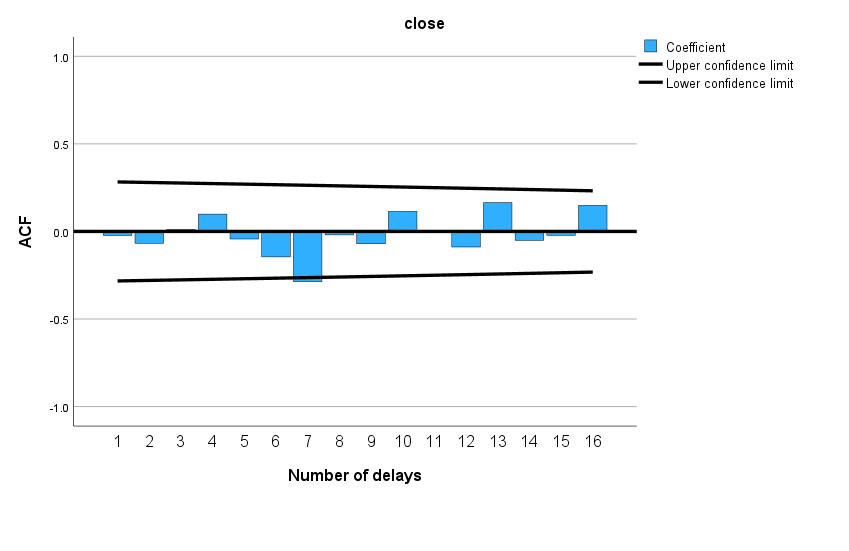
Figure 3. 1st order difference sequence ACF graph
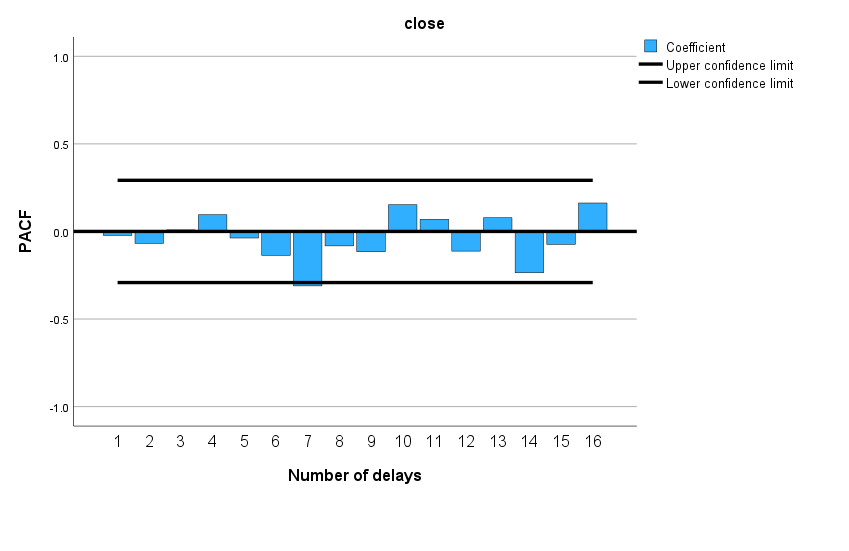
Figure 4. 1st order difference sequence PACF graph
As can be seen from Figures 3 and 4, the ACF and PACF plots of the original sequence after first-order differencing are all of order 0 trailing, so the sequence after first-order differencing is a smooth sequence, and both p and q are equal to 0.
Table 2. Comparison of models
AIC | RMSE | |
ARIMA (1,1,0) | 530.616 | 64.2048 |
ARIMA (2,1,0) | 532.397 | 64.0499 |
ARIMA (0,1,1) | 530.612 | 64.2019 |
ARIMA (0,1,2) | 532.432 | 64.0749 |
ARIMA (1,1,1) | 530.026 | 62.5005 |
ARIMA (2,1,1) | 534.395 | 64.0485 |
ARIMA (1,1,2) | 531.856 | 62.3537 |
Comparing the fitting of the different ARIMA models. In the table 2, the AIC and RSME of ARIMA models for different values of p and q are shown. It can be found that the RSME of ARIMA (1, 1, 2) is the lowest among all the models. It has the second lowest AIC among all the models. Preference is given to RSME, so ARIMA (1, 1, 2) is finally chosen.
3.3. Model estimation
The most appropriate ARIMA model was selected by comparing the RSME under different models using the ARIMA auto-ranking method. The final model selected was ARIMA (1, 1, 2). Modelling was carried out using SPSS software. The fitting results are shown in Table 2, Table 3 and Figure 5.
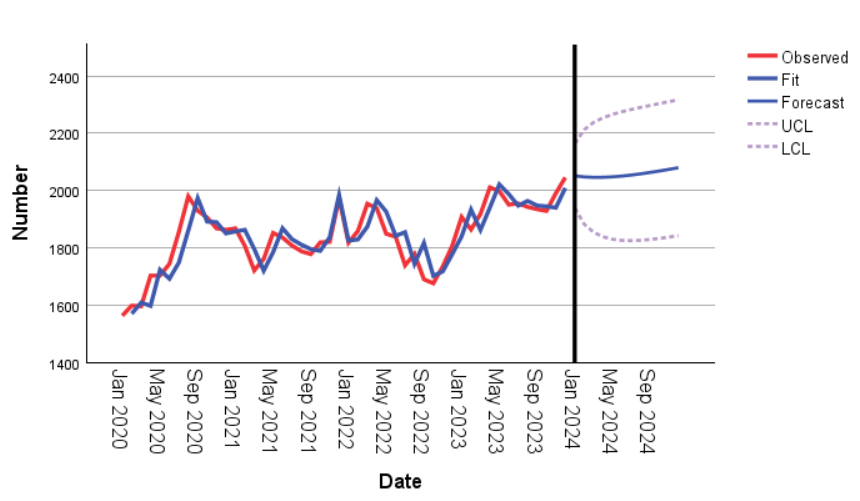
Figure 5. Fitting effect of modeling
The Figure 5 shows the gold settlement price for each month from January to December 2024. The measured and fitted values almost overlap and are very similar, which shows that the ARIMA model makes a better fit and prediction. The predicted values are also within the confidence interval, and from the predicted values.
Table 3. Data predication
ARIMA (1,1,2) | |||
Month | Forecast | UCL | LCL |
Jan-24 | 2052 | 2164 | 1939 |
Feb-24 | 2048 | 2213 | 1883 |
Mar-24 | 2046 | 2238 | 1854 |
Apr-24 | 2046 | 2254 | 1839 |
May-24 | 2048 | 2266 | 1830 |
Jun-24 | 2051 | 2275 | 1826 |
Jul-24 | 2054 | 2283 | 1825 |
Aug-24 | 2059 | 2291 | 1826 |
Sep-24 | 2063 | 2298 | 1829 |
Oct-24 | 2069 | 2304 | 1833 |
Nov-24 | 2074 | 2311 | 1838 |
Dec-24 | 2080 | 2317 | 1843 |
The exact price of the projected gold settlement price for each month of 2024 is shown in Table 3. From the exact prices, there is a slight decrease in the price of gold in the first half of 2024, which generally remains unchanged. This is followed by an upward trend in the second half of 2024.
Table 4. Model statistics
Model | Model fit statistics | Ljung-Box | Outliers | |||
Stable R2 | R2 | Statistics | DF | Sig. | ||
ARIMA(1,1,2) | 0.313 | 0.748 | 12.286 | 15 | 0.657 | 1 |
The residual PACF coefficients also approximate 0. The sig. term is greater than 0.05 and the residual series is free of autocorrelation in Table 4.
3.4. Residual test
It is also necessary to perform a white noise test on the residual terms If autocorrelation exists in the residuals, one should consider adding an autoregressive or sliding average interpretation, re-modeling and evaluating the model, and then performing a white noise test on the residuals of the new model, and so on, until the residuals are determined to be white noise.
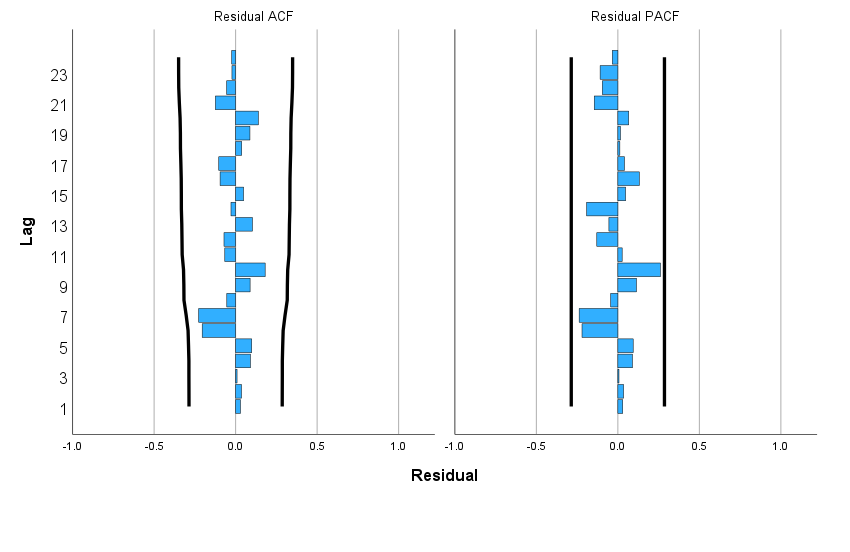
Figure 6. Final model fitting residual
As can be seen in Figure 6, all autocorrelation coefficients fall within the confidence intervals after the 1st order differencing of the original time series. The residual terms were tested for normality. Q-Q plots were plotted in SPSS and the results are shown in Figure 7.
Most of the residual data from the model fit fall around the diagonal, indicating that the distribution of the data does not differ much from the theoretical one, and thus the residuals are considered to conform to the normal distribution. It can be determined that the residual term after model fitting is a white noise sequence.
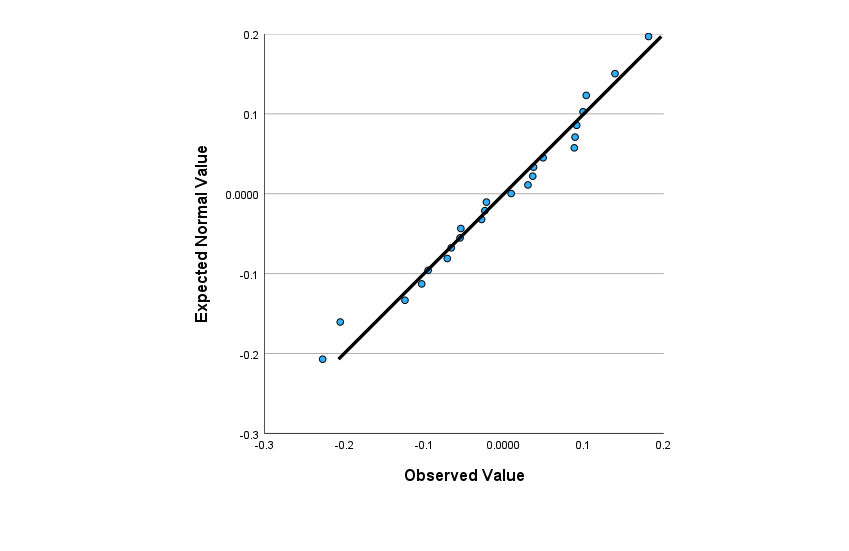
Figure 7. Q-Q plots of model fitting residuals
3.5. Discussion
Although the above model passes the test and shows some accuracy, some problems can still be found in the prediction graphs. The fitted values are slightly backward from the measured values and do not match exactly. With the overall upward trend in the predicted values, it can be assumed that the price of gold will steadily increase in the coming months and will break through the all-time highs. The main reason for this was the continued weakening of the United States dollar. The price of gold is settled in dollars, and when the dollar exchange rate becomes low, which means that the dollar depreciates, then the price of gold goes up. There is also the international political turmoil is now very big, some countries between the conflict is strong, triggering a reduction in the production of gold, the market supply of gold is reduced, prompting the price of gold rose.
4. Conclusion
This study used the AIRMA model to systematically forecast gold futures prices. According to the research, with today’s social unrest and challenges such as ongoing geopolitical tensions may provide some support for gold prices. This paper argues that gold still has investment value in 2024, because the United States and other developed economies may face a shift in monetary policy, global instability, gold as a safe-haven asset is expected to increase in value. But the price of gold may be constrained by economic recovery and rising interest rates. Therefore, a comprehensive assessment of the suitability of buying gold in 2024 needs to be made based on individual circumstances and needs. Investors can follow the trend of gold prices, understand the market volatility and risks, and choose reputable gold brands for investment. The final decision should be made based on one’s financial situation and investment objectives to get the best return on investment.
References
[1]. Yang C 2023 International gold futures forecast based on VMD-LASSO-LSTM. Wuhan University of Science and Technology.
[2]. Abu D I, et al. 2023 Enhancing multilayer perceptron neural network using archive-based harris hawks optimizer to predict gold prices. J. King Saud Univ.-Comput. Inf. Sci.
[3]. Liu C Y 2023 Research on Forecasting of Gold Futures Price Based on LASSO-QRNN. Central South University.
[4]. Yang T T 2023 Research on price discovery and volatility spillover effect in China’s gold market. East China University of Political Science and Law.
[5]. Yang X Y 2023 Gold futures price prediction based on CNN-BiGRU model. Henan University.
[6]. Tully E and Lucey B M 2007 A power GARCH examination of the gold market. Research in International Business & Finance, 21(2), 316-325.
[7]. Lian Z, et al. 2010 Improved gold price prediction based on BP neural network. Computer Integrated Manufacturing Systems, 27(9), 200-203.
[8]. Singh G, Tripathy B and Singh J 2023 An Evaluation of Extreme Learning Machine Algorithm to Forecasting the Gold Price. 2023 7th International Conference on Electronics, Communication and Aerospace Technology (ICECA), Coimbatore, India, 523-529.
[9]. Rapach D E, Strauss J K and Zhou G 2010 Out-of-Sample equity premium prediction: Combination forecasts and links to the real economy. Review of Financial Studies, 23(2), 821–862.
[10]. Jin W 2022 Gold futures price prediction research based on CEEMDAN-GRU. Beijing Jiaotong University.
Cite this article
Bai,Y. (2024). Research on gold price prediction based on ARIMA model. Theoretical and Natural Science,52,41-48.
Data availability
The datasets used and/or analyzed during the current study will be available from the authors upon reasonable request.
Disclaimer/Publisher's Note
The statements, opinions and data contained in all publications are solely those of the individual author(s) and contributor(s) and not of EWA Publishing and/or the editor(s). EWA Publishing and/or the editor(s) disclaim responsibility for any injury to people or property resulting from any ideas, methods, instructions or products referred to in the content.
About volume
Volume title: Proceedings of CONF-MPCS 2024 Workshop: Quantum Machine Learning: Bridging Quantum Physics and Computational Simulations
© 2024 by the author(s). Licensee EWA Publishing, Oxford, UK. This article is an open access article distributed under the terms and
conditions of the Creative Commons Attribution (CC BY) license. Authors who
publish this series agree to the following terms:
1. Authors retain copyright and grant the series right of first publication with the work simultaneously licensed under a Creative Commons
Attribution License that allows others to share the work with an acknowledgment of the work's authorship and initial publication in this
series.
2. Authors are able to enter into separate, additional contractual arrangements for the non-exclusive distribution of the series's published
version of the work (e.g., post it to an institutional repository or publish it in a book), with an acknowledgment of its initial
publication in this series.
3. Authors are permitted and encouraged to post their work online (e.g., in institutional repositories or on their website) prior to and
during the submission process, as it can lead to productive exchanges, as well as earlier and greater citation of published work (See
Open access policy for details).
References
[1]. Yang C 2023 International gold futures forecast based on VMD-LASSO-LSTM. Wuhan University of Science and Technology.
[2]. Abu D I, et al. 2023 Enhancing multilayer perceptron neural network using archive-based harris hawks optimizer to predict gold prices. J. King Saud Univ.-Comput. Inf. Sci.
[3]. Liu C Y 2023 Research on Forecasting of Gold Futures Price Based on LASSO-QRNN. Central South University.
[4]. Yang T T 2023 Research on price discovery and volatility spillover effect in China’s gold market. East China University of Political Science and Law.
[5]. Yang X Y 2023 Gold futures price prediction based on CNN-BiGRU model. Henan University.
[6]. Tully E and Lucey B M 2007 A power GARCH examination of the gold market. Research in International Business & Finance, 21(2), 316-325.
[7]. Lian Z, et al. 2010 Improved gold price prediction based on BP neural network. Computer Integrated Manufacturing Systems, 27(9), 200-203.
[8]. Singh G, Tripathy B and Singh J 2023 An Evaluation of Extreme Learning Machine Algorithm to Forecasting the Gold Price. 2023 7th International Conference on Electronics, Communication and Aerospace Technology (ICECA), Coimbatore, India, 523-529.
[9]. Rapach D E, Strauss J K and Zhou G 2010 Out-of-Sample equity premium prediction: Combination forecasts and links to the real economy. Review of Financial Studies, 23(2), 821–862.
[10]. Jin W 2022 Gold futures price prediction research based on CEEMDAN-GRU. Beijing Jiaotong University.


