


1. Introduction
Student performance is a fundamental criterion for evaluating excellence, as it reflects learning ability, intelligence, self-management skills, and more. High scores can boost students' self-confidence, help them gain admission to better universities, secure scholarships, and attract employers' attention, significantly impacting their future success [1]. The importance of academic performance often leads to anxiety. The Survey Report on Chinese Parents' Educational Anxiety Index, released in September 2018, analyzed 3205 questionnaires and found that the comprehensive anxiety index of parents' education reached 67 points out of 100, indicating a relatively high level of anxiety [2]. Therefore, it is crucial to discover the factors related to student achievement. The factors influencing student achievement and educational outcomes are multifaceted, complex, and interrelated. Students' attributes and abilities, social relationships, and family and societal structures all impact academic performance to varying degrees [3]. Moreover, studies have shown that students' academic performance is related to their cognitive style (CS), self-regulated learning (SRL), and working memory (WM) [4]. This paper aims to identify suitable methods to determine the factors influencing student achievement and predict their impact.
In 2021, Alani and Hawas conducted a comprehensive study on the factors affecting student performance at Sohar University. They surveyed various faculties, gathering data from 562 students through questionnaires. This data was critically analyzed using regression analysis. The study revealed that environmental factors significantly influence student performance, with students expressing a preference for a quiet and comfortable university environment. Furthermore, the linear regression model indicated that teachers with strong teaching skills and diverse teaching techniques positively impact student performance [5].
In 2023, a teacher discovered a significant positive correlation between academic performance and volitional quality through a comparative test of these factors in ordinary and excellent classes at a high school. The volitional characteristics of students vary significantly across different grades and academic levels, while gender differences in volitional character strength are not pronounced [6].
In 2024, Kocsis and Molnár conducted a study using meta-analyses and systematic reviews of up to 900 studies based on 600,000 university students to identify factors affecting student performance. The results showed that output variables GPA and obtained credits (ECTS) are mediated by two parts: student factors and throughput factors. Student factors include intrinsic motivation, self-regulated learning strategies, self-efficacy, and prior education, while throughput factors include work, finances, and academic engagement. However, there were contradictory results regarding age and family conditions. GPA, ECTS, and gender are the most relevant factors affecting student performance [7].
In summary, this report will use regression models to identify factors impacting student learning and build models to predict the relationship between student achievement and different factors.
2. Methodology
2.1. Data source
The dataset for this paper is from the Kaggle website (Student Performance Dataset). This dataset contains comprehensive information from 2392 high school students, and all datasets were used in this paper.
2.2. Variable selection
The dataset is sufficient and there are no missing data. Due to the fact that GPA and grade class are both indicators of student academic performance, this paper chooses to delete grade class. In addition, as the Student ID is only a serial number and has no impact on GPA, it is deleted.
Table 1. List of dependent and independent variables. | ||
Variable | Logogram | Meaning |
Age | \( {x_{1}} \) | The age ranges from 15 to 18 years |
Gender | \( {x_{2}} \) | Male (0), Female (1) |
Ethnicity | \( {x_{3}} \) | Caucasian (0), African American (1), Asian (2), Other (3) |
Parental Education | \( {x_{4}} \) | None (0), High School (1), College (2), Bachelor's (3),Higher (4) |
Study Time Weekly | \( {x_{5}} \) | Weekly study time in hours |
Absences | \( {x_{6}} \) | Number of absences during the school year |
Tutoring | \( {x_{7}} \) | No (0), Yes (1) |
Parental Support | \( {x_{8}} \) | None (0), Low (1), Moderate (2), High (3), Very High (4) |
Extracurricular | \( {x_{9}} \) | No (0), Yes (1) |
Sports | \( {x_{10}} \) | No (0), Yes (1) |
Music | \( {x_{11}} \) | No (0), Yes (1) |
Volunteering | \( {x_{12}} \) | No (0), Yes (1) |
GPA | \( Y \) | Grade Point Average on a scale from 2.0 to 4.0 |
The final selected data consists of 12 variables (age, gender, ethnicity, parental education, study time weekly, absences, tutoring, parental support, extracurricular, sports, music, volunteering) and a dependent variable (GPA). The specific student characteristics of this dataset are shown in Table 1.
2.3. Method introduction
This article employs a multiple linear regression model to fit student grades. In statistics, linear regression determines a line that best represents the overall trend of a data set [8]. Multiple linear regression is a statistical technique used to analyze the impact of several independent variables on a dependent variable. This section will mainly aim to compare the predictive ability and fitting accuracy of the model before and after removing some variables. The initial model includes 12 potential explanatory variables.
By using the stepwise regression method, iteratively remove variables that show low statistical significance. Stepwise regression is a technique that uses an automated process to select predictor variables. This method evaluates variables at each step based on criteria for a series of T or F tests, ultimately determining the final group of variables for the regression [9]. Rebuild the model after each elimination and re-evaluate the remaining variables. After completing the stepwise regression, select the final multiple linear regression model.
3. Results and discussion
3.1. Descriptive statistics
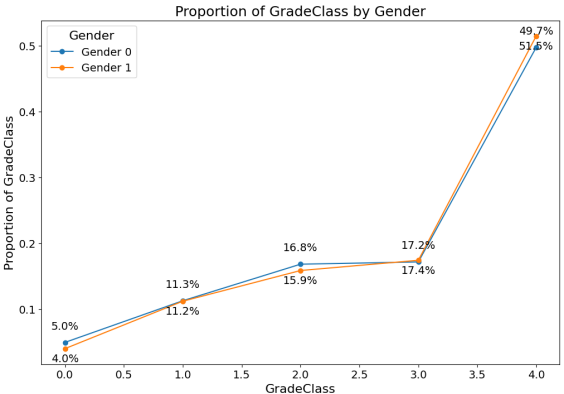
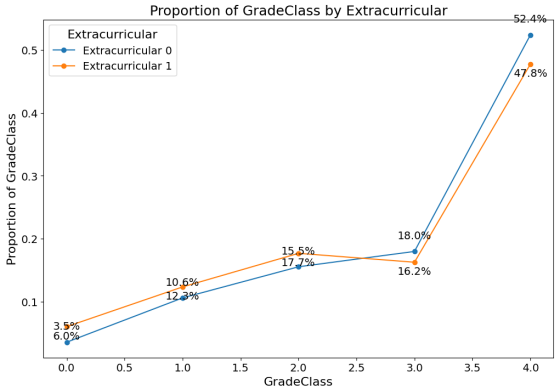
Visualizing the impact of gender and extracurricular on grade class through line graphs (Figure 1). The division between genders is roughly equal, indicating minimal influence on student academic performance. However, students participating in extracurricular activities demonstrate significantly better grades compared to those who do not participate.
|
Figure 1. Line charts of Gender and Extracurricular on Grade Class |
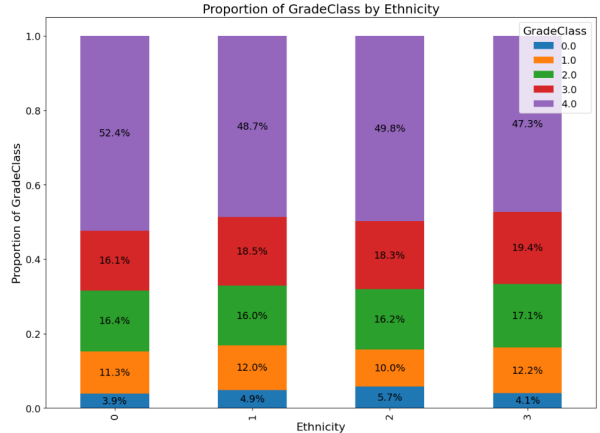
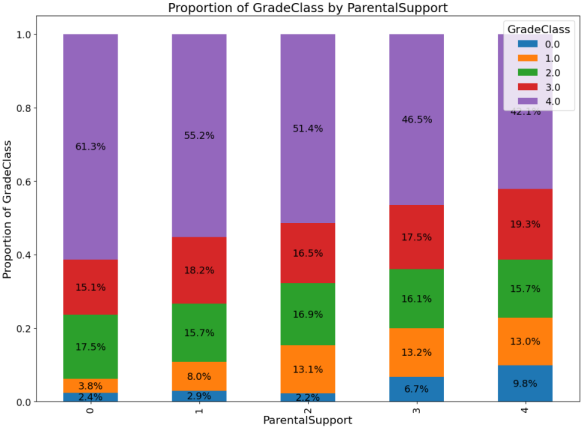
Bar charts effectively illustrate the quantitative relationships between ethnicity, parental support, and student performance. As shown in Figure 2, the analysis reveals that the proportion of students across different grades remains consistent, indicating that ethnicity does not affect student performance. Conversely, there is a clear trend showing that higher levels of parental support correlate with better student grades.
|
Figure 2. Bar charts of Ethnicity and Parental Support on Grade Class |
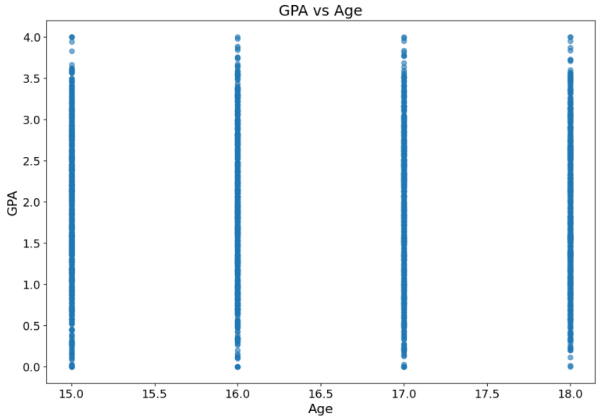
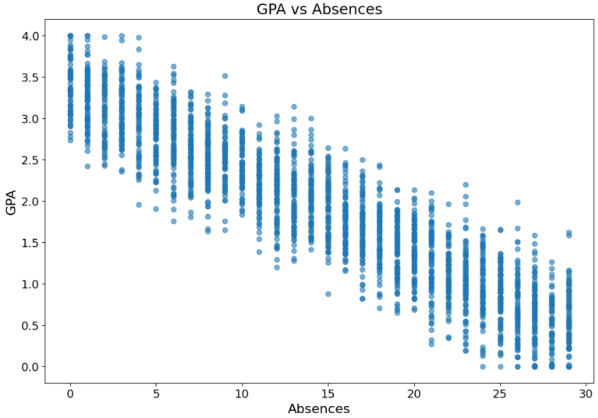
Scatter plots are used to measure the number of absences and age. Scatter plots visually display the relationship between two variables and the approximate distribution of the data. They provide key information such as data distribution, sample size, and the identification of outliers [10]. By studying the distribution of the points on Figure 3, it is aimed to determine the correlation and to summarize the distribution pattern of the points. For age, Figure 3 shows an approximate distribution of each age at different grade class, suggesting that age has no impact on student performance. For absences, there is a clear negative correlation between student performance and the number of absences. The more absences, the lower the student grades.
|
Figure 3. Scatter plots of Absences and Age on GPA |
3.2. Correlation analysis
In the dataset, there are a total of 12 factors that affect student performance, and the Pearson correlation coefficient between these factors and GPA is shown in the following figure 4:
|
Figure 4. Sample Figure Caption |
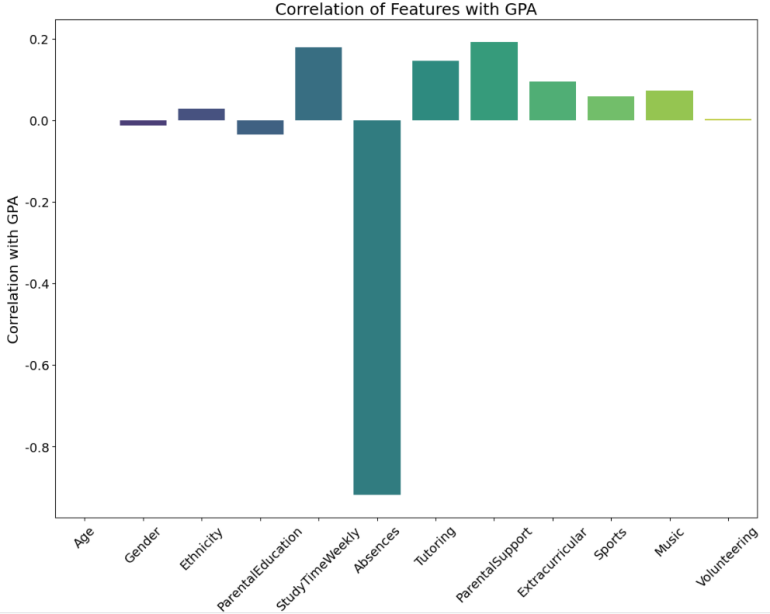
The study data reveals that absences have the strongest negative correlation with GPA, indicating that the more a student is absent, the poorer their academic performance. In contrast, GPA shows significant positive correlations with weekly study time, tutoring, and parental support, suggesting that extracurricular study and external assistance can significantly boost academic performance. Additionally, activities such as extra curricular, sports, and music are positively correlated with GPA, though these correlations are not statistically significant. Factors like age, gender, ethnicity, parental education, and volunteering exhibit very weak correlations with GPA. Overall, the factors influencing GPA are multifaceted, with attendance, study habits, and parental support playing crucial roles.
3.3. Model
3.3.1. Initial Model
After conducting a correlation analysis of the factors influencing student performance, a multiple regression analysis was performed to establish a comprehensive model that includes all variables. The general mathematical model for multiple linear regression is as follows:
\( E(Y)={β_{0}}+{β_{1}}{x_{1}}+{β_{2}}{x_{2}}+⋯+{β_{12}}{x_{12}}+e \) (1)
In the above formula: is a constant term, and e is the error term accounting for the variability not explained by the independent variables.
Table 2 presents the regression coefficients of the multiple linear regression model. From the table, it can be observed that X1, X2, X3, X4, and X12 have no significant impact on the dependent variable, as their p-values are greater than 0.05. Additionally, all variables have VIF values close to 1, indicating that there is no issue of multicollinearity. Therefore, there are 7 independent variables that have a significant impact on the dependent variable Y. Based on the regression coefficients, the multiple linear regression equation is as follows:
\( E(Y)=1.3391-0.006{x_{1}}+0.011{x_{2}}+⋯-0.005{x_{12}} \) (2)
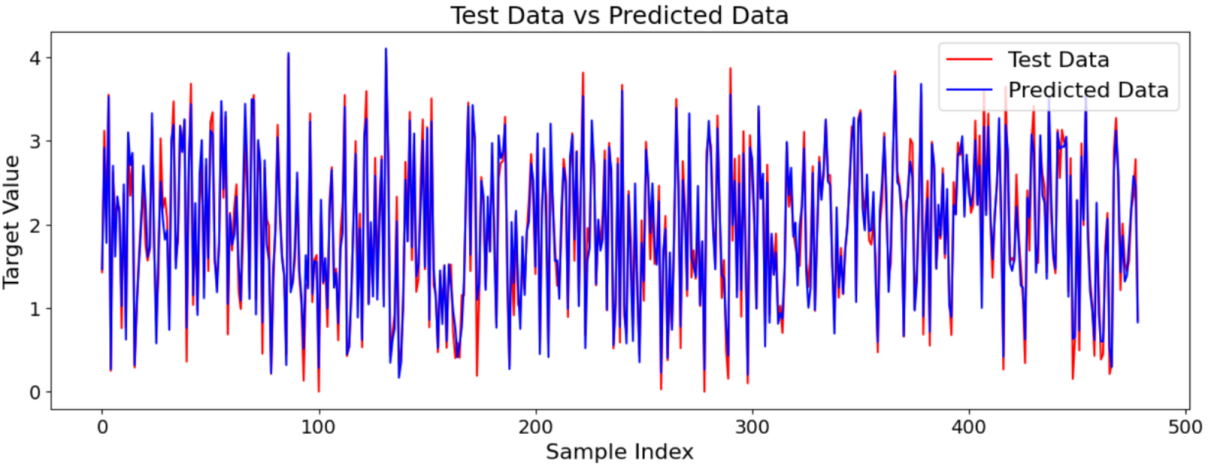
The fitted multiple linear regression model yields an R-squared value of 0.954 and an adjusted R-squared value of 0.954, indicating a high degree of fit. Figure 5 shows the line plot comparing the test data with the predicted data. The trends of the two lines are consistent and exhibit a high degree of similarity. This suggests that the model effectively captures the overall trend of the data and achieves high predictive accuracy, even though there are some deviations in specific values.
Table 2. Regression coefficient table for the initial model | |||||||
B | S.E. | Beta | T | P>|t| | VIF | ||
Constant | 1.3391 | 0.015 | 1.901 | 87.483 | 0.000 | 11.563 | |
X1 | -0.006 | 0.005 | -0.006 | -1.424 | 0.155 | 1.012 | |
X2 | 0.011 | 0.009 | 0.005 | 1.164 | 0.245 | 1.006 | |
X3 | 0.005 | 0.004 | 0.005 | 1.085 | 0.278 | 1.004 | |
X4 | 0.000 | 0.005 | 0.000 | 0.027 | 0.978 | 1.006 | |
X5 | 0.166 | 0.005 | 0.166 | 36.687 | 0.000 | 1.005 | |
X6 | -0.844 | 0.005 | -0.844 | -187.141 | 0.000 | 1.004 | |
X7 | 0.258 | 0.010 | 0.119 | 26.279 | 0.000 | 1.005 | |
X8 | 0.148 | 0.004 | 0.165 | 36.640 | 0.000 | 1.004 | |
X9 | 0.190 | 0.009 | 0.092 | 20.394 | 0.000 | 1.005 | |
X10 | 0.185 | 0.010 | 0.085 | 18.861 | 0.000 | 1.006 | |
X11 | 0.153 | 0.011 | 0.061 | 13.467 | 0.000 | 1.005 | |
X12 | -0.005 | 0.012 | -0.002 | -0.425 | 0.671 | 1.004 | |
| |||||||
Figure 5. Test data and predicted data | |||||||
3.3.2. Stepwise regression
Utilizing backward elimination, predictors will be iteratively removed from the initial model if their p-values exceed the threshold of 0.05. Starting with the full model, X1, X2, X3, X4, and X12 will be eliminated based on their initial p-values. After each removal, the model will be refitted, and the process will be repeated until all remaining predictors have p-values below the threshold.
Based on the data above, it is evident that all predictor variables have p-values less than 0.05, indicating significant effects on the dependent variable Y. Among them, X6 has a negative effect, while the others have positive effects. The VIF values are relatively low, suggesting little multicollinearity among the predictors. Therefore, the improved linear regression equation is:
\( E(Y)=1.348+0.166{x_{5}}-0.844{x_{6}}+⋯+0.152{x_{11}} \) (3)
The fitted multiple linear regression model yields an R-squared of 0.954 and an adjusted R-squared of 0.954, indicating a high degree of fit. The F-statistic is a statistical measure used to assess the overall significance of the model. In this model, the F-statistic is 5649, with a corresponding probability value close to 0, indicating that the model is significant.
Table 3. Regression coefficient table for the improved model | ||||||
B | S.E. | Beta | T | P>|t| | VIF | |
Constant | 1.348 | 0.011 | 1.901 | 118.566 | 0.000 | - |
X5 | 0.166 | 0.005 | 0.166 | 36.775 | 0.000 | 1.003 |
X6 | -0.844 | 0.005 | -0.844 | -187.392 | 0.000 | 1.002 |
X7 | 0.258 | 0.010 | 0.118 | 26.293 | 0.000 | 1.350 |
X8 | 0.148 | 0.004 | 0.165 | 36.624 | 0.000 | 2.015 |
X9 | 0.190 | 0.009 | 0.092 | 20.502 | 0.000 | 1.443 |
X10 | 0.186 | 0.010 | 0.085 | 18.965 | 0.000 | 1.341 |
X11 | 0.152 | 0.011 | 0.061 | 13.455 | 0.000 | 1.209 |
3.3.3. Comparison results
Based on the results of two linear regression models, Table 4 lists the characteristics of the two models used to compare their performance in fitting and predictive ability.
Table 4. Comparison between the two models | ||
Initial model | Improved model | |
R-squared: | 0.954 | 0.954 |
Adj. R-squared | 0.954 | 0.954 |
F-statistic | 3295 | 5649 |
MSE | 0.03866 | 0.03877 |
RMSE | 0.19663 | 0.19691 |
AIC | -776.1 | -781.4 |
BIC | -703.9 | -737.0 |
Based on the comparison, the two sets of model results show very close values for R-squared, adjusted R-squared, MSE, and RMSE, indicating similar performance in fitting the data and predicting accuracy. However, the F-statistic value of 5649 for the improved model is significantly higher than the initial model, suggesting that the variables in the second model have a more significant overall impact on the dependent variable (GPA). From the perspective of AIC and BIC, the values of the improved model are smaller, indicating a slight advantage in balancing model fit and complexity. In conclusion, the improved model, as compared to the initial model, demonstrates better variable influence, fitting effectiveness, and simplicity.
4. Conclusion
This study aims to explore the factors influencing student achievement and predict their impact through comprehensive data collation and multiple linear regression analysis. The dataset includes information from 2,392 students and initially comprises 13 variables. After thorough preprocessing, the dataset underwent analysis using various visualization techniques such as line charts, bar charts, and scatter plots. These visualizations provided a preliminary analysis of the significance and correlation (positive or negative) of various factors on student achievement. Notably, among the three factors negatively correlated with GPA, except for absences, gender and parental education showed no significant correlation with GPA.
This study initially employs a multiple linear regression model, integrating all influencing factors to further examine their relationship with student performance. Factors with low correlations were excluded based on p-values, and VIF values were checked to avoid multicollinearity issues. Ultimately, stepwise regression confirmed that seven factors significantly impact student performance: study time weekly, number of absences, tutoring, parental support, extracurricular, sports and music. Among these factors, absences were negatively correlated with student performance, while the other factors were positively correlated.
In this study, the influence of different factors on students' achievement is determined, but only the overall prediction is made, and the impact of each factor on students' achievement cannot be accurately specified. In order to improve this, different factors can be reanalyzed and grouped, and linear regression can be performed again to obtain the influence of single or a small number of combined factors on student achievement.
References
[1]. Plessis S 2023 5 Reasons Why Grades Are Important. Working paper.
[2]. Li J 2021 A Study on the Formation Mechanism of Educational Anxiety among Parents of Primary and Secondary School Students: A Case Study of Chongqing City, Chongqing University of Business and Technology, 10, 16-21.
[3]. Utah State Board of Education 2019 Factors influencing student learning. Hanover Research, 1-5.
[4]. Wang T and Kao C 2022 Investigating factors affecting student academic achievement in mathematics and science: cognitive style, self-regulated learning and working memory. SpringerLink, 50(5), 789-806.
[5]. Alani F S and Hawas A 2021 Factors Affecting Students Academic Performance: A Case Study of Sohar University. PSYCHOLOGY AND EDUCATION, 58(5), 4624-4635.
[6]. High School Students, Journal of Ningxia University, Humanities & Social Sciences Edition 45(4), 142-149.
[7]. Kocsis A and Molnar G 2024 Factors influencing academic performance and dropout rates in higher education. Oxford Review of Education, 1-19.
[8]. Stewart K 2024 Linear regression Britannica. Working paper.
[9]. Miller A and Panneerselvam J 2021 A review of regression and classification techniques for analysis of common and rare variants and gene-environmental factors. Science Direct, 466-485.
[10]. Sainani K L 2016 The Value of Scatter Plots. Statistically Speaking, 1213-1217.
Cite this article
Pei,C. (2024). Research on the influencing factors of student performance. Theoretical and Natural Science,41,43-50.
Data availability
The datasets used and/or analyzed during the current study will be available from the authors upon reasonable request.
Disclaimer/Publisher's Note
The statements, opinions and data contained in all publications are solely those of the individual author(s) and contributor(s) and not of EWA Publishing and/or the editor(s). EWA Publishing and/or the editor(s) disclaim responsibility for any injury to people or property resulting from any ideas, methods, instructions or products referred to in the content.
About volume
Volume title: Proceedings of the 2nd International Conference on Mathematical Physics and Computational Simulation
© 2024 by the author(s). Licensee EWA Publishing, Oxford, UK. This article is an open access article distributed under the terms and
conditions of the Creative Commons Attribution (CC BY) license. Authors who
publish this series agree to the following terms:
1. Authors retain copyright and grant the series right of first publication with the work simultaneously licensed under a Creative Commons
Attribution License that allows others to share the work with an acknowledgment of the work's authorship and initial publication in this
series.
2. Authors are able to enter into separate, additional contractual arrangements for the non-exclusive distribution of the series's published
version of the work (e.g., post it to an institutional repository or publish it in a book), with an acknowledgment of its initial
publication in this series.
3. Authors are permitted and encouraged to post their work online (e.g., in institutional repositories or on their website) prior to and
during the submission process, as it can lead to productive exchanges, as well as earlier and greater citation of published work (See
Open access policy for details).
References
[1]. Plessis S 2023 5 Reasons Why Grades Are Important. Working paper.
[2]. Li J 2021 A Study on the Formation Mechanism of Educational Anxiety among Parents of Primary and Secondary School Students: A Case Study of Chongqing City, Chongqing University of Business and Technology, 10, 16-21.
[3]. Utah State Board of Education 2019 Factors influencing student learning. Hanover Research, 1-5.
[4]. Wang T and Kao C 2022 Investigating factors affecting student academic achievement in mathematics and science: cognitive style, self-regulated learning and working memory. SpringerLink, 50(5), 789-806.
[5]. Alani F S and Hawas A 2021 Factors Affecting Students Academic Performance: A Case Study of Sohar University. PSYCHOLOGY AND EDUCATION, 58(5), 4624-4635.
[6]. High School Students, Journal of Ningxia University, Humanities & Social Sciences Edition 45(4), 142-149.
[7]. Kocsis A and Molnar G 2024 Factors influencing academic performance and dropout rates in higher education. Oxford Review of Education, 1-19.
[8]. Stewart K 2024 Linear regression Britannica. Working paper.
[9]. Miller A and Panneerselvam J 2021 A review of regression and classification techniques for analysis of common and rare variants and gene-environmental factors. Science Direct, 466-485.
[10]. Sainani K L 2016 The Value of Scatter Plots. Statistically Speaking, 1213-1217.