


1. Introduction
E-commerce (EC), short for electronic commerce, known to the activity of purchasing or selling products online service or over the Internet. Jain states that business methods are transformed because of Information Technology (IT) and globalization, and EC takes a significant role in the electronic business, affecting the traditional market system [1]. Over the past few decades, sales on the global EC market have continued increasing. This tendency emphasizes how important it is for businesses to interact with customers on digital platform, as well as how consumer buying habits are changing. EC provides enormous market opportunities and advantages, but also new challenges, especially in analyzing and predicting [2].
The existing researches indicates that customer purchasing behavior is influenced by multiple factors. Kumar concluded that the following five elements have been found to be crucial to an e-commerce store’s success: net benefit, trust, information quality, system quality, and service quality [3]. Besides, price sensitivity and promotional strategies contribute to consumers’ decisions, while Hansen and Tambo showed that brand and product channels also affect e-commerce from the perspective of information system [4-6]. Social media is regarded as the major way of delivering information from sellers to customers and connecting the global community. Another definition of social media is a collection of web-based tools that expand on the technical underpinnings that facilitate the sharing and production of user-generated content [7]. Furthermore, individualized suggestion systems are essential for raising conversion rates and consumer satisfaction. Raji pointed out that Businesses must comprehend and take advantage of AI-driven tactics as they navigate the digital landscape in order to remain competitive and satisfy the changing demands of tech-savvy customers [8]. The study by Liao and Sundar investigated consumer preference by following the heuristic-systematic model in social psychology. The results indicated a tendency that people to prefer content-based filtering with higher matches to seek for cognition for the experience product, while collaborative filtering increases favorable reviews for search items by inducing the "bandwagon effect" [9].
The development of EC pointed out the problem of “information overload”, and then discussed the personalized service content and personalized service mode to prove the relevance of the factors that affect customers’ shopping behavior, but Liu also mentioned that the flexibility of the recommendation system is insufficient [10]. However, although these studies provide valuable insights into understanding customers' purchasing behavior, most studies do not cover a comprehensive range of variables or lack further research on multiple influences. For this reason, comprehensive insights into how these factors collectively impact purchasing decisions are sparse, so it is necessary to analyze it in a more integrated approach.
This study aims to address this gap by using the dataset available on Kaggle, named the “E-commerce dataset”. For the businesses, the capacity of tracking customer consumption behavior over an extended period of time is helpful in obtaining specific measures for future product trends, customer preferences, and also the market rivalry.
In summary, E-commerce analysis and customer behavior have attracted numerous scholars, and this topic deserves in-depth study and further research. This article aims to analyze customer behavior based on the dataset about e-commerce trends to visualize the data using statistical models.
2. Methodology
2.1. Data source
The dataset used in this paper is obtained from the Kaggle website (Exploring E-commerce Trends). The dataset contains information on 1000 products across different categories ranging from electronics to commodities. A product's price, rating, quantity of stock, number of reviews, discounts, sales, and date of inventory addition are all related with it. The dataset was collected by Muhammad Roshan Riaz. The original dataset preserved in .csv format.
2.2. Variable selection
The original dataset included the variables of product ID, category, price, rating, number of reviews, stock quantity, discount, sales, and the date added the inventories (Table 1).
Table 1. List of variables
Variable | Logogram | Meaning |
Product Name | \( {x_{1}} \) | The name of the product |
Category | \( {x_{2}} \) | The type of the product |
Price | \( {x_{3}} \) | The cost of the item |
Rating | \( {x_{4}} \) | Grade according to quality |
Number of reviews | \( {x_{5}} \) | Number of reviews consumer writing |
Quantity of stock | \( {x_{6}} \) | Number of inventories |
Discount | \( {x_{7}} \) | A deduction from the cost of the product |
Sales | \( Y \) | Number of products that customers purchasing |
The product ID is not worthwhile in this study, so the list of product IDs would not be included in the research. Since the dataset is clean, without any null variables, all of the 1000 groups of data will be contained in the study. Eventually, the analysis contains 1000 groups of data. The data includes 7 variables: Product Name, category, price, rating, number of reviews, quantity of stock, and discount. The one dependent variable is sales. The specific description of those variables is demonstrated in Table 1.
2.3. Methods introduction
The paper uses the random forest model and multiple linear regression mainly. An approach to group learning is called random forest. In order to increase prediction accuracy and stability, it builds several decision trees during training and combines the outcomes. Each tree is generated by random sampling of the original data and at each split, only a random subset of features is considered. This approach helps to reduce overfitting and enhances the generalization capability of the model. Moreover, this model can handle non-linear relationships between features effectively, and also tolerate missing values better. It automatically assesses the importance of a feature, helping to identify which variables are most significant for prediction. A linear regression model containing several explanatory variables is called a multiple linear regression model. It serves as an explanation for the linear relationship that exists between the variable being explained and several additional explanatory factors. Based on the result of random forest, the paper would further explore the effects by multiple linear regression with that feature.
3. Results and discussion
3.1. Random forest analysis
The graph below lists the variety of products category that contained in the dataset.
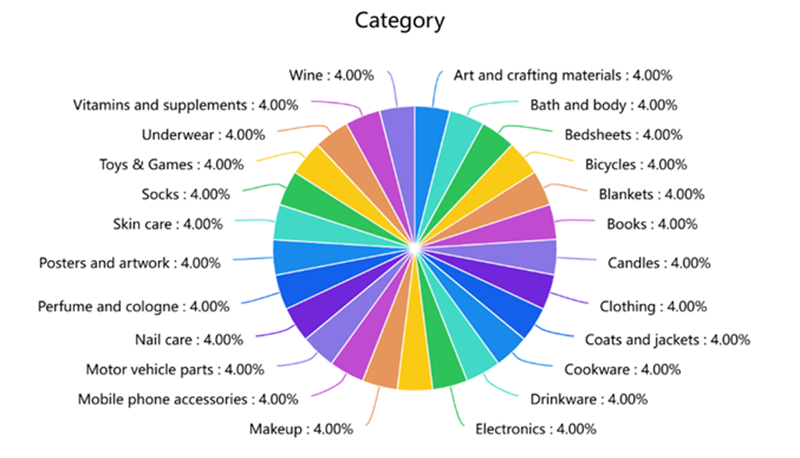
Figure 1. The Category of the dataset.
According to Figure 1, this dataset includes 25 different categories of products, ranging from electrics to blankets. Those products were mostly common in people’s daily lives, which means the probability of purchasing those products is high. Therefore, the dataset provides the author the value to analysis the important factor that affects consuming. Each category contains 40 products.
Figure 2 run by the random forest model shows how much weight each variable currently holds.
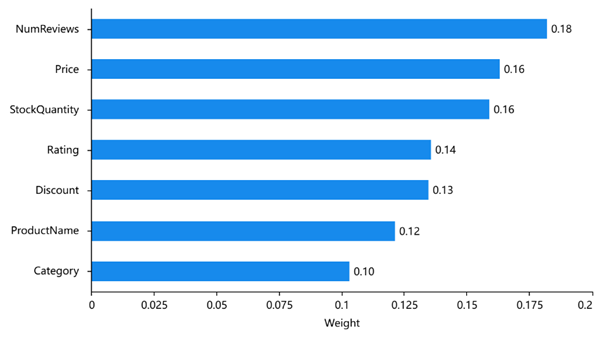
Figure 2. The varibles’ weight.
Figure 2 reveals the feature weight shows the importance of each title in the model, and its sum is 1. Base on this graph, the author found that the variable of x5 (NumReviews) is the most significant variable that affect the sales, accounted for 18.23%. Then, Price accounts for 16.33%. StockQuantity accounts for 15.93%. Rating accounts for 13.57%. Discount accounts for 13.47%. The above five features account for 77.54% in total.
Table 2. Model evaluation results
Index | Training set | Testing set |
R2 | 0.854 | -0.083 |
Mean Absolute Error (MAE) | 190.669 | 508.060 |
Mean Square Error (MSE) | 50165.560 | 348978.882 |
Root Mean Square Value (RMSE) | 223.977 | 590.744 |
Median Absolute Deviation (MAD) | 185.735 | 485.595 |
Mean Absolute Percentage Error (MAPE) | null | 3.116 |
Explained Variance Score (EVS) | 0.854 | -0.080 |
Mean Squared Log Error (MSLE) | 0.535 | 0.801 |
From Table 2, the random forest model performs well on the training set, exhibiting high explanatory power and low errors. However, its performance on the testing set is poor, with a negative R2 value and significantly higher mean squared error, indicating overfitting and a failure to generalize to the new data.
3.2. Multiple linear regression
Base on the findings in random forest, this paper can learn that NumReviews, price, StockQuantity were the key factors on sales. For this reason, continuing using the multiple linear regression according to these three points (Table 3).
The aforementioned table illustrates how the linear regression analysis is carried out, using Sales as the dependent variable and NumReviews, Price, and StockQuantity as independent variables. As can be seen from the above table, the model formula is as follows: Sales=925.620 + 0.022*NumReviews + 0.117*Price-0.000*StockQuantity. The model R-square value is 0.004, indicating that the 0.4% change in Sales can be explained by the factors of Price, StockQuantity, and NumReviews. As a result, it is not possible to properly assess how the independent variable affects the dependent variable. The testing fails the F test (F=1.335, p=0.261>0.05). This implies that NumReviews, Price, and StockQuantity have no effect on Sales.
Table 3. Parameter Estimates
Unstandardized Coefficients | Standardized Coefficients | t | p | Multicollinearity | |||
B | Std. Error | Beta | VIF | Tolerance | |||
Constant | 925.620 | 58.452 | - | 15.836 | 0.000** | - | - |
NumReviews | 0.022 | 0.013 | 0.056 | 1.777 | 0.076 | 1.001 | 0.999 |
Price | 0.117 | 0.130 | 0.028 | 0.897 | 0.370 | 1.000 | 1.000 |
StockQuantity | -0.000 | 0.063 | -0.000 | -0.003 | 0.998 | 1.000 | 1.000 |
R 2 | 0.004 | ||||||
Adj R 2 | 0.001 | ||||||
F | F (3,996) =1.335, p=0.261 | ||||||
D-W Value | 1.995 | ||||||
Notes: Dependent Variable=Sales | |||||||
* p<0.05 ** p<0.01 | |||||||
4. Conclusion
This study examined consumer purchasing behavior using the Kaggle dataset "Exploring E-commerce Trends" through the application of Multiple Linear Regression and Random Forest models. The Random Forest analysis revealed that the number of reviews, price, and stock quantity are significant predictors of sales. However, the model overfitted, showing good performance on the training set but poor performance on the testing set. On the other hand, the Multiple Linear Regression model's limited efficacy was seen in its low explanatory power for sales. The aforementioned results indicate that although the Random Forest model was able to identify significant aspects impacting sales, its overfitting problem and the inadequacy of the Multiple Linear Regression model underscore the necessity for more resilient techniques to precisely forecast client buying patterns in e-commerce. Therefore, in order to improve prediction accuracy and commercial decision-making, it is advised to incorporate new factors and use more advanced models.
The insights gained from this research have significant implications for e-commerce businesses. Understanding the key factors that influence sales can help businesses optimize their pricing strategies, manage stock more effectively, and enhance their online presence through customer reviews. The identification of overfitting in the Random Forest model underscores the importance of model validation and the need for techniques that can generalize well to new data.
The limited explanatory power of multiple linear regression and overfitting in Random Forest models could be addressed in future research by introducing more variables and utilizing sophisticated modeling approaches. Enhancing understanding of e-commerce consumer behavior can result in more accurate predictive models for improved business strategies. Real-time data and external elements like seasonal trends and economic situations can be incorporated.
References
[1]. Jain V, et al. 2021 An overview of electronic commerce (e-Commerce). J. Contemp. Issues Bus. Gov., 27(3), 665-670.
[2]. Kedah Z 2023 Use of e-commerce in the world of business. Startupreneur Bus. Digit. (SABDA J.), 2(1), 51-60.
[3]. Ayodeji O G 2021 E-retail factors for customer activation and retention: An empirical study from Indian e-commerce customers. J. Retail. Consum. Serv., 59, 102399.
[4]. Hufnagel G, Schwaiger M and Weritz L 2022 Seeking the perfect price: Consumer responses to personalized price discrimination in e-commerce. J. Bus. Res., 143, 346-365.
[5]. Garbarino E and Maxwell S 2010 Consumer response to norm-breaking pricing events in e-commerce. J. Bus. Res., 63(9), 1066-1072.
[6]. Hansen R and Tambo T 2011 Branding and Channel Issues in E-Commerce from an Information System's Perspective. Proc. IRIS, 200-215.
[7]. Kaplan A M and Haenlein M 2010 Users of the world, unite! The challenges and opportunities of social media. Bus. Horiz., 53(1), 59-68.
[8]. Raji M A, Olodo H B, Oke T T, Addy W A, Ofodile O C, Oyewole A T 2024 E-commerce and consumer behavior: A review of AI-powered personalization and market trends. GSC Adv. Res. Rev., 18(3), 66-77.
[9]. Liao M, Sundar S S 2022 When e-commerce personalization systems show and tell: Investigating the relative persuasive appeal of content-based versus collaborative filtering. J. Advert., 51(2), 256-267.
[10]. Liu L 2022 e-Commerce Personalized Recommendation Based on Machine Learning Technology. Mob. Inf. Syst., 1, 1761579.
Cite this article
Ding,W. (2024). Analysis of customer purchasing behavior in E-commerce model. Theoretical and Natural Science,52,201-206.
Data availability
The datasets used and/or analyzed during the current study will be available from the authors upon reasonable request.
Disclaimer/Publisher's Note
The statements, opinions and data contained in all publications are solely those of the individual author(s) and contributor(s) and not of EWA Publishing and/or the editor(s). EWA Publishing and/or the editor(s) disclaim responsibility for any injury to people or property resulting from any ideas, methods, instructions or products referred to in the content.
About volume
Volume title: Proceedings of CONF-MPCS 2024 Workshop: Quantum Machine Learning: Bridging Quantum Physics and Computational Simulations
© 2024 by the author(s). Licensee EWA Publishing, Oxford, UK. This article is an open access article distributed under the terms and
conditions of the Creative Commons Attribution (CC BY) license. Authors who
publish this series agree to the following terms:
1. Authors retain copyright and grant the series right of first publication with the work simultaneously licensed under a Creative Commons
Attribution License that allows others to share the work with an acknowledgment of the work's authorship and initial publication in this
series.
2. Authors are able to enter into separate, additional contractual arrangements for the non-exclusive distribution of the series's published
version of the work (e.g., post it to an institutional repository or publish it in a book), with an acknowledgment of its initial
publication in this series.
3. Authors are permitted and encouraged to post their work online (e.g., in institutional repositories or on their website) prior to and
during the submission process, as it can lead to productive exchanges, as well as earlier and greater citation of published work (See
Open access policy for details).
References
[1]. Jain V, et al. 2021 An overview of electronic commerce (e-Commerce). J. Contemp. Issues Bus. Gov., 27(3), 665-670.
[2]. Kedah Z 2023 Use of e-commerce in the world of business. Startupreneur Bus. Digit. (SABDA J.), 2(1), 51-60.
[3]. Ayodeji O G 2021 E-retail factors for customer activation and retention: An empirical study from Indian e-commerce customers. J. Retail. Consum. Serv., 59, 102399.
[4]. Hufnagel G, Schwaiger M and Weritz L 2022 Seeking the perfect price: Consumer responses to personalized price discrimination in e-commerce. J. Bus. Res., 143, 346-365.
[5]. Garbarino E and Maxwell S 2010 Consumer response to norm-breaking pricing events in e-commerce. J. Bus. Res., 63(9), 1066-1072.
[6]. Hansen R and Tambo T 2011 Branding and Channel Issues in E-Commerce from an Information System's Perspective. Proc. IRIS, 200-215.
[7]. Kaplan A M and Haenlein M 2010 Users of the world, unite! The challenges and opportunities of social media. Bus. Horiz., 53(1), 59-68.
[8]. Raji M A, Olodo H B, Oke T T, Addy W A, Ofodile O C, Oyewole A T 2024 E-commerce and consumer behavior: A review of AI-powered personalization and market trends. GSC Adv. Res. Rev., 18(3), 66-77.
[9]. Liao M, Sundar S S 2022 When e-commerce personalization systems show and tell: Investigating the relative persuasive appeal of content-based versus collaborative filtering. J. Advert., 51(2), 256-267.
[10]. Liu L 2022 e-Commerce Personalized Recommendation Based on Machine Learning Technology. Mob. Inf. Syst., 1, 1761579.