


1. Introduction
Globally, heart disease remains one of the leading causes of death, significantly impacting public health and healthcare systems for both children and adults [1, 2]. Despite advancements in medical technology and treatments like hydrogen therapy and gene therapy for heart failure, early detection and accurate prediction of heart disease remain key challenges [3, 4]. Given the complexity and multifactorial nature of heart disease, using sophisticated analytical techniques to uncover patterns and trends in the data is crucial. This study aims to utilize various machine learning models to predict the occurrence of heart disease. Accurate predictions of heart disease risk enable healthcare providers to allocate resources more effectively, plan preventive measures, and customize treatment plans for individual patients. Early intervention and prevention strategies can significantly reduce the risk of severe outcomes and improve patients' quality of life.
Numerous models have been explored for heart disease prediction. Islam et al. evaluated different algorithms, analyzing feature extraction, model optimization, and performance metrics like accuracy, precision, and recall [5]. Manikandan et al. assessed logistic regression, decision tree, and support vector machine (SVM) methods with and without Boruta feature selection [6]. Chen et al. focused on training patient-specific machine learning models by designing algorithms that emphasize data processing, neural network architecture, and loss function formulation for individualized detection [7]. Ghasemieh et al. implemented XGBoost as a meta-learner within a Stacking Ensemble Learner (SEL) model, achieving 88% accuracy in predicting emergency readmissions of heart disease patients, highlighting its clinical potential [8]. Victor Chang et al. developed a random forest model with 83% accuracy [9]. Sun et al. used logistic regression, k-nearest neighbors, SVM, decision tree, and random forest models, underscoring the significance of machine learning in heart disease prediction [10].
In summary, important data studies on heart disease have attracted the attention of many scholars. This paper primarily uses the random forest model to predict heart disease and provides corresponding recommendations for medical practitioners based on the prediction results.
2. Methodology
2.1. Data sources and descriptions
The dataset used is the Heart Disease Dataset from the Kaggle repository. Sourced from multiple clinical studies, it covers a wide range of attributes that provide essential data support for early detection and prediction of heart disease. Sections, subsections and subsubsections.
2.2. Indicator selection and explanation
The dataset, consisting of 1,025 samples, is split into a training set of 820 samples and a test set of 205 samples, with the test set comprising 20% of the data. There are 13 variables in this data, which are already reflected in Table 1.
Table 1. Logogram and meaning of the 14 factors
Elements | Logogram | Meaning |
Age | \( {x_{1}} \) | Age of the individual |
Sex | \( {x_{2}} \) | Gender: 1 for male, 0 for female |
CP | \( {x_{3}} \) | Type of chest pain experienced, ranging from 0 (asymptomatic) to 3 (non-anginal pain) |
Trestbps | \( {x_{4}} \) | Blood pressure in mm Hg at admission |
Chol | \( {x_{5}} \) | Cholesterol level in mg/dl |
Fbs | \( {x_{6}} \) | Fasting blood glucose > 120 mg/dl (1 = true, 0 = false) |
Restecg | \( {x_{7}} \) | Resting electrocardiographic results (0 = normal, 1 = ST-T wave abnormality, 2 = probable left ventricular hypertrophy) |
Thalach | \( {x_{8}} \) | Maximum heart rate achieved |
Exang | \( {x_{9}} \) | Presence of angina induced by exercise (1 = yes, 0 = no) |
Oldpeak | \( {x_{10}} \) | ST depression induced by exercise relative to rest |
Slope | \( {x_{11}} \) | Slope of the peak exercise ST segment (0 = upsloping, 1 = flat, 2 = down sloping) |
Ca | \( {x_{12}} \) | Number of major vessels colored by fluoroscopy (0-4) |
Thal | \( {x_{13}} \) | Thalassemia (1 = normal, 2 = fixed defect, 3 = reversible defect) |
Target | Y | Presence of heart disease (0 = no, 1 = yes) |
2.3. Method introduction
In the study, a random forest model is employed to determine the presence of heart disease, designated as the dependent variable (Y), with 13 factors serving as independent variables (X). Here, a value of 0 indicates absence and 1 indicates presence. The analysis of the interplay between these 13 factors and heart disease was conducted using Python code.
The core concept of the random forest model involves randomly selecting subsets of data to build multiple decision trees. Each tree in the model uses a different subset of features to make predictions. The model can be mathematically represented as follows:
Step 1. Bootstrap Sampling: From the original dataset D, generate B bootstrap samples \( {D_{b}} \) where b=1, 2, ..., B. \( {D_{b}} \) = {( \( {x_{i}} \) , \( {y_{i}} \) )} i=1, …, n for b=1, 2, ..., B.
Step 2. Decision Tree Construction: For each bootstrap sample, construct a decision tree \( {T_{b}} \) using a subset of features \( {F_{b}} \) ⊂ ℱ. The prediction for a single tree is \( \hat{{y^{b}}}(x) \) .
Step 3. Aggregation: Combine the predictions from all decision trees using majority voting (in classification) or by averaging the outcomes (in regression). The final prediction of the random forest \( \hat{y}(x) \) is: \( \hat{y}(x)=\frac{1}{B}\sum _{b=1}^{B}\hat{{y_{b}}}(x) \) .
The random forest model mitigates overfitting, boosts generalization, and increases accuracy better than a single decision tree. It benefits from requiring minimal assumptions about data distribution, managing high-dimensional data effectively, and exhibiting resilience against missing data. Constructing numerous trees and aggregating their outputs allows the random forest to deliver more reliable and precise predictions than individual models.
3. Results and discussion
3.1. Descriptive analysis
In the initial analysis of the heart disease dataset, this paper found that the target variable (presence of heart disease) maintained unique values of [0, 1] before and after data imputation. The dataset comprises 1,025 samples, divided into 80% training and 20% testing sets. The author described the variables statistically. These descriptive statistics provided a foundational understanding for subsequent analysis, helping people grasp the overall structure and characteristics of the data.
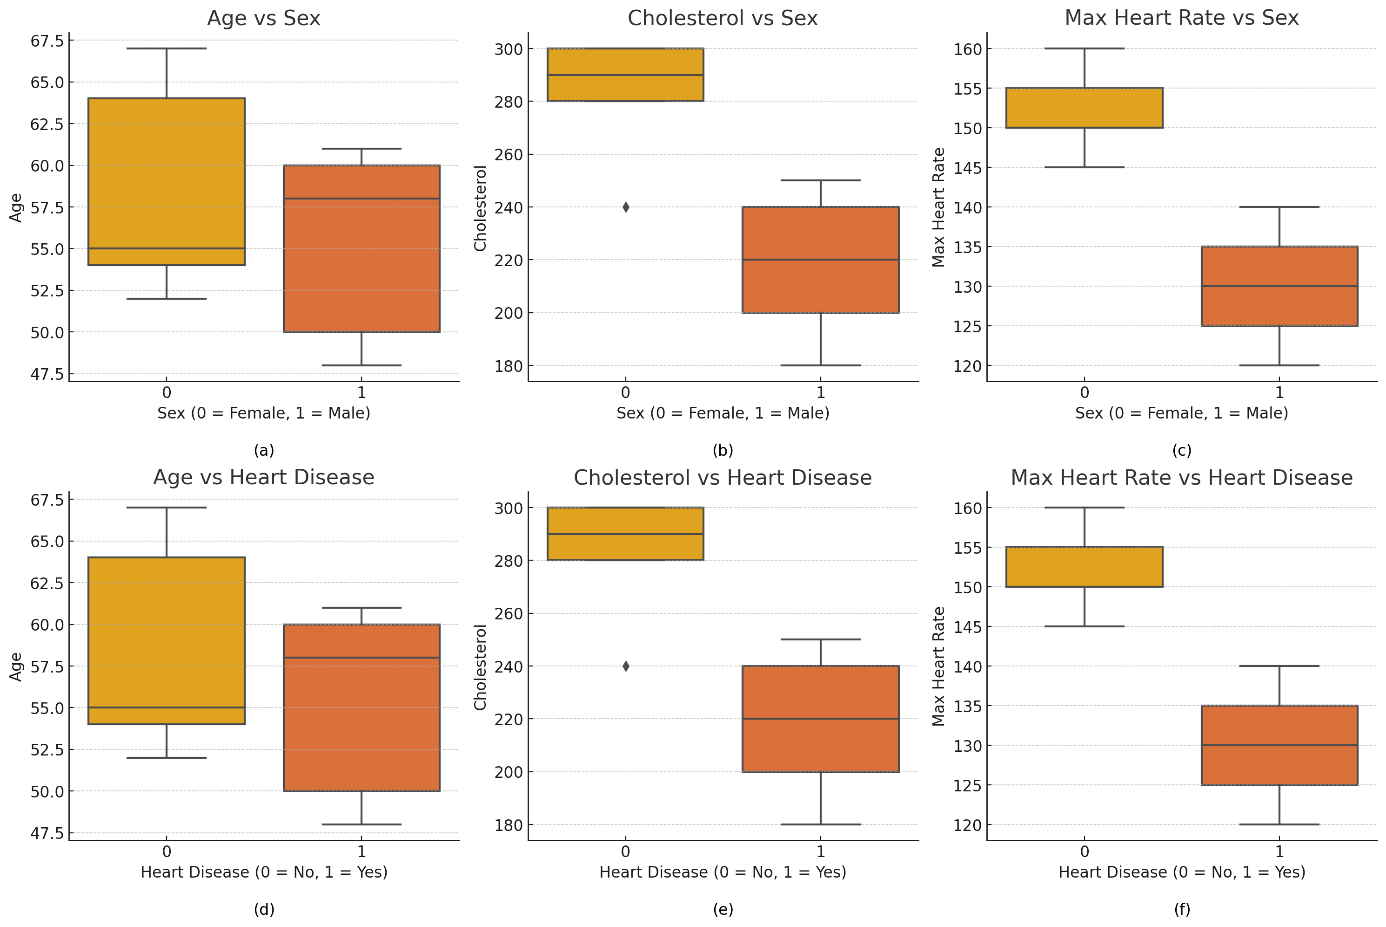
Figure 1. Grouped box plots
Figure 1 features six grouped box plots, comparing age, cholesterol levels, and maximum heart rate across different genders and heart disease statuses. The plots reveal that the age range for males is broader than for females, with a higher median age for those with heart disease. Cholesterol distribution is wider for females, while those with heart disease have a higher median cholesterol level and more high-value outliers. Regarding maximum heart rate, females have a slightly higher median than males, and individuals without heart disease have a higher and more concentrated distribution, whereas those with heart disease show a lower and more varied distribution. These visualizations provide clear insights into the relationships between the variables.
Figure 2 displays the interactions between four primary variables: \( {x_{1}} \) , \( {x_{4}} \) , \( {x_{5}} \) , and \( {x_{8}} \) . The scatter plots reveal a minimal correlation between age and cholesterol levels, suggesting a weak linkage. A notable negative correlation is observed between age and maximum heart rate, where the heart rate decreases as age increases-a typical physiological response. The trend between age and resting blood pressure shows a slight increase, but the correlation remains weak. No definitive correlations are seen between cholesterol level and maximum heart rate or between cholesterol level and resting blood pressure. The connection between maximum heart rate and resting blood pressure is also unclear. In summary, apart from the expected decline in heart rate with age, the correlations among these variables are either weak or nonexistent.
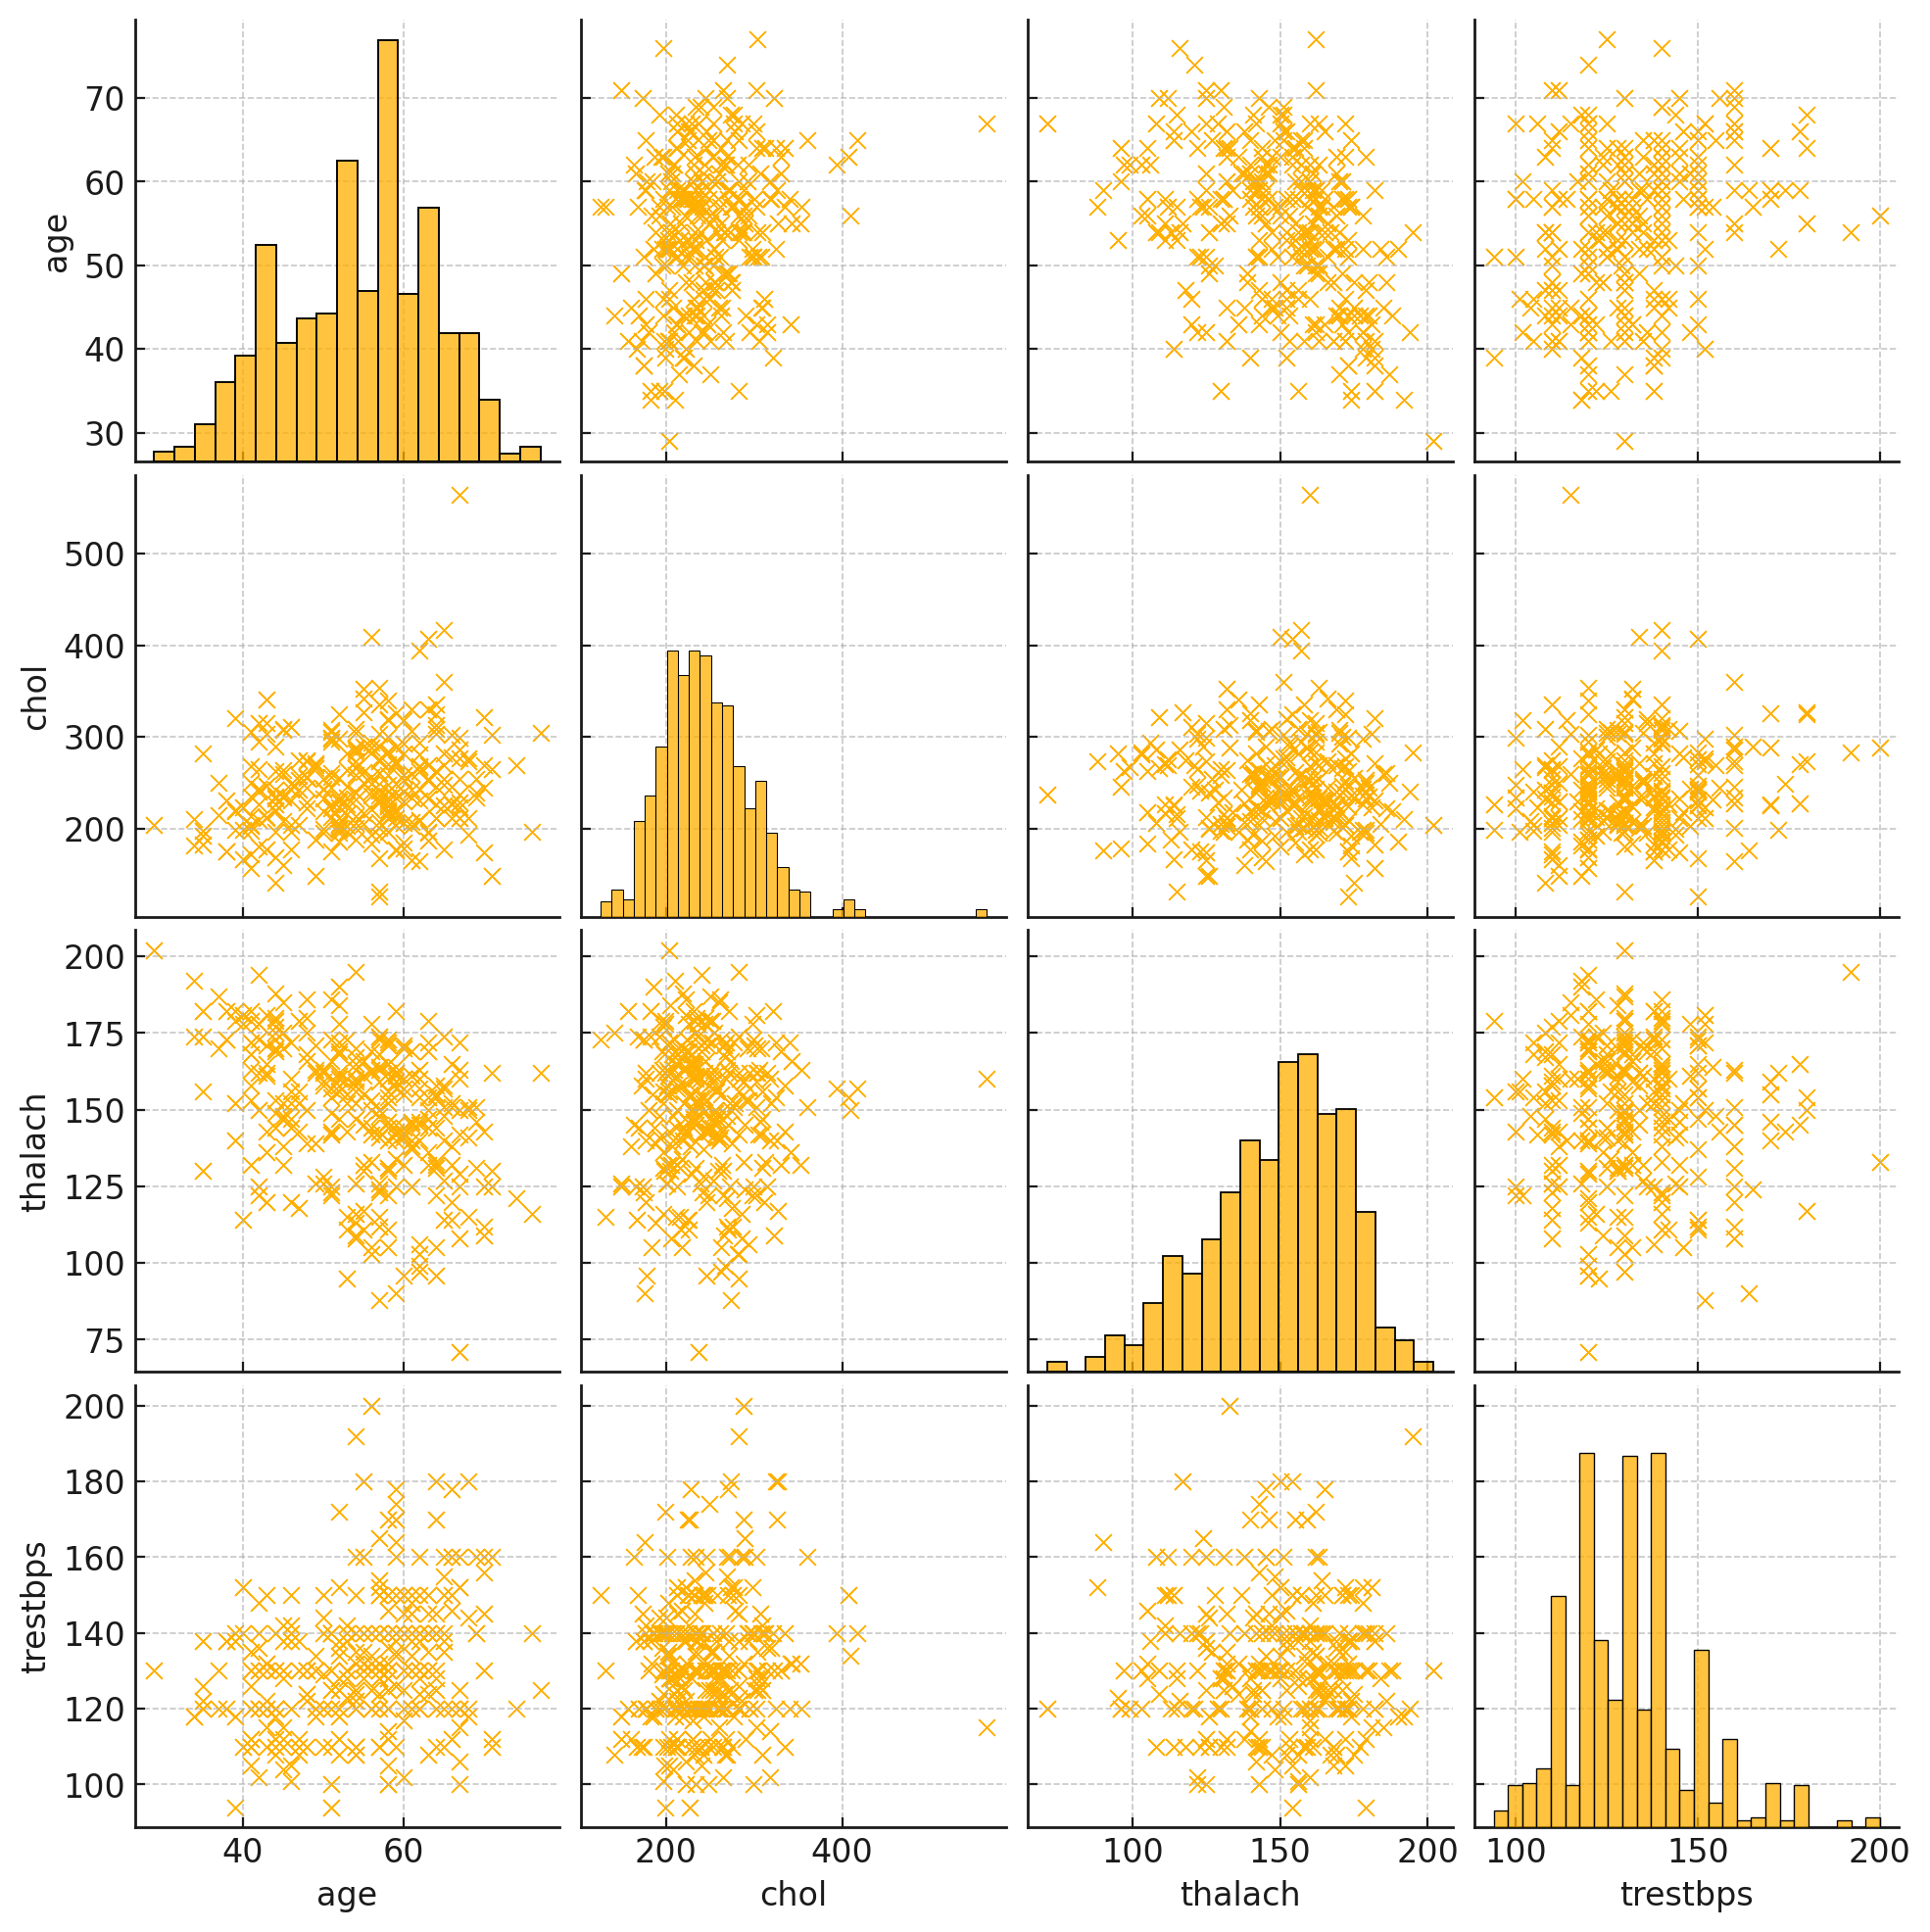
Figure 2. Paired scatterplot matrices
3.2. Correlation analysis
In order to find a more suitable model for heart disease prediction, a logistic regression model is also used in this article. Logistic regression is a statistical model for binary classification that predicts the probability of an outcome using one or more predictors. It's simple, interpretable, and efficient, making it ideal for small to medium-sized datasets. In heart disease prediction, it estimates the likelihood of disease based on clinical factors. At the same time, this paper also visualizes the prediction of the random forest model.
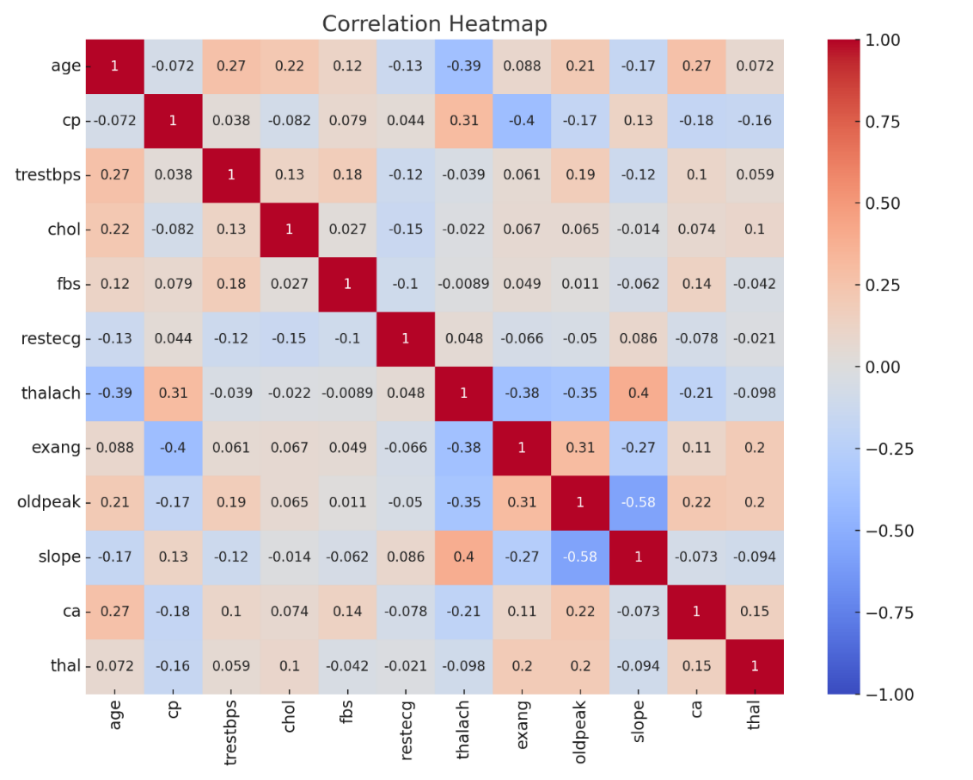
Figure 3. Correlation heatmap
Figure 3 displays correlation coefficients among different variables in the dataset, revealing a substantial negative correlation between \( {x_{1}} \) and \( {x_{8}} \) , evidenced by a correlation coefficient of -0.39, which suggests that maximum heart rate declines with increasing age. A mild positive correlation exists between age and \( {x_{4}} \) , indicated by a correlation coefficient of 0.28, implying a possible increase in resting blood pressure as age advances. The correlations between \( {x_{5}} \) and other variables are minimal. Additionally, there is a negative correlation between \( {x_{8}} \) and \( {x_{4}} \) , marked by a correlation coefficient of -0.27. Overall, apart from the pronounced negative correlation between age and maximum heart rate, connections among other variables are generally weak.
Table 2. Importance of features
feature | importance |
\( {x_{3}} \) | 0.135 |
\( {x_{12}} \) | 0.127 |
\( {x_{8}} \) | 0.122 |
\( {x_{10}} \) | 0.122 |
\( {x_{13}} \) | 0.111 |
\( {x_{1}} \) | 0.078 |
\( {x_{5}} \) | 0.075 |
\( {x_{4}} \) | 0.071 |
\( {x_{9}} \) | 0.057 |
\( {x_{11}} \) | 0.046 |
\( {x_{2}} \) | 0.029 |
\( {x_{7}} \) | 0.019 |
\( {x_{6}} \) | 0.008 |
It is easy to see that Table 2 has ranked the importance of heart disease predictions according to the factors, and visualized them to make it easier for readers to observe the predictions.
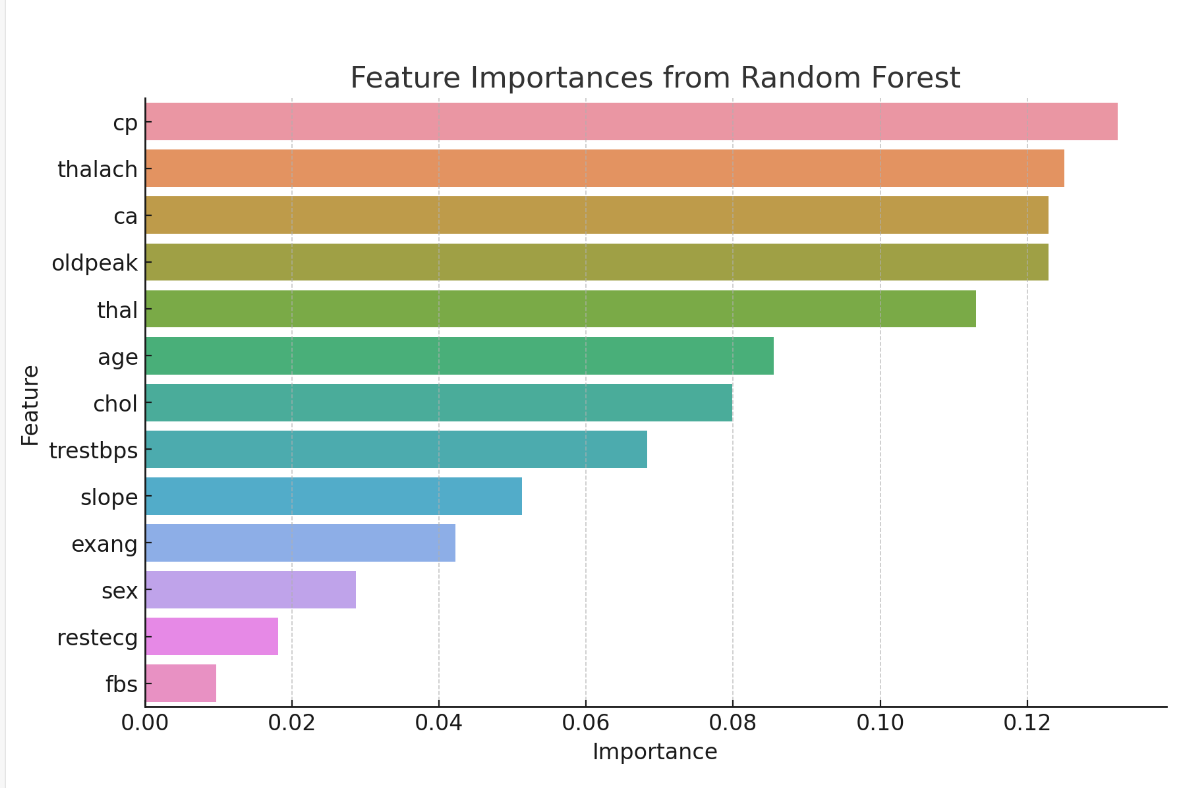
Figure 4. Feature importance from random forest
From Figure 4, it can be determined that \( {x_{3}} \) , \( {x_{8}} \) , \( {x_{12}} \) , \( {x_{10}} \) , and \( {x_{13}} \) are the main predictors of heart disease. These features are important in clinical evaluation and diagnosis. The \( {x_{3}} \) has a high positive correlation with heart disease, suggesting that a particular type of chest pain is a strong indication of an underlying heart problem. Other variables such as \( {x_{1}} \) , \( {x_{5}} \) , and \( {x_{4}} \) , although weakly correlated, still play a role in predictive models. These findings highlight the multifactorial nature of heart disease, with a combination of multiple clinical factors coming together to form an overall risk assessment.
3.3. Model results
To present the data more clearly, table 3 summarize the performance of the logistic regression:
Table 3. Logistic Regression Model Results
Metric | No Heart Disease (Class 0) | Heart Disease (Class 1) | Overall |
Precision | 0.85 | 0.74 | |
Recall | 0.74 | 0.87 | |
F1-Score | 0.79 | 0.81 | |
Correctly Predicted Instances | 117 | 129 | |
Misclassified Instances | 42 | 20 | |
Accuracy | 80% |
The logistic regression model exhibited an 80% accuracy rate, displaying notable precision and recall in predicting heart disease. According to Table 3, 4, the model showed a remarkable overall accuracy of 98.54%. Specifically, it achieved a recall rate of 1.00 for the category indicating no heart disease (Category 0), accurately identifying all instances without heart disease. For the heart disease category (Category 1), the recall rate was 0.97, reflecting a minor misclassification of heart disease cases as non-heart disease. Precision scores were 0.97 for the no heart disease category and 1.00 for the heart disease category, demonstrating the model's accuracy in identifying positive heart disease cases. Both categories attained an F1-score of 0.99, highlighting a robust balance between precision and recall.
Table 4. Summary of random forest model prediction accuracy
precision | Recall | F1-score | support | |
0 | 0.97 | 1.00 | 0.99 | 102 |
1 | 1.00 | 0.97 | 0.99 | 103 |
accuracy | 0.99 | 205 | ||
macro avg | 0.99 | 0.99 | 0.99 | 205 |
weighted avg | 0.99 | 0.99 | 0.99 | 205 |
And this paper draws Figure 5, the confusion matrix offers detailed insights into the classification model's performance by displaying the actual versus predicted classifications:
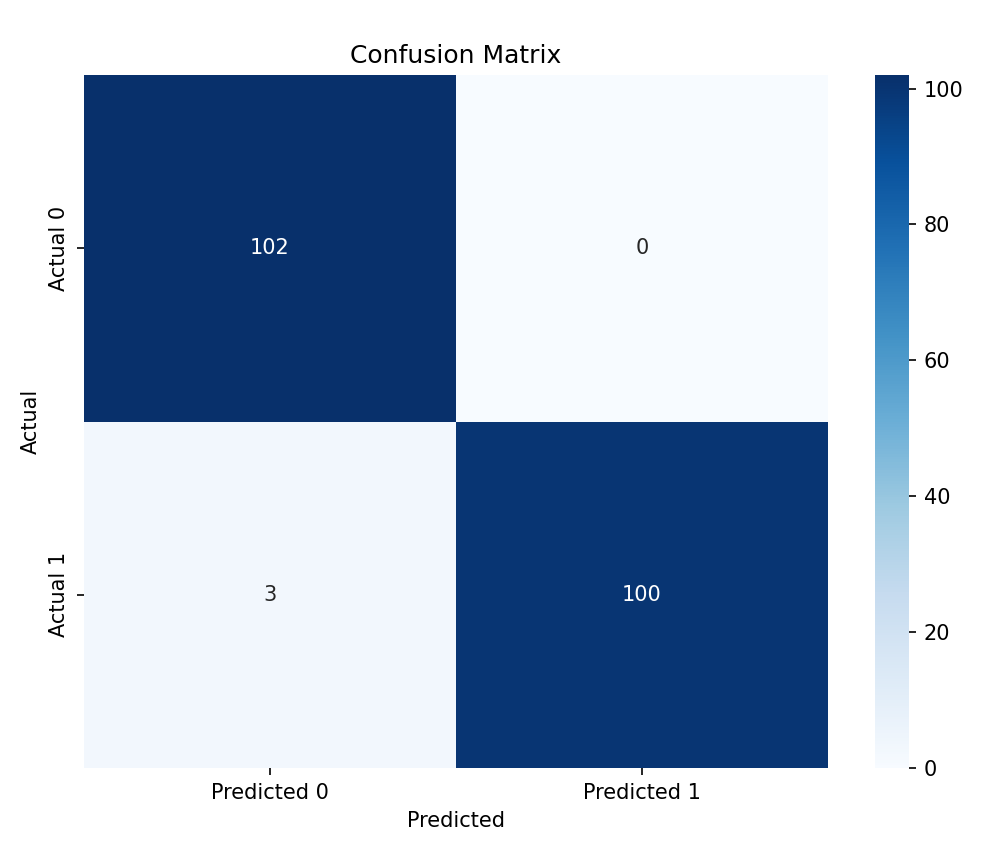
Figure 5. Confusion matrix
The confusion matrix further illustrated the actual versus predicted classifications, showing that the Random Forest model is highly effective and reliable in predicting heart disease. Feature importance analysis revealed that \( {x_{3}} \) , \( {x_{8}} \) , \( {x_{10}} \) , \( {x_{12}} \) , and \( {x_{13}} \) were the main predictors of heart disease. These results indicate that the Random Forest model can effectively identify and classify heart disease patients, providing a robust and reliable prediction mechanism with significant potential for clinical applications.
3.4. Discussion
This article also used a SVM Model to predict your dataset. To present the data more clearly, table5 summarize the performance of the SVM model:
The SVM model achieved 68% accuracy, with balanced precision and recall for both classes but lower overall performance compared to logistic regression. Given these evaluation metrics, the Random Forest model emerges as the most effective in predicting heart disease, achieving the highest scores in accuracy, precision, and F1 score, along with a high recall rate. Thus, the Random Forest model is advised as the best choice for heart disease prediction.
Compared to previous studies, this research used the Random Forest model to consider the combined impact of multiple factors on heart disease rather than focusing on single factors. This approach provides a more comprehensive and accurate risk assessment, helping medical professionals better understand and prevent heart disease.
Table 5. SVM Model Results
Metric | No Heart Disease (Class 0) | Heart Disease (Class 1) | Overall |
Precision | 0.71 | 0.65 | |
Recall | 0.63 | 0.72 | |
F1-Score | 0.67 | 0.68 | |
Correctly Predicted Instances | 100 | 108 | |
Misclassified Instances | 59 | 41 | |
Accuracy | 68% |
In conclusion, the application of the Random Forest model in this study not only identified various significant features affecting heart disease but also demonstrated the model's efficiency and accuracy in heart disease prediction. This provides valuable insights and guidance for future heart disease research and early detection.
4. Conclusion
The current study utilized a diverse dataset to investigate factors potentially associated with the development of heart disease. The findings suggest that heart disease may be linked to factors such as Chest Pain Type (cp), Maximum Heart Rate (thalach), Number of Major Vessels (ca), ST Depression (oldpeak), and Thalassemia (thal), many of which have been underemphasized in previous research.
Despite the study's limitations, such as a small dataset and the exclusion of all ages and ethnicities, which may impact accuracy, it still offers significant contributions. The innovative approach employed in this research involves a graphical analysis to visually compare factor proportions in populations with and without heart disease, making the results clearer and more intuitive. Furthermore, unlike previous studies focusing on single-factor analysis, this study used a Random Forest model for a more comprehensive analysis.
The study also holds positive implications for heart disease treatment. Beyond the established risk factors, other elements like Chest Pain Type, Maximum Heart Rate, Number of Major Vessels, ST Depression, and Thalassemia warrant attention and consideration. While further medical investigation is needed to confirm their association with heart disease, these findings can guide future research. Identifying new causative factors can aid in early detection and treatment of heart disease, thereby improving patient survival rates and quality of life.
In conclusion, this study not only highlighted several key features influencing heart disease but also demonstrated the Random Forest model's efficiency and accuracy in heart disease prediction. These insights offer valuable guidance for future research and early detection efforts.
References
[1]. Salari N, Faryadras F, Shohaimi S, et al. 2024 Global prevalence of congenital heart diseases in infants: A systematic review and meta-analysis. Journal of Neonatal Nursing.
[2]. Abughazaleh S, Obeidat O, Tarawneh M, et al. 2024 Trends of Hypertensive Heart Disease Prevalence and Mortality in the United States between the period 1990-2019, Global Burden of disease Database. Current Problems in Cardiology, 102621.
[3]. Chen Y, Wei Y and Tang W 2024 The role of hydrogen in the prevention and treatment of coronary atherosclerotic heart disease. European Journal of Pharmacology, 176586.
[4]. Vora N, Patel P, Gajjar A, et al. 2023 Gene therapy for heart failure: A novel treatment for the age old disease. Disease-a-Month, 101636.
[5]. Islam M A, Majumder M Z H, Miah M S, et al. 2024 Precision healthcare: A deep dive into machine learning algorithms and feature selection strategies for accurate heart disease prediction. Computers in Biology and Medicine, 176, 108432.
[6]. Mesquita F and Marques G 2024 An explainable machine learning approach for automated medical decision support of heart disease. Data & Knowledge Engineering, 102339.
[7]. Chen L, Ji P, Ma Y, et al. 2023 Custom machine learning algorithm for large-scale disease screening-taking heart disease data as an example. Artificial Intelligence in Medicine, 146, 102688.
[8]. Ghasemieh A, Lloyed A, Bahrami P, et al. 2023 A novel machine learning model with Stacking Ensemble Learner for predicting emergency readmission of heart-disease patients. Decision Analytics Journal, 7, 100242.
[9]. Chang V, Bhavani V R, Xu A Q, et al. 2022 An artificial intelligence model for heart disease detection using machine learning algorithms. Healthcare Analytics, 2, 100016.
[10]. Sun H and Pan J 2023 Heart disease prediction using machine learning algorithms with self-measurable physical condition indicators. Journal of data analysis and information processing, 11(1), 1-10.
Cite this article
Wang,W. (2024). Heart disease prediction using machine learning models . Theoretical and Natural Science,51,9-17.
Data availability
The datasets used and/or analyzed during the current study will be available from the authors upon reasonable request.
Disclaimer/Publisher's Note
The statements, opinions and data contained in all publications are solely those of the individual author(s) and contributor(s) and not of EWA Publishing and/or the editor(s). EWA Publishing and/or the editor(s) disclaim responsibility for any injury to people or property resulting from any ideas, methods, instructions or products referred to in the content.
About volume
Volume title: Proceedings of CONF-MPCS 2024 Workshop: Quantum Machine Learning: Bridging Quantum Physics and Computational Simulations
© 2024 by the author(s). Licensee EWA Publishing, Oxford, UK. This article is an open access article distributed under the terms and
conditions of the Creative Commons Attribution (CC BY) license. Authors who
publish this series agree to the following terms:
1. Authors retain copyright and grant the series right of first publication with the work simultaneously licensed under a Creative Commons
Attribution License that allows others to share the work with an acknowledgment of the work's authorship and initial publication in this
series.
2. Authors are able to enter into separate, additional contractual arrangements for the non-exclusive distribution of the series's published
version of the work (e.g., post it to an institutional repository or publish it in a book), with an acknowledgment of its initial
publication in this series.
3. Authors are permitted and encouraged to post their work online (e.g., in institutional repositories or on their website) prior to and
during the submission process, as it can lead to productive exchanges, as well as earlier and greater citation of published work (See
Open access policy for details).
References
[1]. Salari N, Faryadras F, Shohaimi S, et al. 2024 Global prevalence of congenital heart diseases in infants: A systematic review and meta-analysis. Journal of Neonatal Nursing.
[2]. Abughazaleh S, Obeidat O, Tarawneh M, et al. 2024 Trends of Hypertensive Heart Disease Prevalence and Mortality in the United States between the period 1990-2019, Global Burden of disease Database. Current Problems in Cardiology, 102621.
[3]. Chen Y, Wei Y and Tang W 2024 The role of hydrogen in the prevention and treatment of coronary atherosclerotic heart disease. European Journal of Pharmacology, 176586.
[4]. Vora N, Patel P, Gajjar A, et al. 2023 Gene therapy for heart failure: A novel treatment for the age old disease. Disease-a-Month, 101636.
[5]. Islam M A, Majumder M Z H, Miah M S, et al. 2024 Precision healthcare: A deep dive into machine learning algorithms and feature selection strategies for accurate heart disease prediction. Computers in Biology and Medicine, 176, 108432.
[6]. Mesquita F and Marques G 2024 An explainable machine learning approach for automated medical decision support of heart disease. Data & Knowledge Engineering, 102339.
[7]. Chen L, Ji P, Ma Y, et al. 2023 Custom machine learning algorithm for large-scale disease screening-taking heart disease data as an example. Artificial Intelligence in Medicine, 146, 102688.
[8]. Ghasemieh A, Lloyed A, Bahrami P, et al. 2023 A novel machine learning model with Stacking Ensemble Learner for predicting emergency readmission of heart-disease patients. Decision Analytics Journal, 7, 100242.
[9]. Chang V, Bhavani V R, Xu A Q, et al. 2022 An artificial intelligence model for heart disease detection using machine learning algorithms. Healthcare Analytics, 2, 100016.
[10]. Sun H and Pan J 2023 Heart disease prediction using machine learning algorithms with self-measurable physical condition indicators. Journal of data analysis and information processing, 11(1), 1-10.