


1. Introduction
Employee factors are an important indicator of employee mobility, such as career development expectations, job satisfaction, monthly working hours, bonuses, wages, and project participation. Comparing good and bad employee turnover avoidable and unavoidable an important way for companies to analyze the total number of people leaving each year. Employee turnover should be compartmentalized "like marketing segments and customers" [1]. In addition, Guo et al. used hypothesis research, benchmark regression, and heterogeneity test to study the impact of employee annuity on employee mobility. It is concluded that enterprise annuity (only state-owned enterprises) can increase employee inflow and reduce employee outflow [2].
Yan analyzed the impact of employee satisfaction on the turnover rate, the process, and the way of impact, which is of great significance [3]. In addition, Deng mentioned Kennedy and Fulford in the summary of foreign scholars on reducing employee turnover and believed that the factors affecting employee turnover include obvious factors and inconspicuous factors, including employee indicators to be analyzed in depth in this paper [4]. In addition, Li used SPSS software for statistical analysis to explore the influencing factors of hotel staff turnover, and the factor analysis and correlation coefficient analysis also provided help for the research of this paper [5]. In addition, the conclusions of previous scholars' surveys on employee turnover rates cannot be ignored, Carey believed that low employee participation was the biggest factor affecting high employee turnover rate in the practical survey of employee turnover rate [6], Lou believed that enterprises provide competitive salary would bring high employee satisfaction, and promoted the link between salary and performance rating [7]. Li believed that knowledge employees would greatly reduce their satisfaction if the salary they receive did not match the value they create [8]. In addition, Wan established a data analysis framework that believed that work performance was significantly related to employee mobility, and enterprises should treat high-performance employees well and reduce the possibility of high-performance employee turnover [9].
The purpose of this article is to explore the possible influencing factors of employee mobility and try to provide some effective management strategies for enterprises to reduce the potential negative impact of employee mobility on enterprises. First of all, this paper preliminarily displays and processes employee data and uses it as the data basis for subsequent analysis. Next, this paper will use SPSS correlation analysis and regression models to identify key factors. Finally, based on the results of the research, this paper will provide some actionable recommendations on how to maintain a stable workforce.
2. Methodology
2.1. Data Source and Description
A data set of employees who left a large United States company between 2016 and 2020 (the company did not name it for privacy reasons) was used. Management is concerned about the relatively high turnover rate. They want to understand some of the factors that influence employee turnover to find ways to reduce the number of employees leaving their jobs, and to have a better understanding of what's going on, which employees are more likely to leave, and why. The company's human resources department collected data on nearly 10,000 employees who left the company between 2016 and 2020. They used information from exit interviews, performance reviews, and employee records.
Table 1. Data Description
Variable | min | max | average | Standard deviation | median |
department | 1 | 10 | 6.42 | 2.63 | 7 |
promoted | 0 | 1 | 0.03 | 0.171 | 0 |
review | 0.31 | 1 | 0.652 | 0.085 | 0.647 |
projects | 2 | 5 | 3.275 | 0.579 | 3 |
salary | 1 | 3 | 2.531 | 0.757 | 3 |
tenure | 2 | 12 | 6.556 | 1.415 | 7 |
satisfaction | 0 | 1 | 0.505 | 0.159 | 0.501 |
bonus | 0 | 1 | 0.212 | 0.409 | 0 |
avg_hrs_month | 171.3 | 200.862 | 184.662 | 4.145 | 184.629 |
left | 0 | 1 | 0.292 | 0.455 | 0 |
Employee promotion, the comprehensive score of the employee's last rating, the number of projects the employee participated in, salary, tenure, satisfaction, bonus and the average monthly working hours of the employee were selected as the independent variables X to study the impact on employee retention and turnover Y.
2.2. Research Methods
Firstly, the descriptive statistical analysis of the data was carried out, the preliminary characteristics of the data were analyzed, the visual images of each variable were constructed based on the analysis. Then the correlation analysis was used to detect the correlation between variable X and employee retention and sanity Y and the correlation between each variable X. The incoherent variables were excluded, the rationality of the coherent variables was expounded, and finally the linear regression model was used to analyze the regression correlation between the relevant variables and the Y value (correlation coefficient). The conclusions were drawn and the rationality was elaborated.
3. Results and Discussion
3.1. Descriptive Analysis
Figure 1 is the image of X and Y normally distributed in the visual image composition, the variables fluctuate strongly in the 185-190 range, so after the preliminary analysis of the experiment, it is believed that the employee turnover rate can be preliminarily investigated in terms of the average monthly working hours of employees.
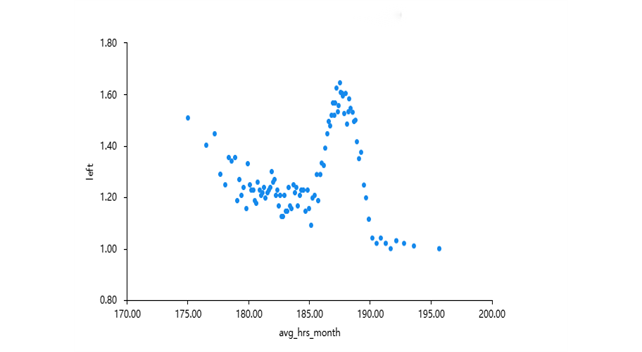
Figure 1. Left and avg_hrs_months scatter plot
Figure 2 is the image of X and Y normally distributed in the visual image composition, the variable and the dependent variable appear to rise regularly, so after the preliminary analysis of the experiment, it is believed that the employee turnover rate can be preliminarily investigated in terms of the review of employees.
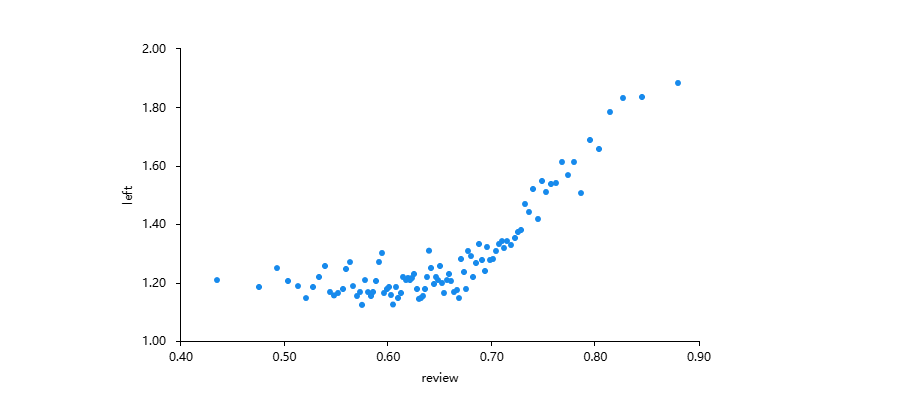
Figure 2. Left and review scatter plot
Figure 3 is the image of X and Y histogram, so after the preliminary analysis of the experiment, it is believed that the employee turnover rate can be preliminarily investigated in terms of the satisfaction of employees.
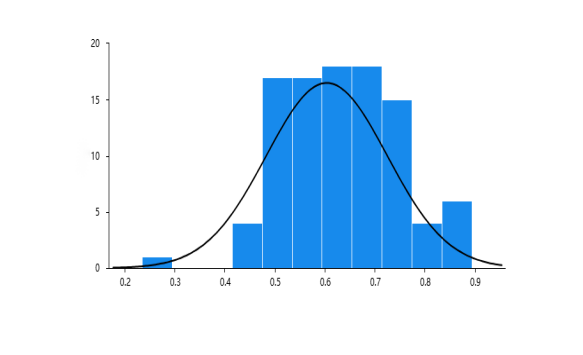
Figure 3. Left and satisfaction histogram
Figure 4 is the image of X and Y histogram, so after the preliminary analysis of the experiment, it is believed that the employee turnover rate can be preliminarily investigated in terms of the tenure of employees.
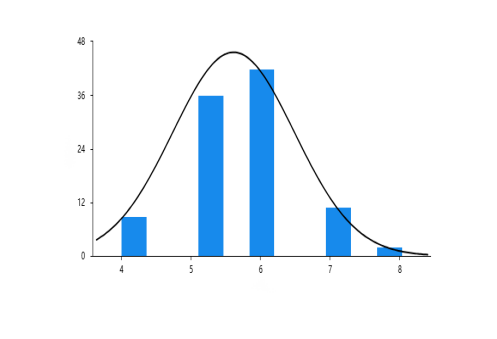
Figure 4. Left and tenure histogram
3.2. Correlation Analysis
Then the collinearity of variables is detected, with the VIF value> 10 as the standard of collinearity, from Table 2, there are two items (tenure, avg _ hrs _ month) corresponding to VIF value> 10, so these two items should be excluded in the regression analysis of the following.
Table 2. Collinear detection values
Name | VIF value | Tolerance |
department | 1.001 | 0.999 |
review | 1.382 | 0.723 |
promoted | 1.002 | 0.998 |
tenure | 23.7 | 0.042 |
salary | 1.001 | 0.999 |
bonus | 1 | 1 |
projects | 1.001 | 0.999 |
satisfaction | 1.224 | 0.817 |
avg_hrs_month | 23.844 | 0.042 |
left | 1.129 | 0.886 |
Table 3. Correlation coefficient
left | |
satisfaction | -0.016 |
salary | 0.01 |
bonus | -0.011 |
projects | -0.013 |
review | 0.286** |
promoted | -0.037** |
department | -0.001 |
* p<0.05 ** p<0.01 | |
The third step is to conduct correlation analysis of the data, and the correlation analysis between variable X and employee turnover rate Y and the correlation analysis between variable X and variable X should be explained first, and the correlation between the correlation coefficient P should be explained first, and the significance should be discussed on this basis, and X with a significant relationship with employee turnover rate Y should be judged to be positively or negatively correlated. Finally, the variables that were positively or negatively correlated with employee turnover rate Y and the data that were positively or negatively correlated with X variables were ranked significantly.
This paper studies the correlation between seven variables satisfaction, bonus, salary, promotion, review, projects, and department and employee turnover rate (Table 3). In view of the magnitude of the correlation coefficient between each variable and the independent variable, the comparison of the correlation coefficient between the Sperman correlation coefficient and the critical value is used to explain the explanation. -0.016 represents the correlation coefficient between satisfaction and left, which is close to the critical value of 0, and the magnitude of p is calculated to be 0.110, exceeding the critical value of 0.05, which indicates that the relationship between satisfaction and employee turnover rate is not significant.-0.011 represents the correlation coefficient between left and bonus, which is close to the critical value of 0, and the magnitude of p is calculated to be 0.262, which exceeds the critical value of 0.05, which indicates that the relationship between bonus and employee turnover left is not significant. 0.010 represents the correlation coefficient between left and salary, which is close to the critical value of 0, and the magnitude of p is calculated to be 0.308, which exceeds the critical value of 0.05, which indicates that the relationship between bonus and employee turnover rate left is not significant. The correlation coefficient between left and promoted was -0.037, and it was significant on the 0.01 standard, indicating that there was a significant negative correlation between left and promoted. The correlation coefficient between left and review was 0.286, and it showed a significant significance on the 0.01 standard, indicating that there was a significant positive correlation between left and review. The correlation coefficient between left and projects is -0.013, which tends to be close to 0, and the p-value of 0.221 exceeds the critical value of 0.05, so there is no correlation between left and projects. -0.001 represents the correlation coefficient between left and department, which is close to the critical value of 0, and the magnitude of p is calculated to be 0.916, which exceeds the critical value of 0.05, which indicates that the relationship between department and employee turnover rate left is not significant.
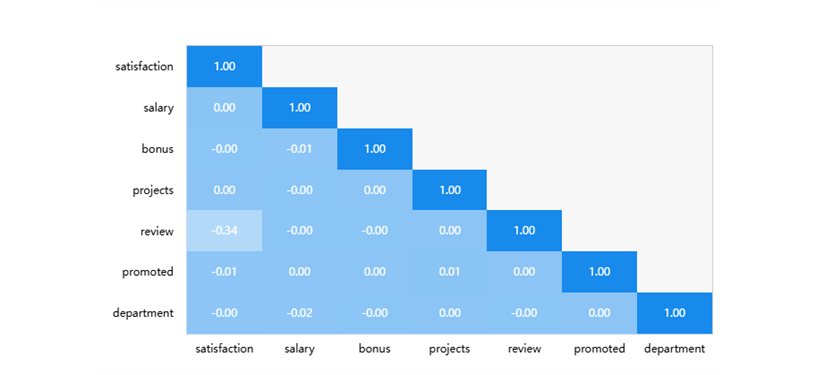
Figure 5. Correlation of each X variable
In addition, the correlation analysis between variable X and variable X can be presented in the form of graphs, as can be seen from Figure 5, the correlation analysis is used to study the correlation between the six items of satisfaction, salary, bonus, projects, review, promoted, and department, and the S correlation coefficient is used to represent the strength of the correlation relationship. It can be seen from the figure that all the items of satisfaction and review are significant, and the correlation coefficient values are -0.343, respectively, and all of them are less than 0, which means that there is a negative correlation between satisfaction and one item of review. At the same time, there was no significant relationship between satisfaction and salary, bonus, projects, promoted, department, and the correlation coefficient value was close to 0, indicating that there was no correlation between satisfaction and 5 items of 0.005, -0.001, 0.002, -0.008, and -0.005.
3.3. Model Results
According to the correlation conclusion, it can be seen that the variables that have a greater impact on employee mobility are as follows review, promoted, department, projects, salary, bonus, satisfaction (Table 4). Therefore, a regression model of employee turnover rate and these variables was constructed.
\( \begin{array}{c} left=-1.035 + 1.826*review-0.096*promoted + 0.000*department \\ -0.010*projects + 0.006*salary + 0.315*satisfaction-0.011*bonus \ \ \ (1) \end{array} \)
Table 4. Regression coefficients
t | p | 95% CI | VIF | |
constant | -19.318 | 0.000 | -1.140 ~ -0.930 | - |
review | 33.132 | 0.000 | 1.718 ~ 1.934 | 1.139 |
promoted | -3.717 | 0.000 | -0.146 ~ -0.045 | 1 |
department | 0.008 | 0.994 | -0.003 ~ 0.003 | 1 |
projects | -1.279 | 0.201 | -0.025 ~ 0.005 | 1 |
salary | 0.976 | 0.329 | -0.006 ~ 0.017 | 1 |
satisfaction | 10.606 | 0.000 | 0.256 ~ 0.373 | 1.14 |
bonus | -1.05 | 0.294 | -0.032 ~ 0.010 | 1 |
The regression coefficient value of the variable promoted is -0.096, its t-value is -3.717, and the p-value is 0.000 and less than 0.01, indicating that the variable promoted has a significant negative impact on the left. The regression coefficient value of the variable department is 0.000, its t-value is 0.008, and the p-value is 0.994 and is greater than 0.05, indicating that there is no relationship between the variable department and left. -0.010 is the regression degree of the variable projects, -1.279is the size of t, and the size of p is 0.201, which exceeds the critical value of 0.05, indicating that the influence of the variable projects on the left of employee turnover rate tends to be close to 0.The regression coefficient value of the variable salary was 0.006, its t-value was 0.976, and the p-value was 0.329 and greater than 0.05, indicating that there was no relationship between the variable salary and left. The regression coefficient of satisfaction is 0.315, the t-value is 10.606, and the p-value is 0.000 and less than 0.01, indicating that the variable satisfaction has a significant positive impact on the left. -0.011 is the regression degree of the variable bonus, -1.050 is the size of t, and the size of p is 0.294, which exceeds the critical value of 0.05, indicating that the influence of the variable bonus on the left of employee turnover rate tends to be close to 0.
3.4. Discussion
Table 4 shows that review and satisfaction have a significant positive impact on left. and promoted will have a significant negative effect on left. However, department, projects, salary, and bonus do not affect the left, which means that review, promoted, department, projects, salary, satisfaction, and bonus can explain the 10.5% change in left. When the model is tested F, it is found that the model passes the F test (the p-value is less than 0.05), that is, at least one of review, promoted, department, projects, salary, satisfaction, and bonus will have an impact on left (0.000<0.05), that is, it means that the model construction is meaningful. Based on the results of this study, it is concluded that: First, employees' performance scores are positively correlated with turnover rates, which may indicate that high-performing employees are more likely to seek new opportunities. Second, the lack of promotion opportunities increases the risk of employee turnover. Third, the positive correlation between employee satisfaction and turnover rate needs to be further explored. The author recommends that companies should provide more development opportunities and incentives for high-performing employees, then establish a clear promotion path, gain an in-depth understanding of the factors that affect employee satisfaction and take appropriate measures to improve satisfaction [10].
4. Conclusion
This paper believes that enterprises should pay more attention to the comprehensive score of the last employee index, the employee satisfaction and the promotion of the employee turnover rate, and analyze it together according to other influencing factors of different degrees. This study also provides valuable insights into the influencing factors of employee mobility, but there are still some limitations. Future research directions may include expanding the sample to include data from more industries and regions. Introduce more variables that may affect employee mobility, such as work pressure, team fit, etc. A longitudinal study design was adopted to track long-term trends in employee mobility. Delve into the complex relationship between satisfaction and turnover rates. Incorporate qualitative research methods, such as in-depth interviews, to gain richer insights.
References
[1]. Fox, A. (2012) How to reduce employee turnover. United States human resources.
[2]. Guo, L., Wei, L.J., Tian, X.L. (2022) An empirical study on the impact of enterprise annuity on employee mobility.Journal of Guchou Business School, 35(3).
[3]. Yan, J. (2008) Correlation between Employee Satisfaction and Turnover Rate. Human Resource Management.
[4]. Deng, G.Z. (2001) Foreign scholars discuss reducing employee turnover. Foreign Economics and Management, 23(6).
[5]. Li, D.S. (2023) Research on the Turnover Law and Influencing Factors of High-end Hotel Staff in Changsha-Zhuchou-Zhuchou-Tan Area. Enterprise Herald.
[6]. Carey, E . (2012) Five Ways to Solve the High Turnover Rate of Employees. Human Resource Management, 6.
[7]. Lou, C.H. (2007) Retention Policy of Enterprises with High Employee Turnover Rate. Modern Business, 17.
[8]. Li, Y. (2013) Factors influencing the turnover rate of knowledge workers and suggestions for improvement. Enterprise Herald, 14.
[9]. Wan, Y. (2008) Analysis of Employee Turnover Mechanism and Control Strategy in High-tech Enterprises. Beijing Jiaotong University Press.
[10]. Zhou, J. and Ma, S.P. (2024) Research Data Analysis Methods and Applications. House of Electronics Industry .
Cite this article
Mou,R. (2024). Analysis of the Impact of Employees' Own Indicators on Employee Mobility. Theoretical and Natural Science,51,18-25.
Data availability
The datasets used and/or analyzed during the current study will be available from the authors upon reasonable request.
Disclaimer/Publisher's Note
The statements, opinions and data contained in all publications are solely those of the individual author(s) and contributor(s) and not of EWA Publishing and/or the editor(s). EWA Publishing and/or the editor(s) disclaim responsibility for any injury to people or property resulting from any ideas, methods, instructions or products referred to in the content.
About volume
Volume title: Proceedings of CONF-MPCS 2024 Workshop: Quantum Machine Learning: Bridging Quantum Physics and Computational Simulations
© 2024 by the author(s). Licensee EWA Publishing, Oxford, UK. This article is an open access article distributed under the terms and
conditions of the Creative Commons Attribution (CC BY) license. Authors who
publish this series agree to the following terms:
1. Authors retain copyright and grant the series right of first publication with the work simultaneously licensed under a Creative Commons
Attribution License that allows others to share the work with an acknowledgment of the work's authorship and initial publication in this
series.
2. Authors are able to enter into separate, additional contractual arrangements for the non-exclusive distribution of the series's published
version of the work (e.g., post it to an institutional repository or publish it in a book), with an acknowledgment of its initial
publication in this series.
3. Authors are permitted and encouraged to post their work online (e.g., in institutional repositories or on their website) prior to and
during the submission process, as it can lead to productive exchanges, as well as earlier and greater citation of published work (See
Open access policy for details).
References
[1]. Fox, A. (2012) How to reduce employee turnover. United States human resources.
[2]. Guo, L., Wei, L.J., Tian, X.L. (2022) An empirical study on the impact of enterprise annuity on employee mobility.Journal of Guchou Business School, 35(3).
[3]. Yan, J. (2008) Correlation between Employee Satisfaction and Turnover Rate. Human Resource Management.
[4]. Deng, G.Z. (2001) Foreign scholars discuss reducing employee turnover. Foreign Economics and Management, 23(6).
[5]. Li, D.S. (2023) Research on the Turnover Law and Influencing Factors of High-end Hotel Staff in Changsha-Zhuchou-Zhuchou-Tan Area. Enterprise Herald.
[6]. Carey, E . (2012) Five Ways to Solve the High Turnover Rate of Employees. Human Resource Management, 6.
[7]. Lou, C.H. (2007) Retention Policy of Enterprises with High Employee Turnover Rate. Modern Business, 17.
[8]. Li, Y. (2013) Factors influencing the turnover rate of knowledge workers and suggestions for improvement. Enterprise Herald, 14.
[9]. Wan, Y. (2008) Analysis of Employee Turnover Mechanism and Control Strategy in High-tech Enterprises. Beijing Jiaotong University Press.
[10]. Zhou, J. and Ma, S.P. (2024) Research Data Analysis Methods and Applications. House of Electronics Industry .