


1. Introduction
China's labor market has encountered tremendous transformation in recent years due to the country's rapid economic expansion and fluctuations, which has brought both opportunities and challenges. As a critical exponent of national statistics, the unemployment rate can reveal the health and stability of the labor market and even economic dynamics. Low employment rates can reflect a robust and growing economy where businesses are thriving and creating jobs, while high rates may indicate financial stress and directly impact the standard of living, causing reduced household incomes, increased poverty rates, and lower consumer spending. According to the Okun's Law, a 1% increase in unemployment rate will typically be associated with a 2% decline in gross domestic product (GDP). Hjazeen et al. confirmed the law by claiming a negative relationship between the economic growth and unemployment in Jordan [1]. In addition, Soylu et al. concluded that unemployment rates are negatively affected by economic growth in Eastern European countries [2]. Given the effective performance of unemployment as an economic indicator, it is essential for policymakers and economists to predict and interpret unemployment rates in order to implement targeted strategies that can foster economic growth. Therefore, the purpose of this paper is to forecast China’s urban unemployment rate and contribute to economic planning.
Many scholars have made significant efforts to obtain accurate unemployment rate forecasts. In previous studies, various time series models and specific techniques have been applied and evaluated to ensure the precision of the prediction. The data of unemployment rates is typically non-stationary with trends, seasonality, and cyclic patterns, showing regular fluctuations due to seasonal factors and economic cycles. Moreover, autocorrelation is often present in the unemployment time series, where previous values can affect future rates. Since the autoregressive integrated moving average (ARIMA) model is a standard time series method that can counter non-stationarity by using autoregression and the technique of differencing to stabilize the time series, it is widely applied to forecast unemployment rates. Didiharyono et al. employed the ARIMA model to predict open unemployment rates in South Sulawesi [3]. Gostkowski et al. compared the predictive performance of the ARIMA model with the naive method, the quadratic trend model, the Holt’s model, and the winters model. The examination is based on the data collected by the Central Statistical Office in 2008-2018, divided into training and test parts. The result indicates that the ARIMA model is less reliable in forecast accuracy than the multiplicative Winters model and the model with a quadratic trend [4].
In order to further improve the effectiveness of the ARIMA model, specific models are incorporated to develop a hybrid procedure. Chakraborty et al. applied the autoregressive neural network (ARNN) model to capture the nonlinear trend by analyzing residuals from the ARIMA model and propose a ‘hybrid ARIMA-ARNN’ model. The result shows that the hybrid model outperforms all the individual models in predicting seven data sets from different nations [5]. Ahmad et al. also found that the hybrid ARIMA-ARNN forecasting model performed well for unemployment forecasts [6]. Extensions of the ARIMA model such as seasonal ARIMA (SARIMA) and fractional ARIMA (FARIMA) models are also focuses of unemployment forecast researches. Będowska-Sójka stated that the SARIMA model can produce forecasts that are as accurate as, or even superior to, those generated by unobserved component models [7]. Dritsaki provided insights into the application of the SARIMA model in predicting unemployment rates of Greece and found that the model is suitable to forecast future unemployment in Greece [8]. Dritsakis et al. combined the SARIMA model with the generalized autoregressive conditional heterokcedastic (GARCH) model and concluded the combined model is appropriate for projecting future US unemployment [9]. Moreover, Katris illustrated FARIMA models found to be the favorable approach among for the one step ahead forecasts of 22 countries [10].
Considering the overall favorable performance of the ARIMA model in predicting unemployment across different countries and periods, this paper aims to shed light on the application of the ARIMA model in forecasting China’s urban unemployment rate for 2025.
2. Methodology
2.1. Data source
The dataset used in this paper is collected from the National Bureau of Statistics of China, recording the surveyed urban unemployment rate of China. This dataset contains quarterly data spanning from September 2002 to December 2017 and monthly data from January 2018 to June 2024, with a total of 140 observations.
2.2. Variable selection
The surveyed urban unemployment measures the percentage of the labor force in urban areas that is unemployed but actively looking for work. Urban areas are typically the economic hubs of a country, housing the majority of industries, services, and businesses. As such, fluctuations in urban unemployment can significantly influence the overall unemployment rate. Monitoring the urban unemployment rate can provide early signals of broader economic trends.
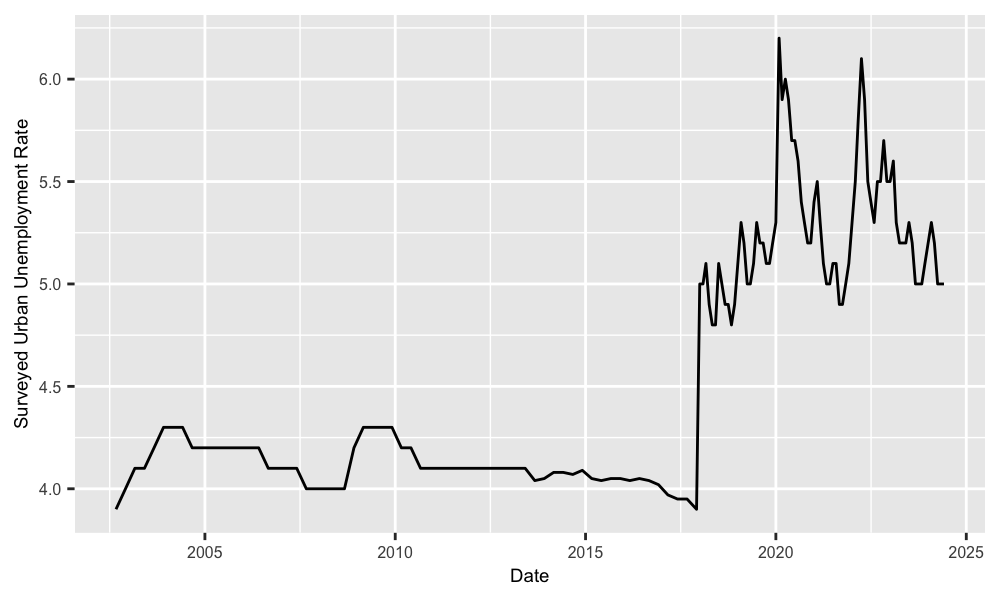
Figure 1. The time series of surveyed urban unemployment rates of China introduction.
Over the past two decades, the urban unemployment rate has experienced significant changes due to various economic events and trends. Figure 1 shows that the early 2000s witnessed a mild recession, primarily influenced by the collapse of the dot-com bubble. The urban unemployment rate increased during this period, peaking in March 2004. The period of 2005 to 2008 underwent robust economic growth driven by technological advancements, increased consumer spending, and a booming housing market. Throughout this time, the unemployment rate steadily decreased, reaching the lowest level of 4.3% by September 2007. The Great Recession, a financial crisis in 2008, led to a severe economic downturn, during which the unemployment rate sharply increased. Following the recession, the economy entered a prolonged recovery phase characterized by gradual improvements in GDP, employment, and consumer confidence. The unemployment rate steadily declined over this period, reaching historic lows of 3.9% by December 2017. Then the outbreak of COVID-19 happened in late 2019, causing unprecedented economic disruption, widespread business closures, and alarming job losses. The unemployment rate spiked dramatically in early 2020, and in April 2020, the rate reached 6%. Afterwards, the economy began to recover as the post-pandemic recuperation activities, such as vaccination rollouts, have contributed to economic stabilization. However, the unemployment rate has not yet returned to pre-pandemic levels and still shown cyclic behaviors until now.
2.3. Method introduction
As illustrated by figure 1, the time series of surveyed urban unemployment rate in China shows apparent trend and cycles, indicating high autocorrelation and non-stationarity. Given the high efficacy of the ARIMA model in processing and predicting non-stationary time series, this paper applies the ARIMA model to forecast the future urban unemployment rate. In particular, the ARIMA model combines three key components: an autoregressive (AR), integrated (I), and moving average (MA). The AR part indicates an autoregression model based on past observations. The component of I is used to stabilize the time series by differencing the raw observations, or specifically, subtracting consecutive observations. The MA component takes advantages of past forecast residuals. In summary, the ARIMA model can be mathematically represented as:
\( {y_{t}}=c+{φ_{1}}{y_{t-1}}+⋯+{φ_{p}}{y_{t-p}}+{θ_{1}}{ε_{t-1}}+⋯+{θ_{q}}{ε_{t-q}}+{ε_{t}}\ \ \ (1) \)
Where \( {y_{t}} \) is the differenced time series value at time t; c is a constant term; \( φ \) is the parameter of the AR part, while p is the order of the AR part. \( θ \) is the parameter of the MA part, while q is the order of the MA part. \( ε \) represents the error term.
3. Results and discussion
3.1. Data preparation
The data used for the ARIMA model forecasting is required to show stationarity. Because of the trend and cyclic patterns showcased in the urban unemployment rate time series, it is expected to be non-stationary. Furthermore, according to the autocorrelation function (ACF) plot in figure 2, all autocorrelation coefficients are outside the bounds, indicating significant autocorrelation. Since the autocorrelation decreases slowly, it is certain to conclude that the urban unemployment rate data exhibits non-stationarity. Therefore, the differencing is needed to stabilize the time series.
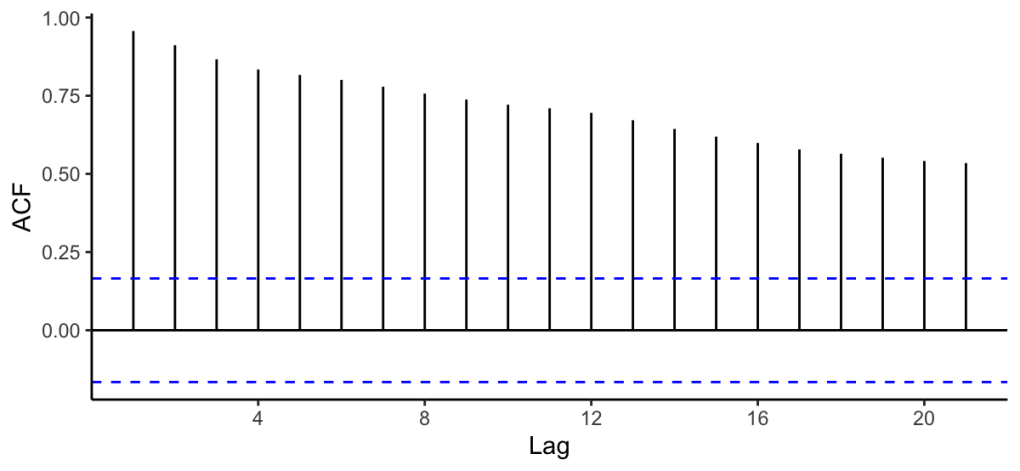
Figure 2. The ACF plot of the raw data
The first-order differencing, which involves computing the differences between consecutive observations, is conducted on the raw data. From the ACF and partial autocorrelation function (PACF) plots in figure 3 and figure 4, the differenced time series has satisfied the requirements. In addition, the result of Augmented Dickey-Fuller (ADF) test indicates a p-value significantly less than 0.01, which offers compelling evidence against the null hypothesis and conclude that the differenced data is stationary. Therefore, the differenced urban unemployment rate time series is qualified for the ARIMA model forecasting.
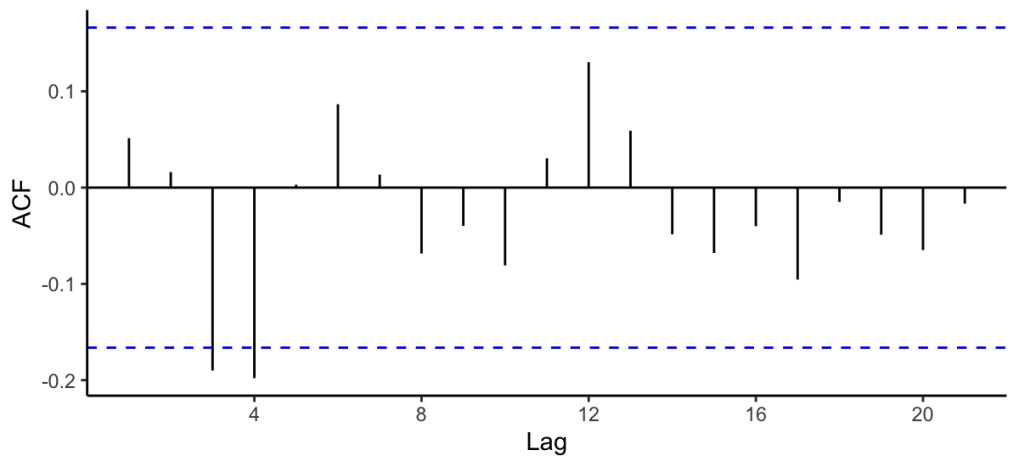
Figure 3. The ACF plot of the differenced data
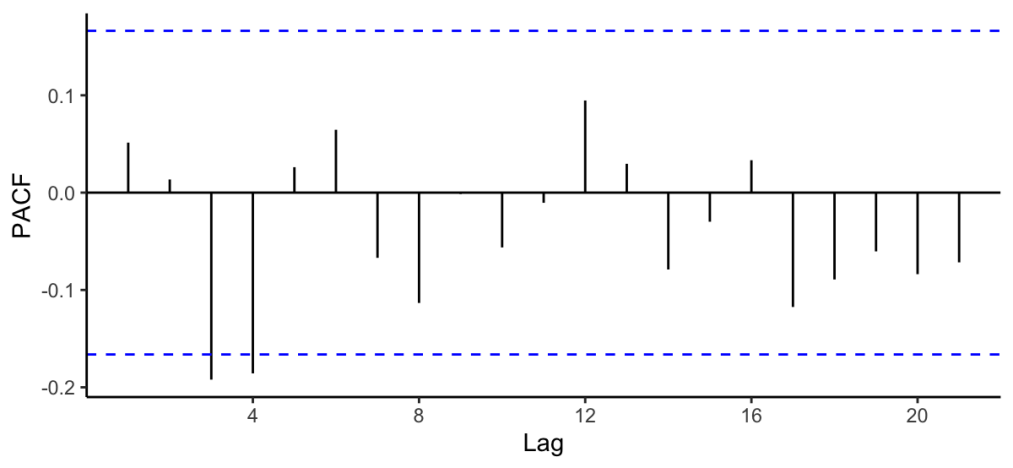
Figure 4. The PACF plot of the differenced data
3.2. Model results
There are various statistical techniques that can evaluate the performance of a model. This paper uses three estimators for model selection, which are Akaike information criterion (AIC), corrected Akaike information criterion (AICc), and Bayesian information criterion (BIC). AIC can identify the model that best explains the data with the least complexity, whereas AICc is an extended version of AIC, favoring small sample sizes to reduce the risk of overfitting. BIC is another model selection criterion, emphasizing model simplicity more strongly than AIC. Lower values of the three criteria indicate better models.
Table 1. The ARIMA models and corresponding values of estimators
ARIMA Model | AIC | AICc | BIC | (1,1,0) | -99.97 | -99.88 | -94.10 | (0,1,1) | -99.95 | -99.86 | -94.08 | (1,1,1) | -97.97 | -97.80 | -89.17 | (2,1,1) | -96.43 | -96.13 | -84.69 | (1,1,2) | -96.88 | -96.58 | -85.14 | (2,1,2) | -100.4 | -99.95 | -85.73 |
Table 1 demonstrates the ARIMA models with different orders and corresponding values of the three measures. Among the models being evaluated, ARIMA (2,1,2) shows the lowest value for both AIC and AICc and the second lowest value for BIC. Given that the model with lower values is better, ARIMA (2,1,2) is the most appropriate model based on the differenced data and has been selected to perform following forecast.
3.3. Check Residuals
In order to further validate the reliability of the selected ARIMA (2,1,2), this paper checks and analyzes the residuals that are the differences between the observations and the output of the model in this section. For a valid model which can satisfy assumptions and provide accurate predictions, the residuals are required to be white noise.
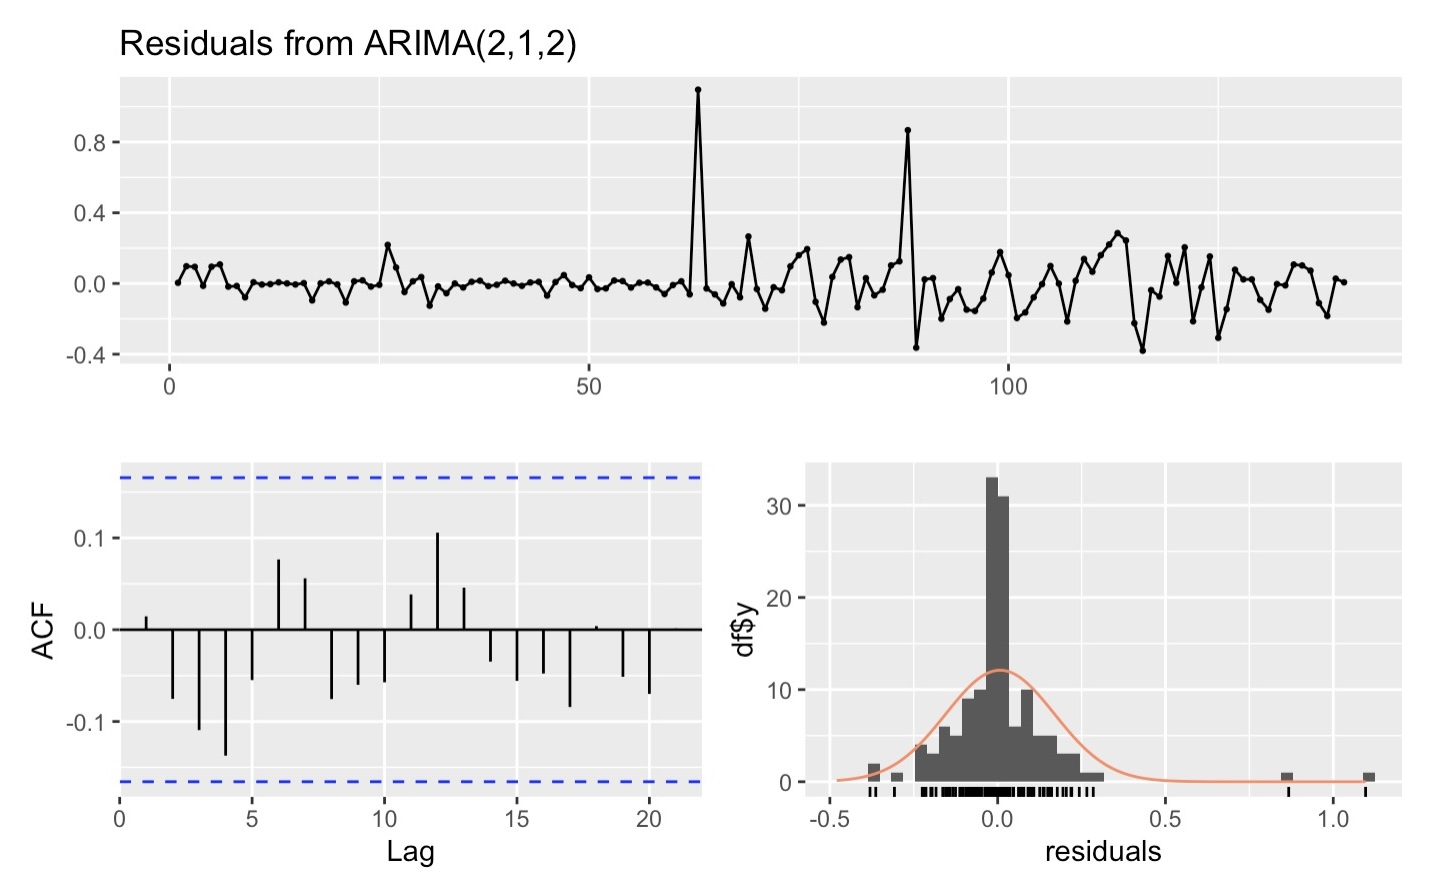
Figure 5. The time plot, ACF plot, and histogram of residuals
From the residual time plot of figure 5, the mean of the residuals is close to zero and the variation stays almost the same across the historical data. Therefore, the residual variance can be treated as constant. There is no significant autocorrelation in the ACF plot. Since all autocorrelation coefficients lie inside the bounds represented by two blue dotted lines, the residuals are confirmed to be white noise. The histogram suggests that the residuals follow a normal distribution. In addition, the p-value derived from the Ljung-Box test is 0.1715, which is greater than 0.05. Therefore, the null hypothesis that the residuals are white noise cannot be rejected, and this paper believes that ARIMA (2,1,2) is a reliable model.
3.4. Model Forecasting
The results of ARIMA are showcased in Table 2. According to the forecasting results, the urban unemployment rate of China will remain almost unchanged at the level of 5% in the next 18 months, with very slight fluctuations.
As demonstrated by the sections above, the selected ARIMA (2,1,2) model passes all diagnostic tests, indicating it is well-specified and appropriate for making accurate predictions based on the data. Nevertheless, some shortcomings still persist with the time series analysis. One of the limitations relates to the process of data preparation. Because of the lack of surveyed data, the dataset used by this paper combined the quarterly observations before 2018 with the monthly observations after 2018, which may cause mismatch in data frequencies and potential misalignment. In addition, 2018 marked a turning point for the unemployment rate, showing a dramatic change. The selected ARIMA(2,1,2) model incorporates the urban unemployment rate before and after this watershed in order to guarantee the integrity and explore the underlying patterns of the entire time series data. If the previous observations are not taken into account, the prediction results may achieve greater accuracy and better alignment with recent trends, but this comes at the expense of compromising overall completeness.
Table 2. The forecasting results of ARIMA (2,1,2)
Time | Point Forecast | L 80 | H 80 | L 95 | H 95 | 2024/07 | 5.026 | 4.815 | 5.238 | 4.703 | 5.349 | 2024/08 | 5.022 | 4.717 | 5.328 | 4.555 | 5.489 | 2024/09 | 5.005 | 4.610 | 5.401 | 4.401 | 5.610 | 2024/10 | 5.014 | 4.556 | 5.473 | 4.312 | 5.716 | 2024/11 | 5.023 | 4.515 | 5.531 | 4.246 | 5.800 | 2024/12 | 5.013 | 4.453 | 5.574 | 4.156 | 5.871 | 2025/01 | 5.011 | 4.401 | 5.621 | 4.079 | 5.943 | 2025/02 | 5.019 | 4.368 | 5.669 | 4.024 | 6.013 | 2025/03 | 5.018 | 4.328 | 5.707 | 3.963 | 6.072 | 2025/04 | 5.013 | 4.283 | 5.742 | 3.898 | 6.128 | 2025/05 | 5.015 | 4.250 | 5.780 | 3.849 | 6.186 | 2025/06 | 5.018 | 4.219 | 5.816 | 3.796 | 6.239 | 2025/07 | 5.015 | 4.183 | 5.847 | 3.743 | 6.287 | 2025/08 | 5.014 | 4.150 | 5.878 | 3.692 | 6.336 | 2025/09 | 5.016 | 4.122 | 5.911 | 3.648 | 6.384 | 2025/10 | 5.016 | 4.092 | 5.940 | 3.603 | 6.429 | 2025/11 | 5.015 | 4.062 | 5.968 | 3.557 | 6.472 | 2025/12 | 5.015 | 4.035 | 5.996 | 3.515 | 6.515 |
4. Conclusion
Throughout the time series analysis and model forecasting, this paper reaches the conclusion that the urban unemployment rate in China will remain around 5% over the next year, accompanied by subtle variations. Notably, as the predictive term extends, the prediction interval widens, and the accuracy of the forecasts tends to decrease.
Several comments and suggestions can be made based on these predictions. A 5% urban unemployment rate is generally considered low to moderate, reflecting an overall healthy market with some economic challenges but not a severe issue. This rate may be attributed to the proactive recovery efforts following the pandemic. However, 5% is still significantly higher than the historic average before the COVID-19 outbreak. Besides the overall minor improvements, the maintenance of the urban unemployment rate reveals structural issues such as market saturation, thus further government measures are needed. By addressing both pandemic and structural factors, governments can create a more resilient labor market, reduce unemployment, and promote sustainable employment opportunities. This not only manages the employment issues but also benefits economic stability and social harmony, improving the overall standard of living of the people.
References
[1]. Hjazeen H, Seraj M and Ozdeser H 2021 The nexus between the economic growth and unemployment in Jordan. Futur. Bus. J. 7 1-8
[2]. Soylu Ö B, Çakmak İ and Okur F 2018 Economic growth and unemployment issue: panel data analysis in Eastern European Countries. J. Int. Bus. Stud. 11 93-107
[3]. Didiharyono D and Syukri M 2020 Forecasting with ARIMA model in anticipating open unemployment rates in South Sulawesi. Int. J. Sci. Technol. Res. 9 3838-3841
[4]. Gostkowski M and Rokicki T 2021 Forecasting the unemployment rate: application of selected prediction methods. Eur. Res. Stud. 24 985-1000
[5]. Chakraborty T, Chakraborty A K, Biswas M, Banerjee S and Bhattacharya S 2021 Unemployment rate forecasting: a hybrid approach. Comput. Econ. 57 183-201
[6]. Ahmad M, Khan Y A, Jiang C, Kazmi S J H and Abbas S Z 2023 The impact of COVID-19 on unemployment rate: an intelligent based unemployment rate prediction in selected countries of Europe. Int J Fin Econ. 28 528-543
[7]. Będowska-Sójka B 2017 Unemployment rates forecasts: unobserved component models versus SARIMA models in Central and Eastern European countries. Comp. Econ. Res. 20 91-107
[8]. Dritsaki C 2016 Forecast of SARIMA models: an application to unemployment rates of Greece. Am. J. Appl. Math. Stat. 4 136-148
[9]. Dritsakis N and Klazoglou P 2018 Forecasting unemployment rates in USA using Box-Jenkins methodology. Int. J. Econ. Financ. Issues. 8 9
[10]. Katris C 2020 Prediction of unemployment rates with time series and machine learning techniques. Comput. Econ. 55 673-706
Cite this article
Jiang,X. (2024). Forecasting urban unemployment rate in China using ARIMA model. Theoretical and Natural Science,51,142-148.
Data availability
The datasets used and/or analyzed during the current study will be available from the authors upon reasonable request.
Disclaimer/Publisher's Note
The statements, opinions and data contained in all publications are solely those of the individual author(s) and contributor(s) and not of EWA Publishing and/or the editor(s). EWA Publishing and/or the editor(s) disclaim responsibility for any injury to people or property resulting from any ideas, methods, instructions or products referred to in the content.
About volume
Volume title: Proceedings of CONF-MPCS 2024 Workshop: Quantum Machine Learning: Bridging Quantum Physics and Computational Simulations
© 2024 by the author(s). Licensee EWA Publishing, Oxford, UK. This article is an open access article distributed under the terms and
conditions of the Creative Commons Attribution (CC BY) license. Authors who
publish this series agree to the following terms:
1. Authors retain copyright and grant the series right of first publication with the work simultaneously licensed under a Creative Commons
Attribution License that allows others to share the work with an acknowledgment of the work's authorship and initial publication in this
series.
2. Authors are able to enter into separate, additional contractual arrangements for the non-exclusive distribution of the series's published
version of the work (e.g., post it to an institutional repository or publish it in a book), with an acknowledgment of its initial
publication in this series.
3. Authors are permitted and encouraged to post their work online (e.g., in institutional repositories or on their website) prior to and
during the submission process, as it can lead to productive exchanges, as well as earlier and greater citation of published work (See
Open access policy for details).
References
[1]. Hjazeen H, Seraj M and Ozdeser H 2021 The nexus between the economic growth and unemployment in Jordan. Futur. Bus. J. 7 1-8
[2]. Soylu Ö B, Çakmak İ and Okur F 2018 Economic growth and unemployment issue: panel data analysis in Eastern European Countries. J. Int. Bus. Stud. 11 93-107
[3]. Didiharyono D and Syukri M 2020 Forecasting with ARIMA model in anticipating open unemployment rates in South Sulawesi. Int. J. Sci. Technol. Res. 9 3838-3841
[4]. Gostkowski M and Rokicki T 2021 Forecasting the unemployment rate: application of selected prediction methods. Eur. Res. Stud. 24 985-1000
[5]. Chakraborty T, Chakraborty A K, Biswas M, Banerjee S and Bhattacharya S 2021 Unemployment rate forecasting: a hybrid approach. Comput. Econ. 57 183-201
[6]. Ahmad M, Khan Y A, Jiang C, Kazmi S J H and Abbas S Z 2023 The impact of COVID-19 on unemployment rate: an intelligent based unemployment rate prediction in selected countries of Europe. Int J Fin Econ. 28 528-543
[7]. Będowska-Sójka B 2017 Unemployment rates forecasts: unobserved component models versus SARIMA models in Central and Eastern European countries. Comp. Econ. Res. 20 91-107
[8]. Dritsaki C 2016 Forecast of SARIMA models: an application to unemployment rates of Greece. Am. J. Appl. Math. Stat. 4 136-148
[9]. Dritsakis N and Klazoglou P 2018 Forecasting unemployment rates in USA using Box-Jenkins methodology. Int. J. Econ. Financ. Issues. 8 9
[10]. Katris C 2020 Prediction of unemployment rates with time series and machine learning techniques. Comput. Econ. 55 673-706