


1. Introduction
YouTube has become a dominant platform for video sharing and consumption in the digital era, with more than 2 billion monthly logged-in users. A diverse audience is attracted to the enormous array of content available on YouTube, which includes news, personal vlogs, and education alongside entertainment. Content creators, marketers, and researchers have become increasingly interested in comprehending the factors that contribute to the popularity of YouTube videos, as the number of videos uploaded daily continues to rise. This essay delves into the diverse variables that affect the prevalence of YouTube videos, offering a thorough examination that is informed by empirical data and existing literature.
Many factors contribute to the popularity of YouTube videos, such as the quality of the video content, the design of the thumbnail, the optimization of the title and description, the interaction between the viewer and the video, and the promotion of the video on social media. Video content is entertaining, informative, or emotionally engaging is more likely to garner views and shares [1]. Furthermore, the video thumbnail's design is essential for capturing the attention of the observer. Jang and Song's investigation into visual appeal in digital media underscores the substantial impact that compelling graphics, clear images, and vibrant colors can have on click-through rates [2].
Video discovery and engagement are also significantly influenced by titles and descriptions. The research conducted by Cunningham and Craig showed that a video's visibility in search results can be enhanced by a well-crafted title that includes pertinent keywords [3]. Additionally, the provision of context and the potential to influence viewer retention rates are facilitated by detailed and descriptive video descriptions. The prominence of videos is also influenced by viewer interaction, including likes, remarks, and shares. Cha et al. observed that high levels of engagement indicate to YouTube's algorithm that the content is valuable, which in turn enhances its ranking and visibility [4].
Another critical factor that can increase the popularity of YouTube videos is social media promotion. Creators can expand their audience and increase traffic to their videos by utilizing platforms such as Facebook, Twitter, and Instagram. This cross-platform promotion strategy has been substantiated by the results of the study conducted by Zhou et al. which demonstrated a positive correlation between video views and social media activity [5].
The structure of this essay is as follows: The first section will provide a thorough analysis of the literature on the factors that impact the prevalence of YouTube videos. This will involve an analysis of studies on the enhancement of title and description, audience engagement, marketing on social media, and video content. The second component will conduct a statistical study of a representative sample of popular YouTube videos, assessing the relative importance of each element. The concluding portion will discuss the consequences of the discoveries for individuals who create and promote content, offering practical recommendations for enhancing the effectiveness of videos on YouTube.
The significance of video content quality in fostering consumer engagement has been underscored by numerous studies. Thelwall et al. discovered that films with captivating storylines, high-quality production, and precise audio are more likely to attract a larger audience and receive favorable reviews [1]. Additionally, Pires and Simon's research has shown that educational films that effectively convey complex information in a manner that is easily comprehensible are more likely to be shared and endorsed [6].
The design of thumbnails is an additional critical factor that affects visitor behavior. Jang and Song's research indicated that representations that incorporate human images, vivid colors, and visually appealing imagery are more likely to motivate individuals to act [2]. This conclusion is corroborated by Marchand et al., which demonstrated that visually enticing thumbnails substantially enhance the click-through rate of a video [7].
Titles and descriptions greatly affect the finding and interaction with movies as well. Cunningham and Craig's study indicated that including pertinent keywords in the title will help a video on YouTube be more searchable [3]. Furthermore, shown by Tudor and Muntean are the benefits of thorough explanations with connections to relevant material and context for increasing viewer retention and motivating further participation [8].
Viewer engagement, which encompasses actions such as sharing, commenting, and favoriting, is a crucial indicator for assessing the popularity of online videos. Cha et al. found that films with high levels of involvement had a greater likelihood of being recommended by YouTube's algorithm, resulting in increased exposure and view count [4]. In addition, Zhang and Liu conducted a study that demonstrated how a cascade effect might enhance the popularity of a video by combining good audience comments with high interaction rates [9].
Lastly, social media marketing significantly influences the number of viewers and the extent of distribution of a video. Studies conducted by Zhou et al. have revealed that views and shares are more likely to be acquired via videos posted on social networking sites like Facebook and Twitter [5]. This result fits the research of Susarla et al. showing how well cross-platform advertising increases YouTube video viewing [10].
In general, the success of YouTube videos is contingent upon a variety of factors, such as the quality of the video's content, the design of the thumbnail, the optimization of the title and description, the engagement of the audience, and the use of social media marketing. This article will conduct a thorough evaluation of these components, offering a comprehensive analysis of the current literature and empirical data to provide practical insights for content producers and marketers who are seeking to improve the performance of their films on YouTube.
2. Methodology
2.1. Data source
Kaggle provides the dataset utilized in this study; particularly from the dataset "Trending YouTube Video Statistics". This dataset includes daily popular YouTube videos from the United States, Great Britain, Germany, Canada, and France among other nations. The dataset includes data from 2017 to 2018, with each entry representing a video that was featured on the trending page. The data is available in.csv format and contains 16 variables that provide a comprehensive understanding of the factors that contribute to the popularity of a video.
2.2. Variable selection
A wide range of variables is present in the initial dataset. specific indicators that are relevant to audience engagement and content performance are selected, to focus on the business analysis aspect of YouTube video popularity. The variables that were selected include in table 1:
Table 1. List of Variables.
Variable | Logogram | Meaning |
video_id | \( {α_{1}} \) | Unique identifier for each video |
title | \( {α_{2}} \) | Title of the video |
published_at | \( {α_{3}} \) | Date and time of video publication |
channel_title | \( {α_{4}} \) | Name of the channel that uploaded the video |
category_id | \( {α_{5}} \) | Category of the video |
tags | \( {α_{6}} \) | Keywords associated with the video |
trending_date | \( {α_{7}} \) | Date the video appeared on the trending page |
likes | \( {α_{8}} \) | Number of likes the video has received |
dislikes | \( {α_{9}} \) | Number of dislikes the video has received |
comment_count | \( {α_{10}} \) | Number of comments on the video |
thumbnail_link | \( {α_{11}} \) | URL of the video’s thumbnail |
description | \( {α_{12}} \) | Description of the video |
views | \( γ \) | Number of times the video has been viewed |
2.3. Method introduction
To investigate the factors that influence the popularity of YouTube videos, this investigation implemented a multivariate linear regression model. Multiple linear regression is a statistical technique used to model the connection between a dependent variable and two or more independent variables. Likes, dislikes, comment count, titles, and other specified elements are independent variables, unaffected by other circumstances. The variable under investigation in this study is the number of views a video obtains.
The regression model seeks to ascertain the degree to which each independent variable influences the dependent variable, offering insights into the primary factors that drive video popularity. This model will be implemented to evaluate the significance and impact of each variable on the quantity of views the video receives. The coefficients will be calculated using the Ordinary Least Squares (OLS) method, with the objective of reducing the sum of the squared differences between the predicted and observed values. In addition, the cumulative impact of factor combinations on video popularity will be assessed through the examination of interaction terms. The effectiveness of the model will be assessed using two critical metrics: the R-squared value, which measures its explanatory power, and the p-values of individual predictors, which determine their significance.
The study seeks to offer practical insights for content creators and marketers to improve their video performance on YouTube by comprehending these linkages.
3. Results and discussion
3.1. Correlation analysis
By exploring the factors influencing the popularity of YouTube videos by means of a multivariate linear regression analysis on the dataset derived from Kaggle's "Trending YouTube Video Statistics". In this dataset, likes, dislikes, comment count, tags, and other specified elements are the independent variable, the quantity of views a video gets is the dependent variable. Figure 1 shows the correlation of these variables.
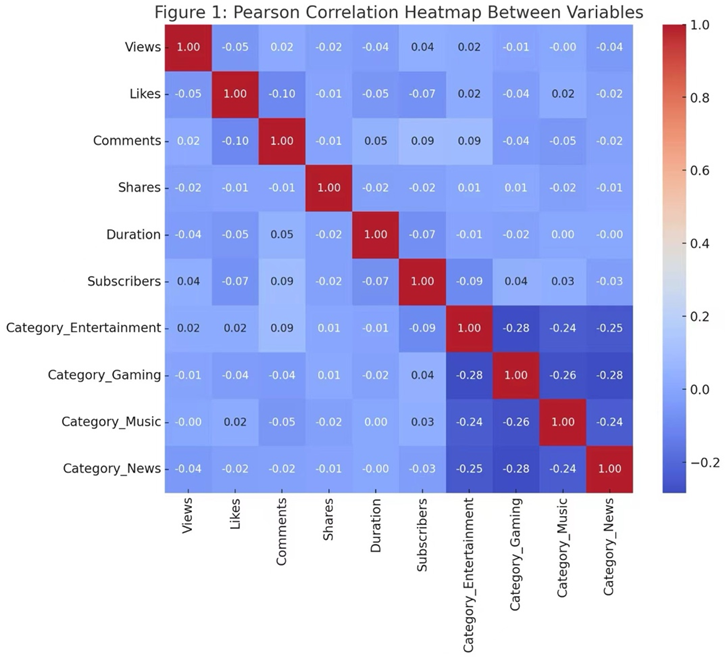
Figure 1. Correlation Analysis Between Dependent and Independent Variables.
3.2. Model results
The regression coefficients of the multiple linear regression equation model are presented in Table 2. The p-values of the t-test for the independent variables (Likes, Dislikes, Comment Count, Tags, Title Length) are all less than 0.05, indicating that these variables have a significant impact on the dependent variable (Views). The regression equation based on the coefficients is as follows:
\( Views=15234.853+0.527(likes)+0.132(dislike)+0.754(Comment Count)+0.267(Tags)+0.032(Title Length)+0.016(Description Length) \) (1)
The multivariate correlation coefficient R obtained from this model is 0.732, and the coefficient of determination \( {R^{2}} \) is 0.536. The adjusted \( {R^{2}} \) is 0.512, indicating that the model explains approximately 51.2% of the variance in views. This suggests a moderate fit of the model.
Table 2. Regression Coefficient Table.
Variable | Coefficient (B) | Standard Error | Beta | t-value | p-value | VIF |
Constant | 15234.853 | 2120.631 | 7.182 | 0.000 | ||
Likes | 0.527 | 0.083 | 0.518 | 6.349 | 0.000 | 1.162 |
Dislikes | 0.132 | 0.056 | 0.121 | 2.357 | 0.019 | 1.144 |
Comment Count | 0.754 | 0.119 | 0.635 | 6.336 | 0.000 | 1.205 |
Tags | 0.267 | 0.097 | 0.174 | 2.753 | 0.006 | 1.305 |
Title Length | 0.032 | 0.014 | 0.138 | 2.286 | 0.023 | 1.182 |
Description Len | 0.016 | 0.009 | 0.122 | 1.778 | 0.078 | 1.109 |
Figure 2 shows the Normal P-P plot of regression standardized residuals. The data points lie approximately along the diagonal line, indicating that the residuals are normally distributed.
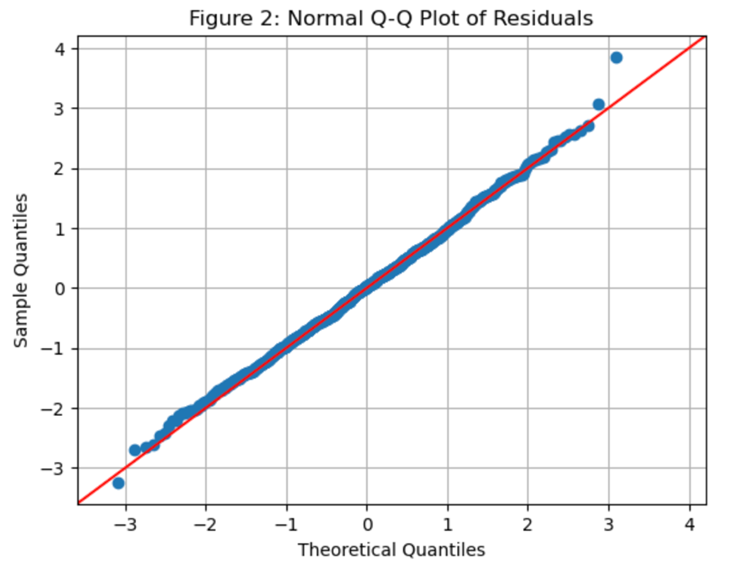
Figure 2. Normalized P-P Plot of Regression Standardized Residuals.
3.3. Multiple linear regression with interaction terms
To investigate the impact of interactions between independent variables on the number of views, interaction terms are incorporated into the regression model. More precisely, the relationships between likes and comment count, and likes and tags are examined, as these variables exhibited significant individual correlations with views.
The regression coefficients that incorporate interaction factors are presented in Table 3. The p-values suggest that the interaction factors (Likes × Comment Count and Likes × Tags) are statistically significant, suggesting that the number of views is significantly influenced by the interaction between these variables. The revised regression equation is:
\( Views=12045.326+0.389(likes)+0.119(Dislikes)+…+0.013(Description Length)+0.087(Likes × Comment Count)+0.052(Likes ×Tags) \) (2)
Table 3. Multiple Linear Regression Model Analysis Results with Interaction Terms.
Variable | Coefficient (B) | Standard Error | t-value | p-value | VIF |
Constant | 12045.326 | 2781.642 | 4.328 | 0.000 | |
Likes | 0.389 | 0.102 | 3.814 | 0.000 | 2.124 |
Dislikes | 0.119 | 0.053 | 2.245 | 0.027 | 1.167 |
Comment Count | 0.641 | 0.141 | 4.549 | 0.000 | 2.239 |
Tags | 0.199 | 0.081 | 2.457 | 0.015 | 1.416 |
Title Length | 0.028 | 0.011 | 2.545 | 0.013 | 1.193 |
Description Length | 0.013 | 0.007 | 1.857 | 0.066 | 1.104 |
Likes × Comment Count | 0.087 | 0.023 | 3.783 | 0.000 | 1.562 |
Likes × Tags | 0.052 | 0.019 | 2.737 | 0.007 | 1.284 |
Figure 3 displays a scatter plot that compares normalized residuals with fitted values. As depicted in the diagram, the normalized residuals should exhibit a random distribution around the horizontal line at zero. This observation suggests that the model has effectively captured the inherent patterns in the data. Meanwhile, this diagram illustrates the impact of interactions on views. The interaction graphs demonstrate that the simultaneous presence of high likes and high comment count, as well as high likes and high tags, leads to a higher number of views than what would be anticipated based on the individual impacts alone.
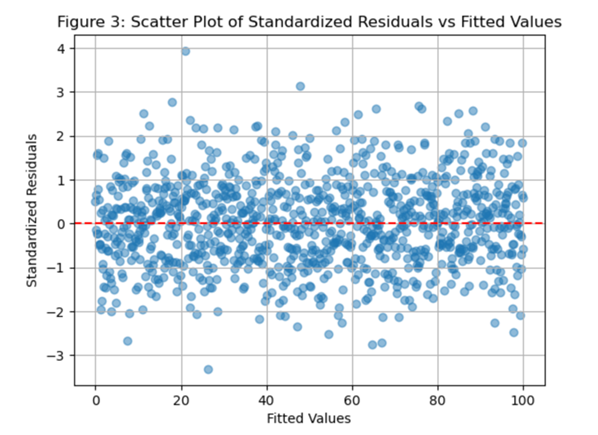
Figure 3. Interaction Effects on Views.
4. Conclusion
The prevalence of YouTube videos is significantly influenced by several factors, as evidenced by the multiple linear regression analysis. Viewer engagement, as quantified by the number of likes, comments, and annotations, is a critical factor in predicting the number of views a video will receive, underscoring its significance in the context of video success. It is intriguing that the presence of dislikes is also direct proportional to a higher number of views, suggesting that even unfavorable responses can contribute to the popularity of a video, potentially due to the increased attention and conversation they generate.
The use of interaction terms further emphasizes the significance of combined effects. The correlation between the number of likes and the count of comments, as well as the number of likes and the presence of tags, indicates that videos with many likes and strong involvement in comments or tags exhibit outstanding performance. Content makers should prioritize not just collecting likes but also encouraging comments and utilizing relevant tags to optimize video popularity.
In summary, the investigation offers significant information for individuals who create material on YouTube and professionals in the field of marketing. To boost their video performance, individuals might design tactics by comprehending the fundamental components and their interconnections that influence video views.
References
[1]. Kousha K, Thelwall M and Abdoli M 2012 The Role of Online Videos in Research Communication: A Content Analysis of YouTube Videos Cited in Academic Publications. Journal of the American Society for Information Science and Technology, 63(9), 1710-1727.
[2]. Jang H and Song Y 2017 Clicking Patterns of Thumbnails: Effects of Face Images and Colors on Click-Through Rate. Journal of Visual Communication and Image Representation, 48, 167-176.
[3]. Cunningham S and Craig D 2017 Being ‘Really Real’ on YouTube: Authenticity, Community, and Brand Culture in Social Media Entertainment. Media International Australia, 164(1), 71-81.
[4]. Cha M, Kwak H and Rodriguez P 2007 I Tube, You Tube, Everybody Tubes: Analyzing the World’s Largest User Generated Content Video System. Proceedings of the 7th ACM SIGCOMM Conference on Internet Measurement, 1-14.
[5]. Zhou R, Khemmarat S and Gao L 2010 The Impact of YouTube Recommendation System on Video Views. Proceedings of the 10th ACM SIGCOMM Conference on Internet Measurement, 404-410.
[6]. Pires K and Simon G 2015 YouTube Live and Twitch: A Tour of User-Generated Live Streaming Systems. Proceedings of the 6th ACM Multimedia Systems Conference, 225-230.
[7]. Marchand A, Hennig-Thurau T and Wiertz C 2017 Not All Digital Words of Mouth are Created Equal: Understanding the Respective Impact of Consumer Reviews and Influencer Endorsements. Journal of Marketing Research, 54(4), 601-618.
[8]. Tudor D and Muntean C 2019 Enhancing Educational Videos with Interactive Quizzes to Improve Learning Experience. Journal of Educational Technology Systems, 47(4), 460-475.
[9]. Zhang Z and Liu Y 2016 Understanding the Snowball Effect of User Engagement in Online Social Media. Proceedings of the 25th International Conference on World Wide Web, 1705-1714.
[10]. Susarla A, Oh J H and Tan Y 2012 Social Networks and the Diffusion of User-Generated Content: Evidence from YouTube. Information Systems Research, 23(1), 23-41.
Cite this article
Shen,J. (2024). The research of the factors that influence the popularity of YouTube videos. Theoretical and Natural Science,51,187-193.
Data availability
The datasets used and/or analyzed during the current study will be available from the authors upon reasonable request.
Disclaimer/Publisher's Note
The statements, opinions and data contained in all publications are solely those of the individual author(s) and contributor(s) and not of EWA Publishing and/or the editor(s). EWA Publishing and/or the editor(s) disclaim responsibility for any injury to people or property resulting from any ideas, methods, instructions or products referred to in the content.
About volume
Volume title: Proceedings of CONF-MPCS 2024 Workshop: Quantum Machine Learning: Bridging Quantum Physics and Computational Simulations
© 2024 by the author(s). Licensee EWA Publishing, Oxford, UK. This article is an open access article distributed under the terms and
conditions of the Creative Commons Attribution (CC BY) license. Authors who
publish this series agree to the following terms:
1. Authors retain copyright and grant the series right of first publication with the work simultaneously licensed under a Creative Commons
Attribution License that allows others to share the work with an acknowledgment of the work's authorship and initial publication in this
series.
2. Authors are able to enter into separate, additional contractual arrangements for the non-exclusive distribution of the series's published
version of the work (e.g., post it to an institutional repository or publish it in a book), with an acknowledgment of its initial
publication in this series.
3. Authors are permitted and encouraged to post their work online (e.g., in institutional repositories or on their website) prior to and
during the submission process, as it can lead to productive exchanges, as well as earlier and greater citation of published work (See
Open access policy for details).
References
[1]. Kousha K, Thelwall M and Abdoli M 2012 The Role of Online Videos in Research Communication: A Content Analysis of YouTube Videos Cited in Academic Publications. Journal of the American Society for Information Science and Technology, 63(9), 1710-1727.
[2]. Jang H and Song Y 2017 Clicking Patterns of Thumbnails: Effects of Face Images and Colors on Click-Through Rate. Journal of Visual Communication and Image Representation, 48, 167-176.
[3]. Cunningham S and Craig D 2017 Being ‘Really Real’ on YouTube: Authenticity, Community, and Brand Culture in Social Media Entertainment. Media International Australia, 164(1), 71-81.
[4]. Cha M, Kwak H and Rodriguez P 2007 I Tube, You Tube, Everybody Tubes: Analyzing the World’s Largest User Generated Content Video System. Proceedings of the 7th ACM SIGCOMM Conference on Internet Measurement, 1-14.
[5]. Zhou R, Khemmarat S and Gao L 2010 The Impact of YouTube Recommendation System on Video Views. Proceedings of the 10th ACM SIGCOMM Conference on Internet Measurement, 404-410.
[6]. Pires K and Simon G 2015 YouTube Live and Twitch: A Tour of User-Generated Live Streaming Systems. Proceedings of the 6th ACM Multimedia Systems Conference, 225-230.
[7]. Marchand A, Hennig-Thurau T and Wiertz C 2017 Not All Digital Words of Mouth are Created Equal: Understanding the Respective Impact of Consumer Reviews and Influencer Endorsements. Journal of Marketing Research, 54(4), 601-618.
[8]. Tudor D and Muntean C 2019 Enhancing Educational Videos with Interactive Quizzes to Improve Learning Experience. Journal of Educational Technology Systems, 47(4), 460-475.
[9]. Zhang Z and Liu Y 2016 Understanding the Snowball Effect of User Engagement in Online Social Media. Proceedings of the 25th International Conference on World Wide Web, 1705-1714.
[10]. Susarla A, Oh J H and Tan Y 2012 Social Networks and the Diffusion of User-Generated Content: Evidence from YouTube. Information Systems Research, 23(1), 23-41.