


1. Introduction
In the rapidly changing world, understanding the factors that influence happiness has become an increasingly important and complex research topic. As for happiness itself, it is a pluralistic and relatively subjective concept, with different interpretations from different disciplines or different theories. Happiness presupposes an evaluative stance concerning one period of one's life or one's own life as a whole [1]. Since the 1960s, many philosophers, thinkers and scientists have carried out relevant research on happiness, and people's understanding of happiness has become deeper and deeper.
The World Happiness Report is a publication that contains reports and rankings on the happiness of countries and the correlation between various factors. The first World Happiness Report was published in 2012, and Finland has been named the happiest country in the world seven times in a row until 2024. The report is based on data from the Gallup World Poll, in which people are asked to rate their quality of life on a scale of 0-10, as well as questions related to their happiness assessment. These scores were used to produce a happiness index for each country. Gallup also looked at a variety of quality-of-life factors and analyzed how they correlated with happiness [2]. So far, the World Happiness Report has adopted six variables, namely GDP per capita, Social support, Healthy life expectancy, Freedom to make life choices, Generosity and Perceptions of corruption. But the World Happiness Index is not calculated from the data of these six variables, the happiness index of 2024 is calculated by calculating the average happiness index of 2021-2023, which is very strange and confusing.
According to the World Happiness Report 2024, overall subjective happiness has improved and increased in countries around the world. However, regional differences in happiness remain large, with large gaps between developed and developing countries [3]. Since 2006-2010, happiness has declined in the Middle East and North Africa region and increased in Central and Eastern Europe and East Asia. In North America and South Asia, happiness declined among young people and increased among older people. The report also highlights that happiness inequality has increased across all regions, especially in sub-Saharan Africa. In addition, the report discusses the face challenges of older people, such as dementia. And methods and measures to improve well-being, such as improving the environment and behavioural strategies. This year's World Happiness Report has added an analysis of the impact of climate change, social justice and digitalization on happiness compared to previous years, which means that there are still many factors affecting happiness to consider in addition to the original six variables.
Meanwhile, according to Gallup, unemployment, one of the most famous statistics, is surprisingly absent from the World Happiness Index, which is calculated not by calculating the six known variables, but by averaging happiness over the previous three years [4]. This algorithm is strange because unexpected events such as the sudden outbreak of COVID-19 in 2019 can lead to a sharp increase in unemployment, a sharp reduction in economic income, and a decrease in people's self-confidence, which leads to a sharp reduction in happiness [5]. However, according to the World Happiness Report 2020, the happiest countries, such as Finland, are even happier in 2022 (7.809) than in 2024 (7.741) [6]. The two most affected economic powers, the United States and China, also show that they are happier in 2020 than in 2024. This is obviously unreasonable. According to Gallup and the Alliance for Happiness, Finland is not the happiest country in the world, and the Alliance for Happiness considers more factors than the World Happiness Report [7, 8]. Therefore, based on the World Happiness Report 2024, this paper will analyze the influence degree of the original six variables on the happiness index by using data analysis methods such as line chart, scatter chart and bar chart, and propose new influencing factors by using scatter chart and map data visualization [9]. Finally, it will evaluate and improve the calculation method and sample size of the happiness index.
2. Methodology
2.1. Data source
The data set on the World Happiness Index and 6 variables used in this article is mainly from the official website of the World Happiness Report. The date is from 2024. The data set for the World Happiness Report 2024 contains 144 data sets covering all countries surveyed. The raw data set is saved in.xls format. The Gini Coefficient is based on a dataset from the Our World in Data website, which contains 2325 datasets covering countries from 1963-2023 (some data are incomplete). The original data set is saved in.csv format. Data sets on education level/literacy come from Kaggle and the website "Our World in Data", the original data set downloaded by Kaggle contains 193 data sets, and the original data set is saved in.csv format. The mortality dataset is from the World Health Organization website. The original dataset contains 6269 datasets covering all countries from 1987 to 2024 (some data are incomplete). The original dataset was last updated on February 21, 2024, and was saved in.xls format [10].
2.2. Variable selection
Based on the original data, this paper will adopt the original 6 variables (GDP per capita, Social support, Healthy life expectancy, Freedom to make life choices, Generosity and Perceptions of corruption), as well as variables such as Income Inequality (The Gini Coefficient), Education level and Regions. The specific descriptions of these variables are shown in Table 1:
Table 1. List of Variables.
Variable | Type of data | Range |
GDP per capita | float | [0.0, 2.141] |
Social support | float | [0.0, 1.617] |
Healthy life expectancy | float | [0.0, 0.857] |
Freedom to make life choices | float | [0.0, 0.863] |
Generosity | float | [0.0, 0.401] |
Perceptions of Corruption | float | [0.0, 0.575] |
Gini Coefficient | float | [0.178, 0.658] |
Education level | float | [2.207, 12.938] |
Region | float | - |
2.3. Method introduction
In this paper, scatter chart, bar chart and linear regression model are used to compare the impact of the original six variables on the happiness index, and finally find the variable with the greatest impact. Then scatter plot, linear regression and map data visualization were used to analyze the correlation between other potential factors and happiness index. The general mathematical model for multiple linear regression is:
\( E(Y)={β_{0}}+{β_{1}}{x_{1}}+{β_{2}}{x_{2}}+⋯+{β_{13}}{x_{12}}+e \) (1)
In the above formula: \( {β_{0}} \) is a constant term, and e is a residual term. In addition, this paper uses map data to visualize the comprehensive happiness index of various regions. The general formula for R square value is:
\( {R^{2}}=1-\frac{Unexplained Variation}{Total Variation} \) (2)
3. Results and discussion
3.1. Correlation analysis
According to Figure 1, it can be seen that the Social support has the highest correlation coefficient with Ladder Score, while Generosity has the lowest correlation coefficient with Ladder Score, and it is far lower than the average correlation coefficient (0.59). The correlation between Log GDP per capita and Healthy life expectancy and Generosity is low and negative. Log GDP per capita, Social support and Healthy life expectancy have high correlation. It can be inferred that Generosity has a small effect on happiness index, and whether it should be removed from the six variables is a question worth considering.
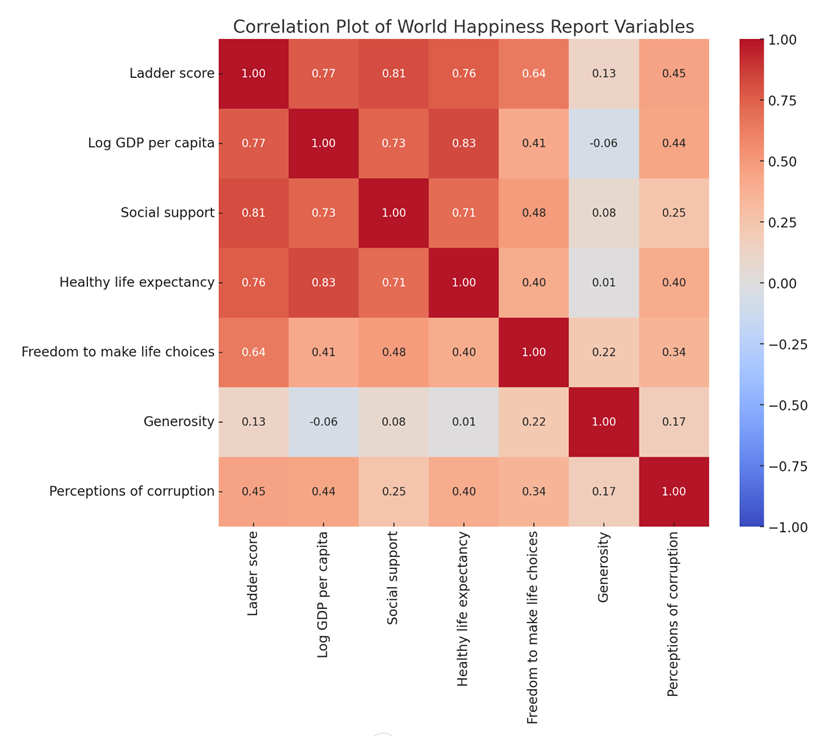
Figure 1. Correlation results.
3.1.1. GDP and happiness index. According to Figure 2, the linear fitting formula for scatter data is: \( Ladder score=2.586+2.135×Log GDP per capita \) , and the R-square value is 0.591. There is a high linear positive correlation between per capita GDP and happiness score, and the higher the GDP, the higher the happiness level.
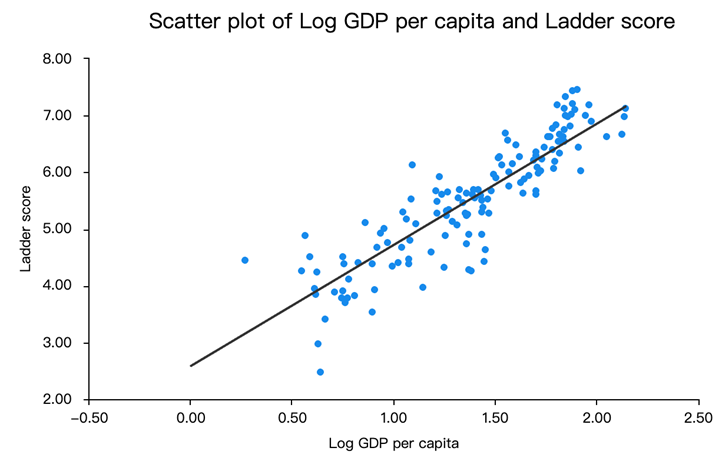
Figure 2. Scatter plot of Log GDP per capita and Ladder score.
3.1.2. Social support and happiness. As shown in Figure 3, the linear fitting formula for scatter data is: \( Ladder score=2.260+2.883×Social Support \) , and the R-square value is 0.662. Social support has the highest linear positive correlation with happiness score. The higher the Social support, the higher the happiness level.
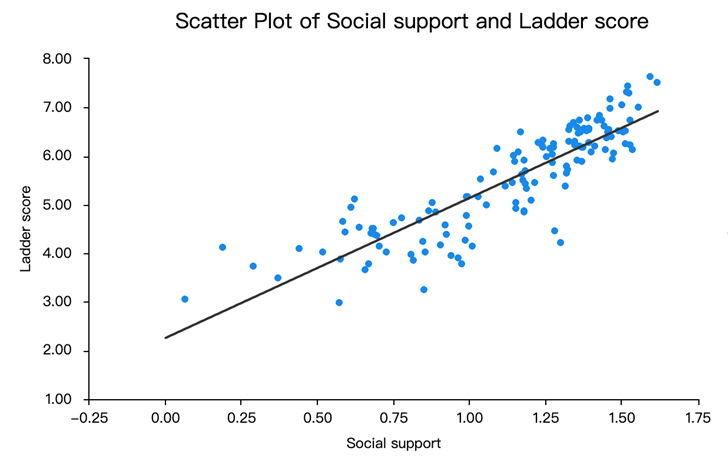
Figure 3. Scatter plot of Social support and Ladder score.
3.1.3. Generosity and happiness index. As can be seen from Figure 4, the distribution of scatter data of Generosity is much more dispersed than other factors, with the R-square value of only 0.017. This refers to a low correlation between Generosity and Ladder Score, so consider replacing Generosity with other factors.
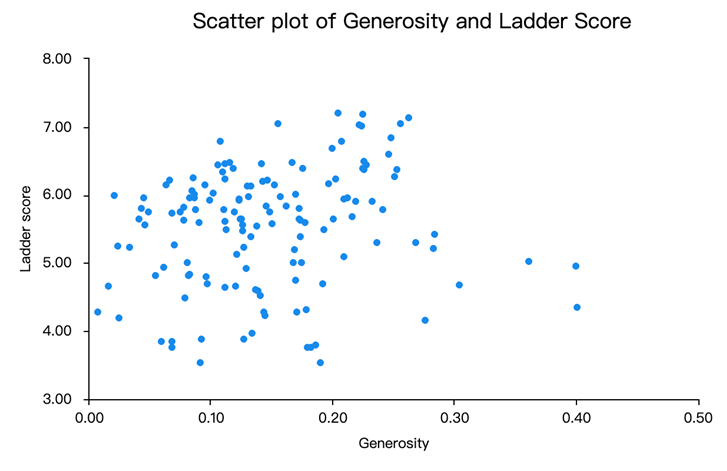
Figure 4. Scatter plot of Generosity and Ladder score.
3.2. The potential factors
3.2.1. Regions and happiness index. As can be seen from Figure 5, the countries with a high overall happiness index are mostly located in Europe, Oceania and North America. South America and Asia are in the middle of the pack, while Africa's overall well-being is low. It may be inferred that factors such as geography and political system also affect happiness.
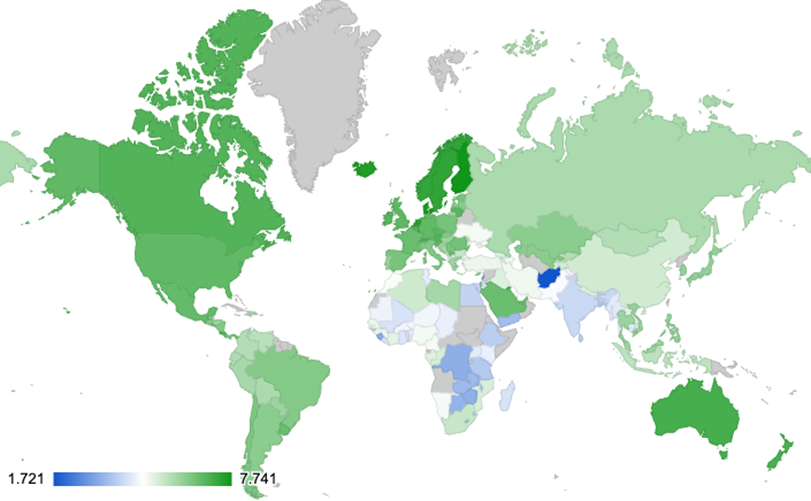
Figure 5. The World Happiness Index on the global map.
3.2.2. Gini coefficient and happiness index. As Figure 6 shows, inequality is highest in South Africa and higher in Africa as a whole. At the same time, the inequality coefficient in South America is also high, and the distribution of happiness index in the world is almost the same as that in Fig.5, which proves that income inequality is also potentially related to happiness index.
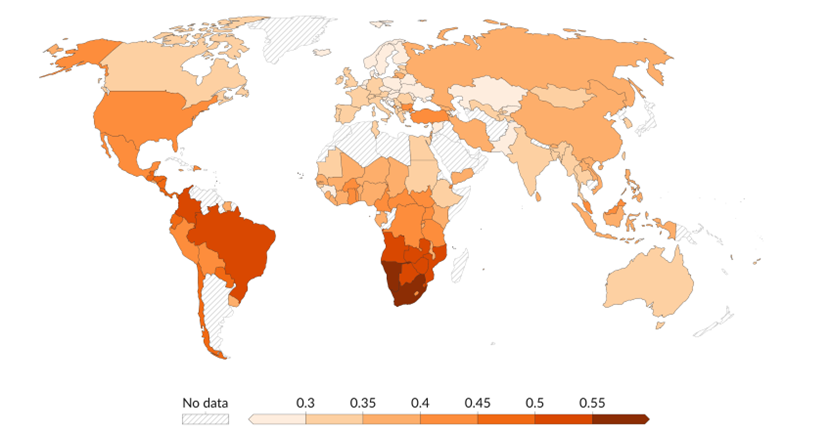
Figure 6. Gini coefficient on the global map in 2019 [7].
3.2.3. Education level and happiness index. These instructions apply to everyone, regardless of the formatter being used. According to Figure 7, the average length of schooling in Africa is four years, while in Asia and South America it is between eight and 10 years, and the regions with the highest happiness index (Europe, Oceania, North America) have the longest schooling, averaging between 10 and 12 years. This also confirms that the longer the education, the higher the happiness index, confirming that the level of education may also be one of the factors affecting the happiness index.
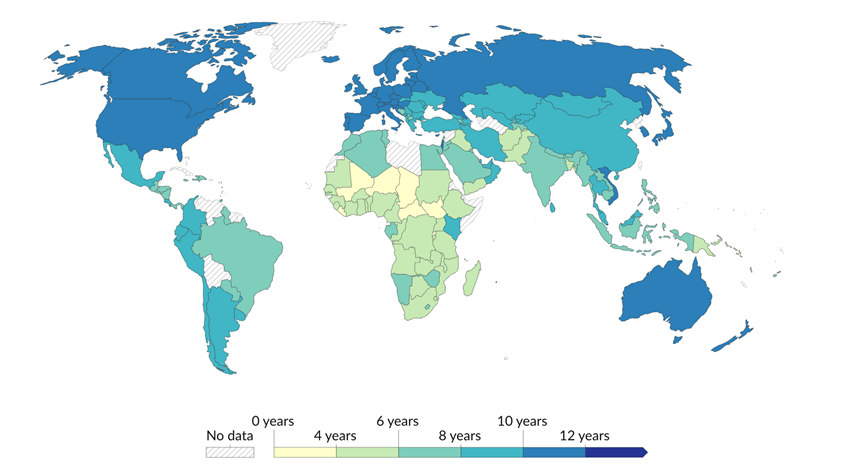
Figure 7. Years of schooling on the global map [8].
3.3. Objectivity and accuracy
According to the World Happiness Report website, the typical annual sample for each country is 1,000 people. If a typical country conducted a survey once a year, the sample size would be 3,000 people. However, for populous countries such as China, the sample size of 3000 people is obviously far from enough and has a large error. According to the World Happiness Rankings 2024, China ranks 60th on the happiness index, but as the world's second largest economy, its happiness ranking results are questionable.
Some countries' happiness figures look less than reasonable. According to research, Finland has almost the highest rate of mental disorders in the European Union, with one in six Finns suffering from mental health problems. Depression, anxiety and substance abuse are the most common mental health problems [9]. However, as of 2024, Finland has been named the happiest country in the world seven times. Therefore, Finland may not be the happiest country in the world, but it is the fact that Finns are more likely to feel satisfied that leads to such a high Ladder Score [10].
4. Conclusion
Based on the World Happiness Report 2024 and related data, this study analyzes the impact of the original six variables on the happiness index, analyzes the distribution, comparison and summary of the happiness index in different regions, and finally evaluates the sample and questions the happiness index of some countries.
In the analysis stage, this paper uses a scatter plot and correlation visualization to find out the degree of correlation between 6 variables and the happiness index. In contrast, Social Support and GDP per capita had the greatest impact on happiness, while Generosity had the least association with happiness. To learn more, the study also visualized the distribution of happiness across different regions using map data and found that countries with high happiness were more likely to be in Europe, North America, and Oceania, while countries with low happiness were more likely to be in Africa.
Through these studies, people have gained a deeper understanding of the World Happiness Report. However, there are still many shortcomings in this study, such as more detailed analysis of variables, more factors considered, insufficient data and so on. To improve these issues, this paper needs to look at more reports and data on world happiness and use control variable methods, linear regression, to study possible relationships between happiness and different factors.
References
[1]. Laura M, et al. 2017 Happiness Index Methodology, Journal of Sustainable Social Change, 9, 4-31.
[2]. Helliwell J F, et al. 2024. World Happiness Report 2024. University of Oxford: Wellbeing Research Centre.
[3]. Helliwell J F, et al. 2020 World Happiness Report 2020. New York: Sustainable Development Solutions Network.
[4]. Jon C and Blind S 2022 The Global Rise of Unhappiness and How Leaders Missed It, ISBN.
[5]. Musikanski L and Bradbury J 2024 The Happiness Report Card 2024. Happiness Alliance happy counts.
[6]. Laura M, et al. 2017 Happiness Index Methodology. Journal of Sustainable Social Change, 9, 4-31.
[7]. Joe H 2023 Measuring inequality: what is the Gini coefficient. Working paper.
[8]. Filmer D P, et al. 2018 Learning-Adjusted Years of Schooling (LAYS): Defining A New Macro Measure of Education. Journal of Sustainable Social Change.
[9]. OECD, European Observatory on Health Systems and Policies 2023. Finland: Country Health Profile 2023.
[10]. Swanson A 2015 How we provoked the wrath of some of the world's most perfect people. Washington Post, 10.
Cite this article
Zong,Y. (2024). The research on the factors affecting the World Happiness index. Theoretical and Natural Science,41,104-111.
Data availability
The datasets used and/or analyzed during the current study will be available from the authors upon reasonable request.
Disclaimer/Publisher's Note
The statements, opinions and data contained in all publications are solely those of the individual author(s) and contributor(s) and not of EWA Publishing and/or the editor(s). EWA Publishing and/or the editor(s) disclaim responsibility for any injury to people or property resulting from any ideas, methods, instructions or products referred to in the content.
About volume
Volume title: Proceedings of the 2nd International Conference on Mathematical Physics and Computational Simulation
© 2024 by the author(s). Licensee EWA Publishing, Oxford, UK. This article is an open access article distributed under the terms and
conditions of the Creative Commons Attribution (CC BY) license. Authors who
publish this series agree to the following terms:
1. Authors retain copyright and grant the series right of first publication with the work simultaneously licensed under a Creative Commons
Attribution License that allows others to share the work with an acknowledgment of the work's authorship and initial publication in this
series.
2. Authors are able to enter into separate, additional contractual arrangements for the non-exclusive distribution of the series's published
version of the work (e.g., post it to an institutional repository or publish it in a book), with an acknowledgment of its initial
publication in this series.
3. Authors are permitted and encouraged to post their work online (e.g., in institutional repositories or on their website) prior to and
during the submission process, as it can lead to productive exchanges, as well as earlier and greater citation of published work (See
Open access policy for details).
References
[1]. Laura M, et al. 2017 Happiness Index Methodology, Journal of Sustainable Social Change, 9, 4-31.
[2]. Helliwell J F, et al. 2024. World Happiness Report 2024. University of Oxford: Wellbeing Research Centre.
[3]. Helliwell J F, et al. 2020 World Happiness Report 2020. New York: Sustainable Development Solutions Network.
[4]. Jon C and Blind S 2022 The Global Rise of Unhappiness and How Leaders Missed It, ISBN.
[5]. Musikanski L and Bradbury J 2024 The Happiness Report Card 2024. Happiness Alliance happy counts.
[6]. Laura M, et al. 2017 Happiness Index Methodology. Journal of Sustainable Social Change, 9, 4-31.
[7]. Joe H 2023 Measuring inequality: what is the Gini coefficient. Working paper.
[8]. Filmer D P, et al. 2018 Learning-Adjusted Years of Schooling (LAYS): Defining A New Macro Measure of Education. Journal of Sustainable Social Change.
[9]. OECD, European Observatory on Health Systems and Policies 2023. Finland: Country Health Profile 2023.
[10]. Swanson A 2015 How we provoked the wrath of some of the world's most perfect people. Washington Post, 10.