


1. Introduction
Pakistan is a country with a diverse climate that is often subject to weather extremes such as floods and droughts. Rainfall in Pakistan is influenced by a range of factors, including global climatic phenomena, such as El Niño and La Niña, as well as regional climate change due to global warming. These events pose significant challenges to agriculture, water management, and the overall economy. Understanding and predicting rainfall patterns in Pakistan is therefore crucial for effective resource management and disaster prevention.
This study aims to improve rainfall predictions in Pakistan using advanced statistical models. Specifically, the performance of the Autoregressive Integrated Moving Average (ARIMA) model and its seasonal counterpart, the Seasonal ARIMA (SARIMA) model are compared. While the ARIMA model performs well in time series analysis has limitations in dealing with seasonal variations which is a key feature of rainfall patterns in Pakistan. On the other hand, the SARIMA model provides more accurate forecasts through seasonal adjustment.
The application of statistical models in predicting rainfall patterns has been widely studied. Among these, the Autoregressive Integrated Moving Average (ARIMA) model is widely used due to its ability to handle various types of time series data. Narayanan et al. highlighted the effectiveness of ARIMA in hydrologic time series analysis, emphasizing its adaptability and accuracy in time series forecasting for pre-monsoon rainfall data in western India [1]. However, the major disadvantage of the ARIMA model is that it fails to account for seasonality, which prevents accurate forecasting in areas like Pakistan where rainfall patterns have significant seasonal variations. To address this limitation, Seasonal ARIMA (SARIMA) models have been introduced. SARIMA models extend the ARIMA model by incorporating seasonal differencing, which helps capture seasonal variations in the data. Ray et al. demonstrated the efficacy of SARIMA models in predicting seasonal patterns in rainfall data across South Asian countries, showing that incorporating seasonality significantly improves the model's predictive accuracy [2]. Similarly, Kabbilawsh et al. predicted long-term monthly precipitation using the SARIMA model and further demonstrated the effectiveness of the model in capturing seasonal dynamics [3].
Comparative studies between ARIMA and SARIMA models have shown that SARIMA is more advantageous in areas with a strong seasonal component. Dimri et al. analyzed climatic variables using the seasonal ARIMA approach and concluded that the SARIMA model performs better in capturing seasonal patterns [4]. Dubey et al. compared the SARIMA model for predicting time series data and Long Short-Term Memory (LSTM) models and found that the SARIMA model outperformed the LSTM model in capturing seasonal dynamics [5]. The reason for the enhanced predictive power of the SARIMA models is that they explicitly model seasonality and are therefore more suitable for small to medium-sized datasets and are computationally efficient.
In addition, model evaluation metrics such as Root Mean Square Error (RMSE) and Akaike Information Criterion (AIC) have been used to evaluate SARIMA models. Studies have shown that SARIMA models typically have lower RMSE and AIC values compared to ARIMA models, indicating better model fit and predictive performance. For example, Salman and Kanigoro applied the ARIMA model to visibility prediction, which proved the usefulness of ARIMA in some cases. However, it also validated the need to use the SARIMA model when seasonal characteristics are very distinctive [6]. Shoko and Peter demonstrated the usefulness of the ARIMA model for non-seasonal data by applying the model to the prediction of the incidence of COVID-19 in Southern Africa [7].
Dabral and Murry used the SARIMA model to analyze and predict rainfall time series in India, confirming the usefulness of SARIMA in handling seasonal data and improving prediction accuracy [8]. Barrera-Animas et al. conducted a comparative analysis of modern machine learning algorithms for rainfall prediction, including SARIMA, and concluded that SARIMA is more effective than non-seasonal models in capturing seasonal trends [9]. Finally, Hipel and McLeod's work on water resources time series modeling further supported the great role of SARIMA in studies of environmental aspects that are deeply correlated with the seasons [10].
The transition from the ARIMA model to the SARIMA model for rainfall prediction in Pakistan is an important step toward improving the accuracy and reliability of climate predictions. By considering seasonality, the SARIMA model provides a more comprehensive understanding of rainfall dynamics, which is important for environmental management and disaster prevention in Pakistan.
In addition to the SARIMA model, other studies have explored different approaches to improve rainfall and flow forecasts. Zhang et al. used a combination of statistical modelling and reanalysis of data to study precipitation, demonstrating the importance of understanding the regional hydrological variability [11]. In addition, Xu et al. explored the impacts of climate change on drought in China using a multi-model assessment of CMIP6, which provided insights into the long-term challenges posed by changes in precipitation patterns under different climate scenarios [12].
Other approaches such as machine learning models have also been applied to rainfall prediction. Barrera-Animas et al. conducted a comparative analysis of modern machine learning algorithms and concluded that SARIMA still has significant value in capturing seasonal trends compared to non-seasonal models [13]. Similarly, Bora and Hazarika applied the ARIMA model to rainfall time series in northeastern India, focusing on areas with high monsoon rainfall such as Assam and Meghalaya, demonstrating that despite its limitations in dealing with seasonality, ARIMA is still important [14].
Finally, Kang and Kim focused on predicting daily rainfall in the tropics using the SARIMA model, highlighting the versatility of SARIMA in different geographic settings, including both tropical and monsoon regions with significant rainfall variability [15].
These additional studies highlight the continued development of statistical and machine learning methods in addressing the complexity of rainfall prediction in different climatic regions. Together, these studies highlight the importance of the SARIMA and ARIMA models, while also pointing to future directions for climate-related forecasting.
2. Methodology
2.1. Data source
The data for this study is sourced from Kaggle's "Rainfall in Pakistan: Historical Data of 116 Years" dataset. It includes monthly average rainfall records over 116 years in millimeters in Pakistan, which is compiled with assistance from the Pakistan Meteorological Department (PMD) archives.
2.2. Variable selection
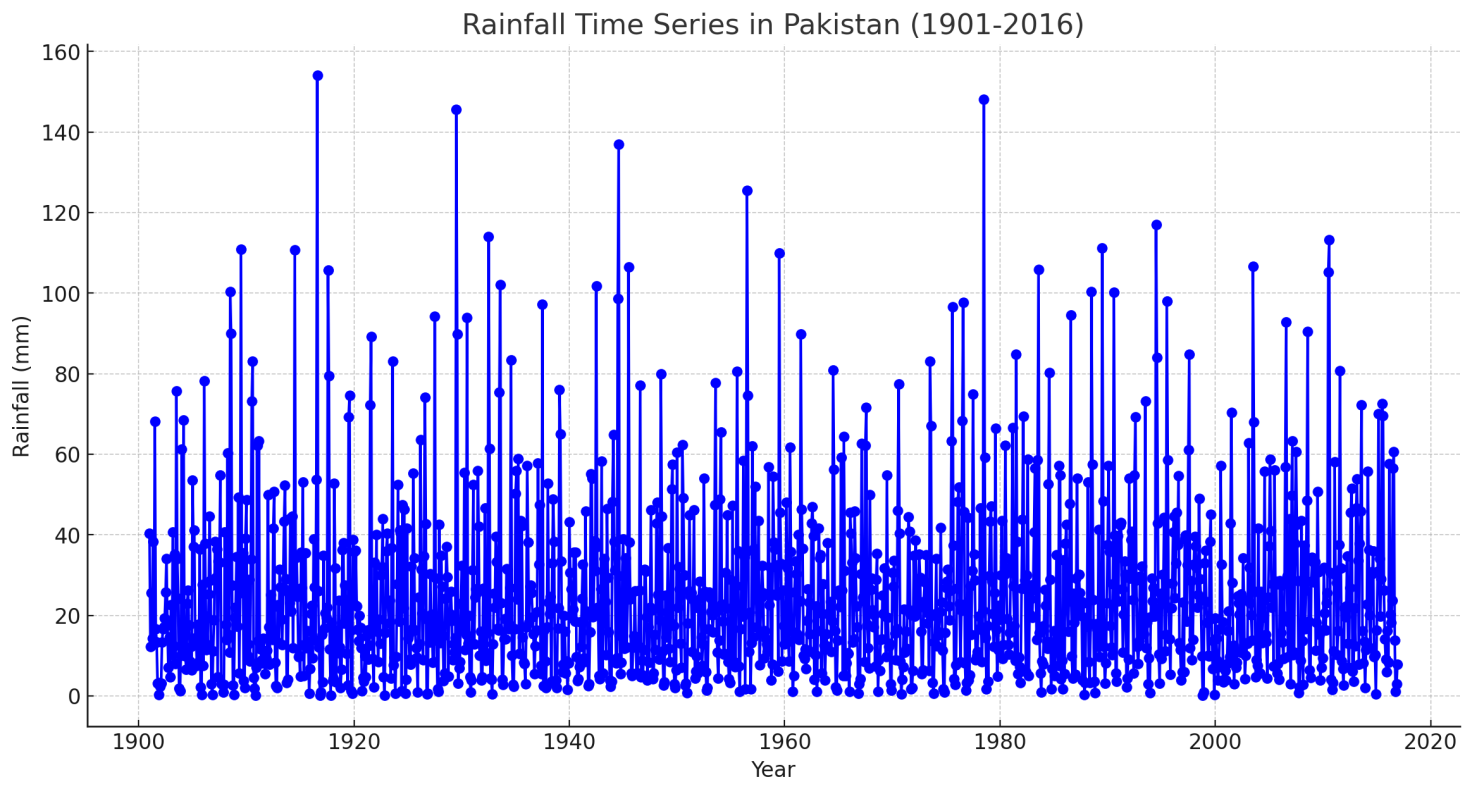
The research has identified a number of important factors that affect rainfall forecasting in Pakistan. Firstly, the release of increasing amounts of greenhouse gases is leading to higher global temperatures, increased evaporation, and changes in weather patterns, which may lead to lower rainfall. Furthermore, the burning of fossil fuels releases greenhouse gases that make the Pakistani region drier, further altering rainfall patterns. Then forestation makes the situation worse by reducing the region's ability to retain moisture. In addition, natural events such as El Niño and La Niña can cause dramatic changes in rainfall. El Niño usually leads to a decrease in rainfall, while La Niña leads to an increase in rainfall, thus greatly affecting Pakistan's climate (Figure 1).
|
Figure 1. Rainfall Time Series in Pakistan (1901-2016). |
2.3. Model selection
In this study, the ARIMA model was replaced with the SARIMA model to enhance the accuracy of rainfall predictions in Pakistan. The ARIMA model is widely recognized for capturing overall trends through its three primary components: Autoregressive (AR) for lagged observations, Integrated (I) for achieving stationarity, and Moving Average (MA) for managing residual errors. However, ARIMA models face significant challenges in regions with strong seasonal variations, such as Pakistan, where rainfall patterns exhibit pronounced seasonality.
To solve this limitation, we choose the SARIMA model, which extends ARIMA by incorporating seasonal variances. This adjustment allows SARIMA to better capture repeated rainfall patterns and periodic fluctuations, making it more suitable for seasonally distinct regions.SARIMA also efficiently converts non-smooth data to smooth data, which is essential for improving the reliability of the model predictions.
The SARIMA model has been widely used in various climate and hydrological prediction studies. For example, Dabral and Murry successfully applied the SARIMA model to predict long-term rainfall patterns in India, demonstrating the efficiency of the model in capturing the seasonal component of rainfall data. Their study emphasised that SARIMA can provide more accurate predictions in areas where seasonal dynamics [16].
Furthermore, in their authoritative work on time series analysis, Box, Jenkins, and Reinsel provided a thorough explanation of the ARIMA and SARIMA models. They highlighted the SARIMA model's effectiveness in handling periodic data [17]. This theoretical foundation supports the use of SARIMA in this study to improve the accuracy of rainfall predictions in Pakistan, where seasonal variations play a key role.
In addition, this study builds on previous studies that have demonstrated the effectiveness of the SARIMA model in managing the seasonality of climate data. For example, Qian and Jia conducted an extensive study of seasonal precipitation patterns in China using SARIMA, highlighting the model's ability to capture rainfall cycles and intensity. Their findings strengthened the applicability of SARIMA to areas with significant seasonal variability, similar to rainfall patterns in Pakistan [18]. The inspiration gained from their study led to the decision to rely on SARIMA in this study to deal with the complex seasonality inherent in Pakistan's climate.
By transitioning to SARIMA, this study has improved the accuracy and reliability of rainfall prediction, resulting in a more comprehensive understanding of rainfall dynamics in Pakistan. Such improvements are critical for water resource management, disaster prevention and agricultural planning, all of which rely heavily on accurate and timely climate forecasts.
3. Results and discussion
3.1. Data processing
The Augmented Dickey-Fuller (ADF) test is used to assess whether the rainfall data time series is stationary. The null hypothesis (H0) of the ADF test states that the time series has a unit root, meaning the series is non-stationary. If the p-value obtained from the test is greater than the chosen significance level (commonly 0.05 or 0.1), the null hypothesis is not rejected, indicating the series remains non-stationary. Conversely, if the p-value is less than the significance level, the null hypothesis is rejected, suggesting the series is stationary. For time series models like ARIMA and SARIMA, stationarity is a crucial assumption, as it implies that the statistical properties of the series (such as the mean and variance) remain constant over time. If the series is found to be non-stationary, differencing techniques are typically applied to achieve stationarity before proceeding with further modeling.
The Augmented Dickey-Fuller (ADF) test results for the original time series (without differencing) are shown in Table 1. The t-statistic is -6.696, and the p-value is 0.000. These values are much lower than the critical values at the 1%, 5%, and 10% levels. This means the null hypothesis of a unit root can be rejected. Therefore, the rainfall series in Pakistan is stationary and does not need differencing.
Table 1. The ADF plot of Rainfall in Pakistan
Differencing Order | t-value | p-value | Critical Value 1% | Critical Value 5% | Critical Value 10% |
0 | -6.696 | 0.000 | -3.435 | -2.864 | -2.568 |
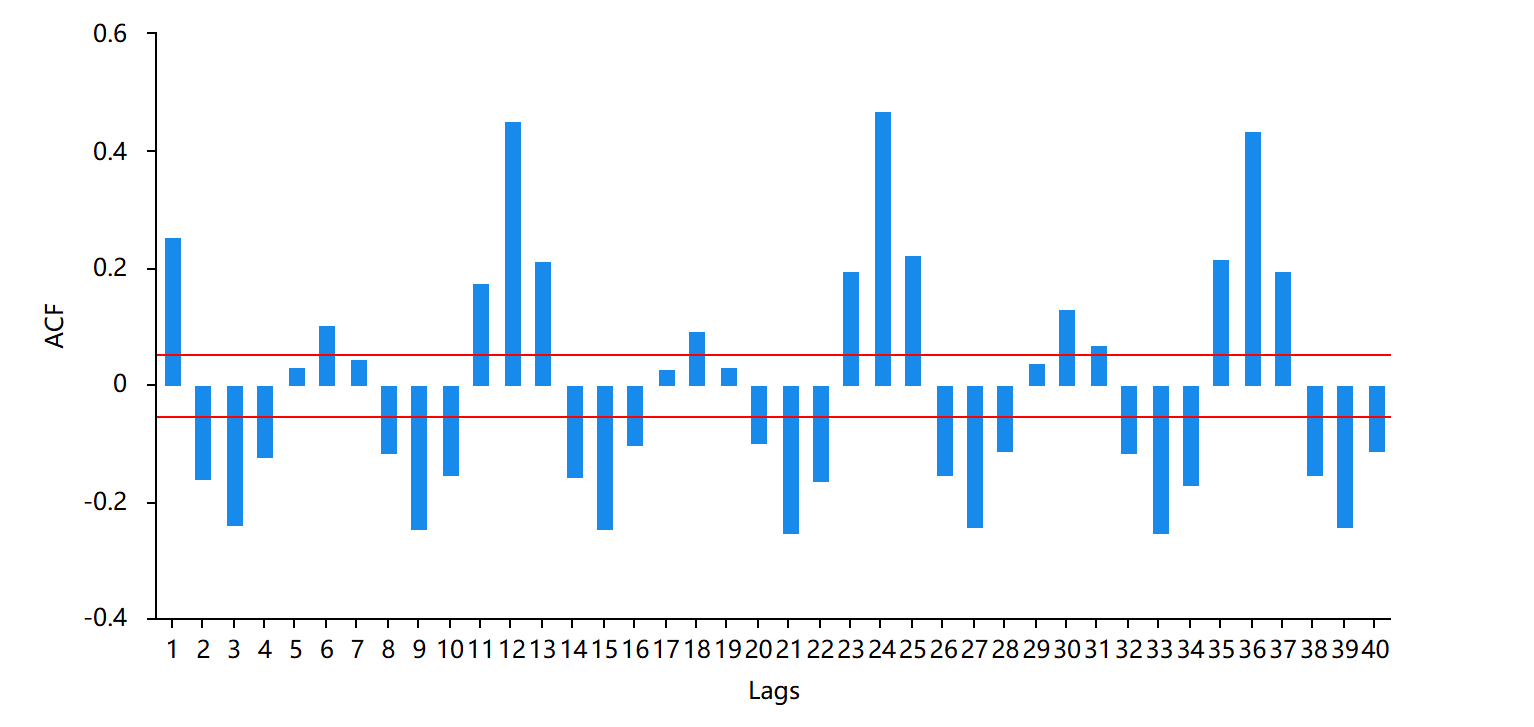
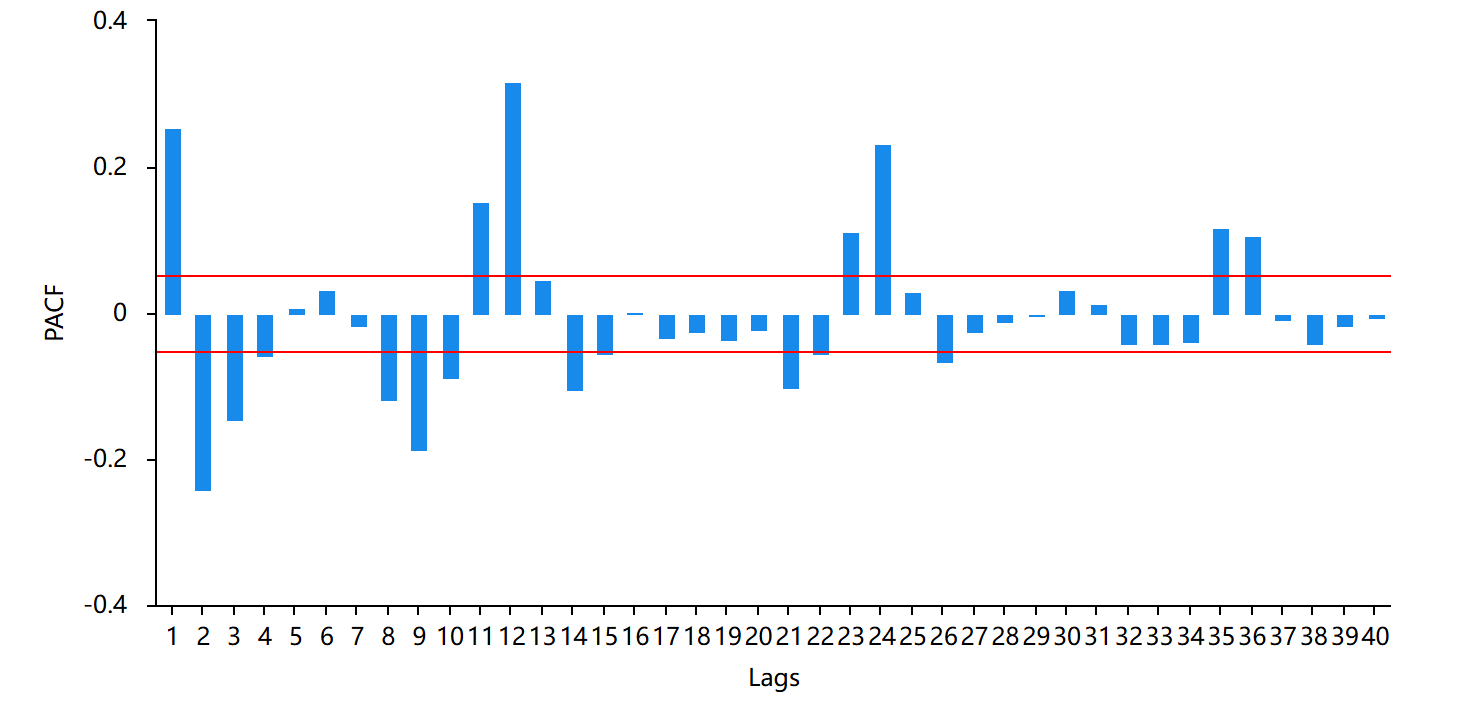
During data processing, the Autocorrelation Function (ACF) and Partial Autocorrelation Function (PACF) plots were utilized to determine the appropriate orders for the ARIMA model. The ACF plot (Figure 2) is used to identify the moving average (MA) order (q), while the PACF plot (Figure 3) assists in determining the autoregressive (AR) order (p). In this study, as depicted in Figure 2 and 3, neither the ACF nor the PACF plots showed clear cutoffs, indicating the necessity of both AR and MA components. The p and q values were selected based on the most noticeable spikes in these plots.
|
Figure 2. The ACF plot. |
|
Figure 3. The PACF plot. |
In the third step of data processing, the ARIMA model was applied to predict rainfall in Pakistan, as illustrated in Figure 4. The analysis of the Akaike Information Criterion (AIC = 11904.375) and Bayesian Information Criterion (BIC = 12040.576) indicates that lower values correspond to a better model fit.
The Ljung-Box Q test was conducted to determine whether the residuals were white noise. As shown in Table 2, the Q6 statistic produced a p-value of 0.030*, which is less than 0.05. Therefore, the null hypothesis that the residuals are white noise cannot be rejected at the 0.05 significance level, indicating that the model residuals exhibit no significant autocorrelation. This result proves that the ARIMA model is suitable for this prediction as shown in Figure 4.
|
Figure 4. The ARIMA plot. |
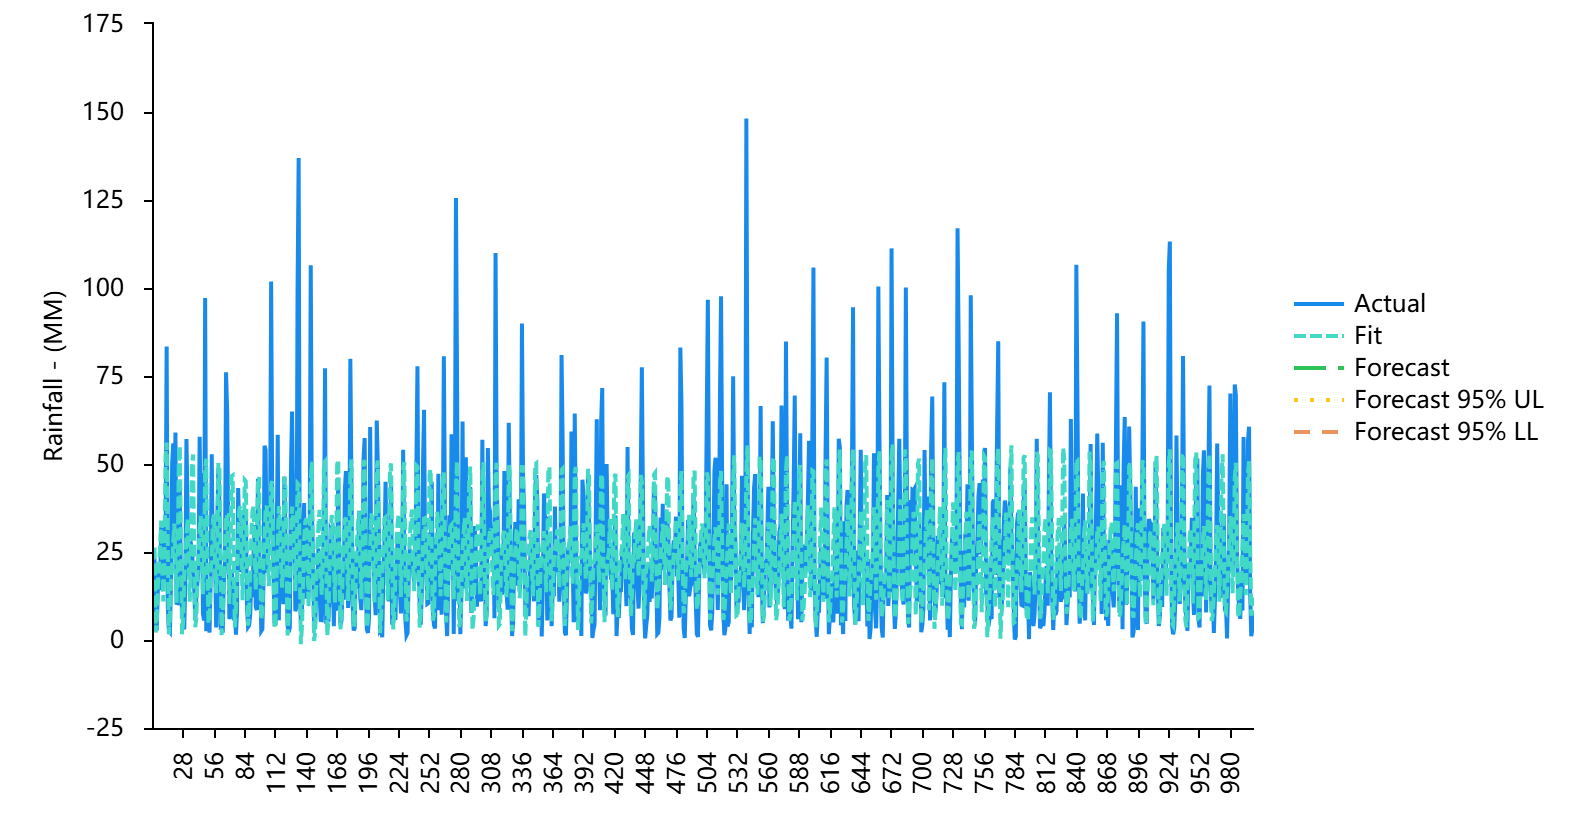
Table 2. Ljung-Box Q Test Statistics for ARIMA Model Residuals
Lag | Q Statistic | p-value |
Q6 | 4.718 | 0.030* |
Q12 | 4.812 | 0.090 |
Q18 | 7.196 | 0.066 |
Q24 | 7.249 | 0.123 |
Q30 | 7.300 | 0.199 |
Q36 | 10.733 | 0.097 |
Q42 | 10.777 | 0.149 |
Q48 | 12.320 | 0.137 |
Q54 | 15.552 | 0.077 |
Q60 | 15.587 | 0.112 |
Q66 | 17.472 | 0.095 |
Q72 | 18.815 | 0.093 |
Q78 | 18.832 | 0.128 |
Q84 | 18.932 | 0.168 |
3.2. Model evaluation
Adjusting for seasonal forecasts from ARIMA to SARIMA, both models are evaluated using key performance metrics (Table 3): Root Mean Square Error (RMSE) and Mean Square Error (MSE).
Table 3. Comparison of ARIMA and SARIMA Models
Metric | ARIMA | SARIMA |
RMSE | 17.0623 | 18.5698 |
MSE | 291.1226 | 344.8376 |
MAE | 12.2349 | 13.9788 |
MAPE | 1.5776 | 4.1301 |
From the results, we observe that the ARIMA model produced a lower RMSE (17.0623) and MSE (291.1226) compared to SARIMA's RMSE (18.5698) and MSE (344.8376). These metrics suggest that ARIMA may have a slight edge in short-term prediction accuracy for this dataset. However, despite the higher RMSE and MSE values, SARIMA's advantage lies in its ability to account for seasonality, which ARIMA lacks.
ARIMA is a stable time series forecasting model that is particularly effective when seasonal variations are not significant. It is a good choice for short-term forecasting and is simple and efficient when dealing with non-seasonal data. However, when applied to datasets with significant periodicity, its performance is decreased due to the seasonal variations. ARIMA assumes that patterns in the data will repeat themselves and does not account for cyclical environmental variations, which can lead to less accurate long-term forecasts.
In contrast, SARIMA extends the ARIMA model by incorporating seasonal variations, making it more applicable to datasets where seasonal patterns occur repeatedly. Although the model requires more computing power, it can be used in a variety of ways, such as in the case of the SARIMA model.
This is reflected in this study is that although SARIMA may produce higher error indicators, it is effective in capturing the periodicity of rainfall. The complexity of the SARIMA model allows for a more detailed understanding of data affected by the seasonal cycle, which is critical to accurately predicting long term weather trends in regions such as Pakistan.
One of the main challenges in using SARIMA lies in the selection of appropriate parameters. The model relies on the accurate identification of seasonal and non-seasonal components, a process that requires several attempts to determine the best combination of parameters. Incorrect parameter selection can reduce the accuracy of the model, as shown by many other study. This emphasises the importance of careful adaptation and validation when applying SARIMA to complex time series data. While SARIMA performs well in managing seasonality, future research could explore combining SARIMA with machine learning techniques. For example, combining SARIMA with deep learning models such as Long Short-Term Memory (LSTM) networks could improve forecast accuracy, especially during irregular weather events.
By capturing non-linear relationships and identifying wider patterns in the data, these mixed methods may help relieve some of the limitations of SARIMA. As climate change continues to contribute variability to rainfall patterns, the development of more adaptive models is critical to improving long-term forecast accuracy.
3.3. Model forecasting
This article uses the SARIMA(0, 0, 0) × (1, 0, 0, 12) model to predict 12 numerical values for rainfall data, and the results are shown in Figure 5 and Table 4.
|
Figure 5. Forecasts from SARIMA(0, 0, 0) × (1, 0, 0, 12). |
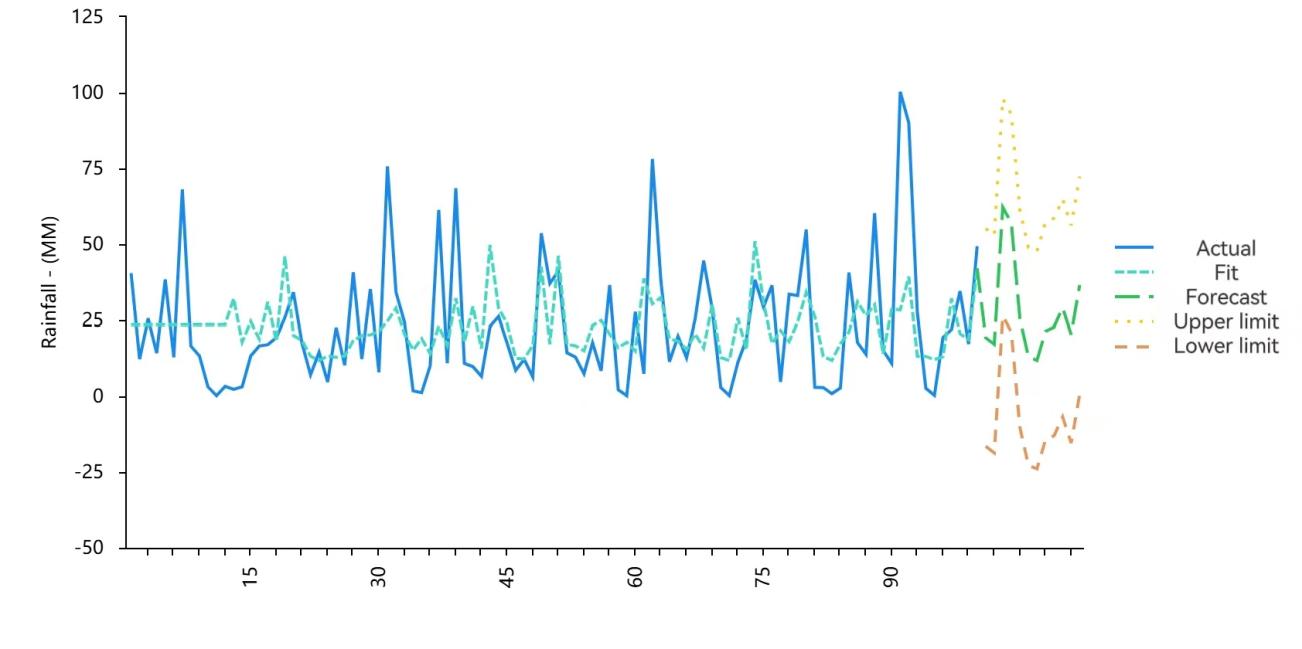
The blue line represents the actual rainfall data, while the green dashed line represents the fitted values, and the forecasted values are shown in the solid green line with upper and lower confidence limits (yellow and orange dashed lines). The results indicate significant fluctuations in the predicted rainfall values, particularly with notable increases in months such as March and July, which are then followed by minor reductions as the year progresses. The predicted values remain within the confidence interval, indicating that the predictions of the SARIMA model are accurate.
The comparison between actual and predicted values shows that the SARIMA model captures the overall trend of the data, including seasonal variations in rainfall patterns. For example, rainfall increases significantly during months such as March and July during the rainy season in Pakistan. However, these peaks are followed by a significant drop in rainfall in the following months, reflecting the dry period that follows the monsoon season. The SARIMA model successfully predicts these fluctuations with reasonable accuracy within the confidence intervals. This suggests that the model is able to effectively handle the periodicity of rainfall data, although the inherent complexity of weather patterns occasionally leads to discrepancies between predicted and actual values.
Table 4 presents the point forecasts and the associated confidence intervals (L 95 and H 95) for each month from January to December 2017. The point forecasts indicate the expected rainfall for each month, while the confidence intervals provide a range of values within which the actual rainfall is expected to fall. For instance, in March 2017, the model forecasts a rainfall of 62.16 mm, with a lower confidence limit of 26.35 mm and an upper confidence limit of 97.98 mm. This relatively wide confidence interval reflects the uncertainty in predicting extreme weather events, especially during the transitional months leading into and out of the monsoon season.
Despite the model's ability to forecast seasonal patterns, there are some limitations that should be acknowledged. The SARIMA model assumes that past seasonal trends will persist into the future, which may not always be the case due to the influence of unpredictable global climate phenomena such as El Niño and La Niña. These events can disrupt the usual rainfall patterns, leading to deviations from the predicted values. Moreover, the model's reliance on historical data means that it may struggle to predict sudden, non-repetitive shifts in climate patterns.
Overall, the predicted values remain within the confidence interval, indicating that the SARIMA model performs well in capturing both the seasonal trends and overall variability in the rainfall data. However, predictive accuracy could be further improved by incorporating additional relevant variables, such as temperature or humidity, or by combining the model with machine learning techniques that are better suited for capturing complex and non-linear patterns in the data.
Table 4. Forecasts from SARIMA(0, 0, 0) × (1, 0, 0, 12)
Time | Point Forecast | L 95 | H 95 |
2017/01 | 19.33 | -16.48 | 55.14 |
2017/02 | 17.16 | -18.65 | 52.97 |
2017/03 | 62.16 | 26.35 | 97.98 |
2017/04 | 57.00 | 21.19 | 92.81 |
2017/05 | 25.55 | -10.26 | 61.36 |
2017/06 | 13.04 | -22.77 | 48.85 |
2017/07 | 11.86 | -23.95 | 47.67 |
2017/08 | 21.47 | -14.34 | 57.28 |
2017/09 | 22.79 | -13.02 | 58.60 |
2017/10 | 29.06 | -6.75 | 64.87 |
2017/11 | 20.38 | -15.44 | 56.19 |
2017/12 | 36.53 | 0.72 | 72.34 |
3.4. Check autocorrelation
To evaluate the adequacy of the SARIMA model, a Ljung-Box Q test was conducted to analyze the autocorrelation of the residuals.
Table 5. Ljung-Box Q Test Statistics for SARIMA Model Residuals
Lag | Q Statistic | p-value |
Q1 | 0.000 | 0.986 |
Q2 | 1.762 | 0.414 |
Q3 | 1.818 | 0.611 |
Q4 | 2.644 | 0.619 |
Q5 | 2.655 | 0.753 |
Q6 | 2.872 | 0.825 |
Q7 | 3.085 | 0.877 |
Q8 | 3.151 | 0.925 |
Q9 | 4.514 | 0.874 |
Q10 | 5.009 | 0.891 |
Q11 | 5.432 | 0.908 |
Q12 | 5.457 | 0.941 |
Q13 | 9.198 | 0.758 |
Q14 | 11.699 | 0.630 |
Q15 | 12.203 | 0.664 |
Q16 | 12.204 | 0.730 |
Q17 | 13.470 | 0.704 |
Q18 | 13.649 | 0.752 |
Q19 | 15.909 | 0.663 |
Q20 | 16.101 | 0.710 |
Table 5 presents the Q statistics and p-values for different lags. For Q6, which tests up to the 6th lag, the p-value is 0.825, which is higher than 0.1. This indicates that for the first 6 lags, the residuals do not exhibit significant autocorrelation. So the hypothesis that the residuals are white noise is accepted. Most other p-values are also above 0.1, further supporting the conclusion that the residuals are generally uncorrelated. Consequently, the SARIMA model is deemed reliable for forecasting.
3.5. Critical thinking
While the SARIMA model is effective in capturing seasonal rainfall patterns in Pakistan, it faces several challenges, which have been observed in other studies as well. The study by Räisänen pointed out that climate models, including SARIMA, may have difficulty accurately capturing the effects of global climate phenomena such as El Niño and La Niña. These events can cause significant changes to typical rainfall patterns, introducing unpredictability and non-linear behavior that the SARIMA model, with its built-in assumption of periodic patterns, may not fully capture [19]. This limitation was also observed in the study by Ray et al., where the authors found that while SARIMA models worked well for predicting regular seasonal rainfall in South Asian countries, their accuracy dropped during years affected by major climatic anomalies [20].
Additionally, SARIMA models rely on historical data, assuming that past patterns will continue into the future. However, this assumption may not hold true in regions increasingly impacted by climate change. As Räisänen pointed out in his review, climate models often show a certain level of uncertainty when trying to predict future patterns under changing environmental conditions [19]. This aligns with findings, where the SARIMA model accurately predicted regular rainfall patterns but showed discrepancies during periods influenced by global climate shifts. These results suggest the need for more advanced models that can account for both regular seasonal changes and the effects of larger climate events.
Apart from these external climate factors, the effectiveness of SARIMA is also highly dependent on selecting the right parameters. Ray et al. discussed the difficulties of parameter tuning in SARIMA models, where incorrect selection can lead to poor model performance and reduced forecasting accuracy [20]. In this study, choosing the right combination of seasonal and non-seasonal parameters required multiple iterations to achieve optimal results. If the parameters are not carefully chosen, the model’s predictions can deviate significantly from actual outcomes, reducing its practical applications [20].
In the end, while SARIMA provides a solid framework for predicting regular seasonal patterns, it may need to be complemented by other models or hybrid approaches to improve its accuracy during times of climate instability. Ray et al. reached a similar conclusion, suggesting that integrating other models, such as machine learning or deep learning techniques, could help overcome SARIMA’s limitations [20]. Although this research did not explore these hybrid approaches, they represent a promising direction for future studies aiming to improve the accuracy and reliability of rainfall forecasts, especially in the face of unpredictable climate events.
4. Conclusion
This study has demonstrated that the SARIMA model is highly effective in improving the accuracy of rainfall predictions in Pakistan, particularly in capturing the seasonal variations that are a key feature of the region’s weather patterns. The transition from ARIMA to SARIMA has provided significant advantages, allowing the model to better address the complexity of Pakistan's rainfall, which is largely influenced by the monsoon seasons and other cyclical climate factors. The ability of SARIMA to account for seasonality makes it a more reliable tool for long-term forecasts, offering decision-makers in agriculture, water management, and disaster preparedness better information for planning and resource allocation.
However, despite its strengths, the SARIMA model does have certain limitations that need to be acknowledged. One of the key challenges is its difficulty in accurately predicting unusual or extreme climate events, such as those triggered by El Niño and La Niña. These global climate phenomena can cause deviations from the expected seasonal patterns, which SARIMA, with its focus on regularity and periodicity, may not fully capture. Additionally, the process of selecting the appropriate model parameters, such as the seasonal and non-seasonal components, is complex and can greatly influence the accuracy of the forecasts. Incorrect parameter selection can result in poor model performance.
Given these limitations, future research should focus on integrating the SARIMA model with other advanced techniques to enhance its predictive power. For instance, combining SARIMA with machine learning models or neural networks, which are better equipped to handle non-linear and irregular patterns, could provide a more comprehensive forecasting tool.
Moreover, automating the parameter selection process using optimization algorithms would make the SARIMA model more user-friendly and accessible to researchers. Methods like automated search or optimization algorithms could be used to make this process easier, lowering the chances of mistakes and increasing the model’s accuracy.
In conclusion, this study provides valuable insights for predicting rainfall in Pakistan and lays a solid foundation for future climate research and decision-making. By addressing its limitations and exploring new ways to enhance its performance, future studies can provide even more accurate and reliable forecasts, supporting better decision-making in climate-sensitive sectors such as agriculture, water resources, and disaster management.
References
[1]. Narayanan P, Basistha A, Sarkar S, Sachdeva K 2013 Trend analysis and ARIMA modelling of pre-monsoon rainfall data for western India. Comptes Rendus Geoscience, 345(1), 22-27.
[2]. Ray S, Das S S, Mishra P and Al Khatib A M G 2021 Time series SARIMA modelling and forecasting of monthly rainfall and temperature in the South Asian countries. Earth Systems and Environment, 5, 531-546.
[3]. Kabbilawsh P, Kumar D S and Chithra N R 2022 Forecasting long-term monthly precipitation using SARIMA models. Journal of Earth System Science, 131(174).
[4]. Dimri T, Ahmad S and Sharif M 2020 Time series analysis of climate variables using seasonal ARIMA approach. Journal of Earth System Science, 129(149), 1-16.
[5]. Dubey A K, et al. 2021 Study and analysis of SARIMA and LSTM in forecasting time series data. Sustainable Energy Technologies and Assessments. J. Seta, 101474.
[6]. Salman A G and Kanigoro B 2021 Visibility Forecasting Using Autoregressive Integrated Moving Average (ARIMA) Models. Procedia Computer Science, 179, 262-268.
[7]. Shoko C and Njuho P 2022 ARIMA Model in Predicting of COVID-19 Epidemic for the Southern Africa Region. Afr J Infect Dis, 17(1), 1-9.
[8]. Dabral P P and Murry M Z 2017 Modelling and Forecasting of Rainfall Time Series Using SARIMA. Environmental Processes, 4, 399-419.
[9]. Barrera-Animas A Y, et al. 2022 Rainfall prediction: A comparative analysis of modern machine learning algorithms for time-series forecasting. Machine Learning with Applications, 7.
[10]. Hipel K W and McLeod A I 1994 Time Series Modelling of Water Resources and Environmental Systems. Developments in Water Science, 1013.
[11]. Zhang Q, et al. (2011) Precipitation and streamflow changes in China: Changing patterns, causes and implications. Journal of Hydrology, 410(3), 204-216.
[12]. Xu F, et al. (2024) Understanding climate change impacts on drought in China over the 21st century: A multi-model assessment from CMIP6. Climate and Atmospheric Science, 7(32).
[13]. Barrera-Animas A Y, et al. (2022) Rainfall prediction: A comparative analysis of modern machine learning algorithms for time-series forecasting. Machine Learning with Applications, 7, 100204.
[14]. Bora S and Hazarika A (2023) Rainfall time series forecasting using ARIMA model. 2023 International Conference on Computing, Communication, and Intelligent Systems (ICCCIS), 1-7.
[15]. Kang S and Kim J (2017) Prediction of daily rainfall in tropical regions using SARIMA model. Atmospheric Research, 189, 290-302.
[16]. Dabral P P and Murry M Z (2017) Modelling and forecasting of rainfall time series using SARIMA. Environmental Processes, 4(2), 399-419.
[17]. Box G E P, Jenkins G M and Reinsel G C (2008) Time series analysis: Forecasting and control (4th ed.). Wiley Series in Probability and Statistics.
[18]. Qian Q and Jia X (2023) Seasonal forecast of winter precipitation over China using machine learning models. Atmospheric Research, 294, 106961.
[19]. Räisänen J (2016) How reliable are climate models? Tellus A: Dynamic Meteorology and Oceanography, 59(1), 2-29.
[20]. Ray S, Das S S, Mishra P and Al Khatib A M G (2021) Time series SARIMA modelling and forecasting of monthly rainfall and temperature in the South Asian countries. Earth Systems and Environment, 5, 531-546.
Cite this article
Luo,Q. (2024). Decoding Pakistan's rainfall: optimizing predictions from ARIMA to SARIMA with seasonal adjustments. Theoretical and Natural Science,42,73-83.
Data availability
The datasets used and/or analyzed during the current study will be available from the authors upon reasonable request.
Disclaimer/Publisher's Note
The statements, opinions and data contained in all publications are solely those of the individual author(s) and contributor(s) and not of EWA Publishing and/or the editor(s). EWA Publishing and/or the editor(s) disclaim responsibility for any injury to people or property resulting from any ideas, methods, instructions or products referred to in the content.
About volume
Volume title: Proceedings of the 2nd International Conference on Mathematical Physics and Computational Simulation
© 2024 by the author(s). Licensee EWA Publishing, Oxford, UK. This article is an open access article distributed under the terms and
conditions of the Creative Commons Attribution (CC BY) license. Authors who
publish this series agree to the following terms:
1. Authors retain copyright and grant the series right of first publication with the work simultaneously licensed under a Creative Commons
Attribution License that allows others to share the work with an acknowledgment of the work's authorship and initial publication in this
series.
2. Authors are able to enter into separate, additional contractual arrangements for the non-exclusive distribution of the series's published
version of the work (e.g., post it to an institutional repository or publish it in a book), with an acknowledgment of its initial
publication in this series.
3. Authors are permitted and encouraged to post their work online (e.g., in institutional repositories or on their website) prior to and
during the submission process, as it can lead to productive exchanges, as well as earlier and greater citation of published work (See
Open access policy for details).
References
[1]. Narayanan P, Basistha A, Sarkar S, Sachdeva K 2013 Trend analysis and ARIMA modelling of pre-monsoon rainfall data for western India. Comptes Rendus Geoscience, 345(1), 22-27.
[2]. Ray S, Das S S, Mishra P and Al Khatib A M G 2021 Time series SARIMA modelling and forecasting of monthly rainfall and temperature in the South Asian countries. Earth Systems and Environment, 5, 531-546.
[3]. Kabbilawsh P, Kumar D S and Chithra N R 2022 Forecasting long-term monthly precipitation using SARIMA models. Journal of Earth System Science, 131(174).
[4]. Dimri T, Ahmad S and Sharif M 2020 Time series analysis of climate variables using seasonal ARIMA approach. Journal of Earth System Science, 129(149), 1-16.
[5]. Dubey A K, et al. 2021 Study and analysis of SARIMA and LSTM in forecasting time series data. Sustainable Energy Technologies and Assessments. J. Seta, 101474.
[6]. Salman A G and Kanigoro B 2021 Visibility Forecasting Using Autoregressive Integrated Moving Average (ARIMA) Models. Procedia Computer Science, 179, 262-268.
[7]. Shoko C and Njuho P 2022 ARIMA Model in Predicting of COVID-19 Epidemic for the Southern Africa Region. Afr J Infect Dis, 17(1), 1-9.
[8]. Dabral P P and Murry M Z 2017 Modelling and Forecasting of Rainfall Time Series Using SARIMA. Environmental Processes, 4, 399-419.
[9]. Barrera-Animas A Y, et al. 2022 Rainfall prediction: A comparative analysis of modern machine learning algorithms for time-series forecasting. Machine Learning with Applications, 7.
[10]. Hipel K W and McLeod A I 1994 Time Series Modelling of Water Resources and Environmental Systems. Developments in Water Science, 1013.
[11]. Zhang Q, et al. (2011) Precipitation and streamflow changes in China: Changing patterns, causes and implications. Journal of Hydrology, 410(3), 204-216.
[12]. Xu F, et al. (2024) Understanding climate change impacts on drought in China over the 21st century: A multi-model assessment from CMIP6. Climate and Atmospheric Science, 7(32).
[13]. Barrera-Animas A Y, et al. (2022) Rainfall prediction: A comparative analysis of modern machine learning algorithms for time-series forecasting. Machine Learning with Applications, 7, 100204.
[14]. Bora S and Hazarika A (2023) Rainfall time series forecasting using ARIMA model. 2023 International Conference on Computing, Communication, and Intelligent Systems (ICCCIS), 1-7.
[15]. Kang S and Kim J (2017) Prediction of daily rainfall in tropical regions using SARIMA model. Atmospheric Research, 189, 290-302.
[16]. Dabral P P and Murry M Z (2017) Modelling and forecasting of rainfall time series using SARIMA. Environmental Processes, 4(2), 399-419.
[17]. Box G E P, Jenkins G M and Reinsel G C (2008) Time series analysis: Forecasting and control (4th ed.). Wiley Series in Probability and Statistics.
[18]. Qian Q and Jia X (2023) Seasonal forecast of winter precipitation over China using machine learning models. Atmospheric Research, 294, 106961.
[19]. Räisänen J (2016) How reliable are climate models? Tellus A: Dynamic Meteorology and Oceanography, 59(1), 2-29.
[20]. Ray S, Das S S, Mishra P and Al Khatib A M G (2021) Time series SARIMA modelling and forecasting of monthly rainfall and temperature in the South Asian countries. Earth Systems and Environment, 5, 531-546.