


1. Introduction
Santiago, the capital of Chile, has been facing significant challenges related to air quality, driven by its unique geographical setting, rapid urbanization, and industrial growth for the past a few decades. Nestled in a valley surrounded by the Andes to the east and the Chilean Coastal Range to the west, Santiago’s topography naturally traps pollutants, particularly during winter months when thermal inversions are common. These inversions prevent the dispersion of pollutants, exacerbating smog and creating hazardous air conditions.
The mid-20th century marked a period of rapid industrialization and urban expansion in Santiago, which led to a dramatic increase in emissions from vehicles, factories, and residential heating [1, 2]. By the 1980s and 1990s, Santiago's air quality had deteriorated to some of the worst levels globally, with frequent smog episodes resulting in high concentrations of particulate matter (PM10) and other harmful pollutants [1]. This period saw significant public health impacts, particularly in respiratory and cardiovascular diseases [2, 3].
In response to the worsening air quality, the Chilean government implemented a series of measures aimed at reducing emissions and improving public health [4, 5]. These included stricter emissions standards, the introduction of cleaner fuels, vehicle restrictions, and the expansion of public transportation. Additionally, Santiago invested in technology such as air quality monitoring systems, and initiatives to increase green spaces, which contributed to gradual improvements in air quality over the following decades [6].
Despite these efforts, Santiago continues to face air quality challenges, particularly with fine particulate matter (PM2.5) during winter [7, 8]. The ongoing issues are compounded by the city's continued growth [4, 5], traffic congestion [9], and the persistent use of wood-burning for residential heating. Moreover, the impacts of climate change pose new challenges, potentially intensifying smog formation.
To better understand and anticipate these challenges, this study employs Seasonal Autoregressive Integrated Moving Average (SARIMA) models to forecast the emissions of key pollutants-PM2.5, PM10, NO₂, and O₃-for the next 12 months. These forecasts offer valuable insights into potential future air quality trends in Santiago, allowing for the identification of seasonal patterns, potential pollution peaks, and the effectiveness of current mitigation strategies. By analysing these projections, the study aims to contribute to the ongoing efforts to improve air quality in Santiago, offering evidence-based recommendations for policy and public health interventions.
2. Methodology
2.1. Data source
The air quality data used in this study was obtained from the Sistema de Información Nacional de Calidad del Aire (SINCA), a platform managed by Chile’s Ministry of the Environment (Ministerio del Medio Ambiente, MMA). SINCA serves as the official national repository for air quality monitoring data across Chile. The platform provides comprehensive, real-time data on key atmospheric pollutants, including particulate matter (PM2.5 and PM10), nitrogen dioxide (NO₂), ozone (O₃).
For Santiago, SINCA offers detailed historical data and current measurements from a network of monitoring stations strategically located throughout the metropolitan area. For this study, data from the Las Condes station was selected due to its comprehensive coverage and diverse monitoring capabilities (PM2.5, PM10, NO₂, O₃). This data is essential for assessing air quality trends and projecting future levels of pollutants, thereby serving as a critical resource for both academic research and public policy development. The accuracy and detail of the SINCA data underpin the reliability of the forecasts generated in this study.
2.2. Forecast model - SARIMA
Based on the general observation of air quality data in Santiago, the levels of pollutants such as PM2.5, PM10, NO₂, and O₃ exhibit clear seasonal trends, which are crucial for the modeling process. Several models are commonly used for time series prediction, including the SARIMA Model, ARIMA Model, Long-Short Term Memory (LSTM) networks, and Exponential Smoothing State Space Model (ETS).
The ARIMA model is suitable for adaptively fitting non-linear and non-stationary time series data, with capabilities for automatic optimal parameter selection and effective long-term forecasting. However, for time series with pronounced seasonal patterns, such as air pollutant concentrations influenced by weather changes and human activities, the SARIMA model is often preferred due to its inclusion of seasonal components.
While LSTM models capture complex non-linear relationships and are useful for air quality forecasting, they require extensive computational resources. ETS models offer a balance with their automatic model selection for data exhibiting level, trend, and seasonality.
Given that air pollutant levels in Santiago exhibit strong seasonal effects, such as higher concentrations of PM2.5 during the winter months, the SARIMA model is often the most appropriate choice for forecasting. It balances accuracy, interpretability, and computational efficiency, making it a reliable and proven method for air quality time series analysis. While LSTM models offer greater flexibility, the SARIMA model’s ability to clearly model seasonality, along with its established use in environmental forecasting, makes it the preferred approach for predicting air pollutant levels in Santiago.
2.3. Data processing and filtering
Environmental raw datasets often present challenges such as large volumes, disordered timestamps, missing data, and incompatible formats, and this dataset is no exception. The dataset is not ordered chronologically: for example, the date following 2020/9/30 is incorrectly listed as 2020/4/1 instead of the expected 2020/10/1. Such chronological inconsistencies are frequent throughout the raw dataset. The dataset only extends back to 2013, with significant data gaps between 2013 and 2016. Even during periods with relatively complete data, occasional missing entries still occur. These issues require thorough processing to obtain a dataset suitable for accurate analysis.
To address the data issues, several processing steps were carried out using Python, due to its ability to efficiently handle large datasets. First, the data was reorganized into the correct chronological order. Data from May 1, 2016, to May 31, 2024, was retained, as coverage before this period was insufficient. Linear interpolation was then applied to fill in occasional missing data points within this range.
However, linear interpolation can influence forecasting by imposing a consistent trend that may not reflect natural seasonal patterns, which is particularly problematic for the SARIMA model. To mitigate this, the data was processed further by converting daily values to monthly averages according to formula: \( daily average of each month = \frac{sum of daily values within the month}{number of days in the month} \) . While this adjustment preserves seasonal variations, it reduces the resolution of the data. The processed data was then prepared for forecasting in R-Studio (Table 1).
Table 1. Variable introduction
Date | PM2.5(µg/m³) | PM10(µg/m³) | O₃(ppb) | \( NO\_2 \) (ppb) | 2016/5/1 | 100.4194 | 46.51613 | 7.258065 | 33.59677 | 2016/6/1 | 94.7 | 47.7 | 6.416667 | 28.06667 | 2016/7/1 | 86.56452 | 43.51613 | 9.032258 | 29.70968 | 2016/8/1 | 97.80645 | 49.48387 | 20.67742 | 28.67742 | 2016/9/1 | 81 | 48.86667 | 28.7 | 15.96667 | 2016/10/1 | 53.41935 | 36.29032 | 35.64516 | 13.29032 | 2016/11/1 | 58.13333 | 44.46667 | 48.88333 | 14.53333 | 2016/12/1 | 84.98571 | 44.13333 | 58.13333 | 13.55 | 2017/1/1 | 98.73892 | 58.24138 | 81 | 11.96552 | 2017/2/1 | 60.28571 | 46.60714 | 50.82143 | 14.64286 | 2017/3/1 | 57.22581 | 54.83871 | 39.67742 | 18.41935 | 2017/4/1 | 60.06667 | 46.73333 | 27.73333 | 2.450249 | 2017/5/1 | 79.87097 | 44.80645 | 9.935484 | 21.56716 | 2017/6/1 | 78.83333 | 44 | 8.333333 | 43.06368 | 2017/7/1 | 86.76667 | 51.15 | 9.65 | 37.03333 | 2017/8/1 | 79.19355 | 43.70968 | 15.41935 | 30.48387 |
3. Results and discussion
3.1. PM2.5, PM10 and O₃
3.1.1. Data overview. The historical data for PM2.5, PM10, and ground-level ozone (O₃) concentrations in Santiago exhibits distinct seasonal patterns (as shown in Figure 1, 2 and 3). Both PM2.5 and PM10 peak during the winter months (June to October) due to increased emissions from residential heating, traffic, and industrial activities, exacerbated by temperature inversions that trap pollutants near the surface. PM2.5 concentrations typically range from 80 to 100 µg/m³, while PM10 peaks at 30 to 45 µg/m³. Both pollutants pose significant risks to public health, with studies indicating their potential to harm the respiratory system [9, 10] and even impair cognitive function [11].
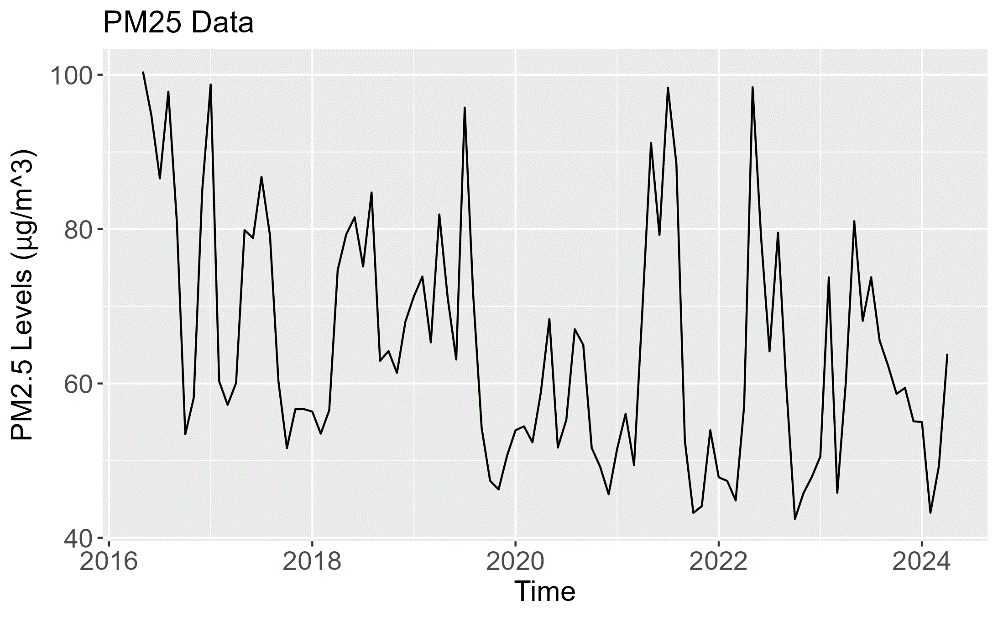
Figure 1. An overview of the Daily Average PM2.5 data (μg/m³) from May 2016 to May 2024.
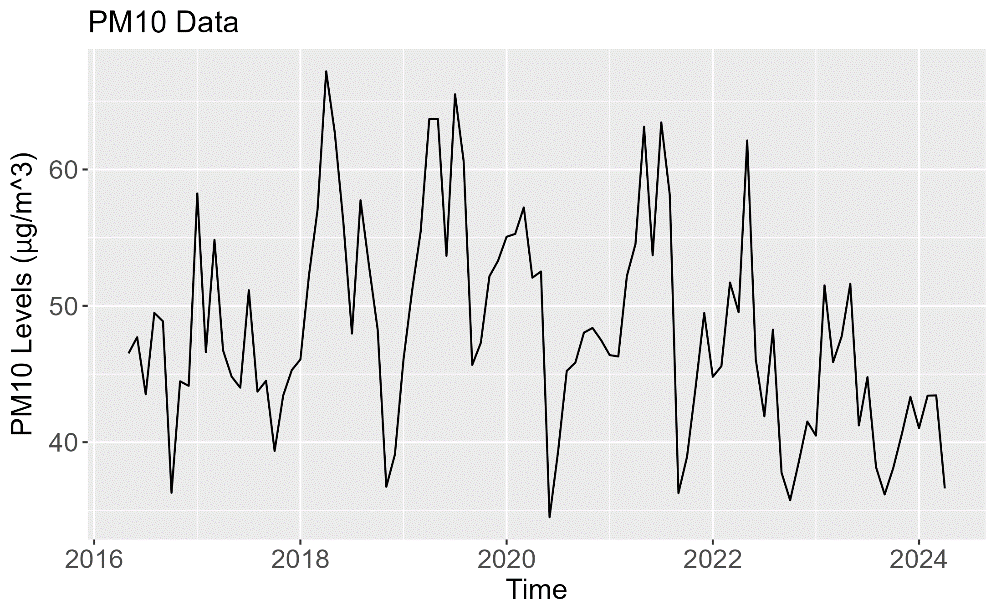
Figure 2. An overview of the Daily Average PM10 data (μg/m³) from May 2016 to May 2024.
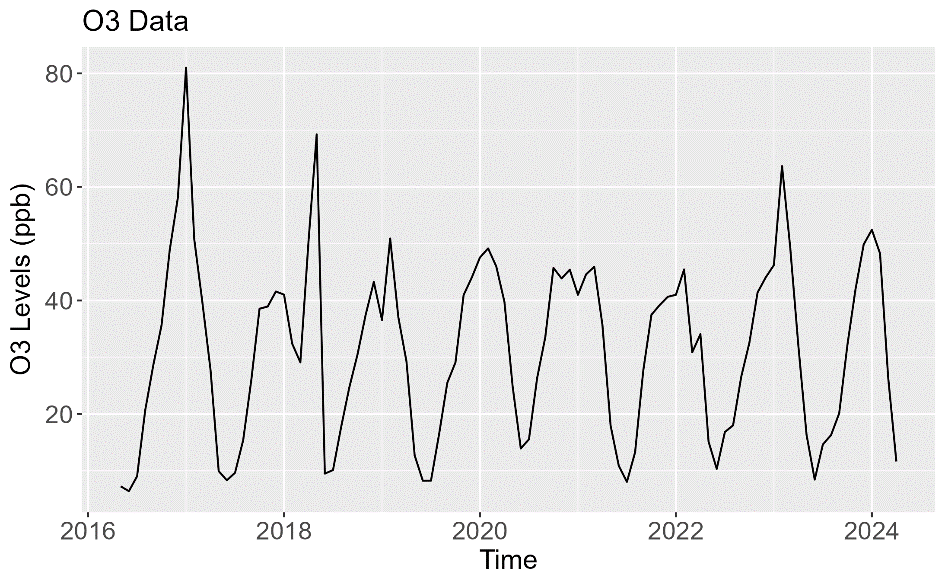
Figure 3. An overview of the Daily Average O₃ data (ppb) from May 2016 to May 2024.
In contrast, O₃ levels peak during the summer months (December to February), driven by stronger solar radiation, which accelerates photochemical reactions between NOx and VOCs. O₃ concentrations generally range between 7 and 81 ppb. Although ozone levels usually remain within safe limits, periods of elevated concentrations highlight the need for ongoing monitoring and control measures.
3.1.2. 12-Month SARIMA forecast for PM2.5. The SARIMA model was applied to forecast the concentrations of PM2.5, PM10, and O₃ for the period from June 2024 to May 2025. The forecast indicates that PM2.5 and PM10 levels (as shown in Figure 4 and 5) will continue to exhibit their typical seasonal cycles, with notable peaks during the winter months when emissions from heating and traffic are highest [9].
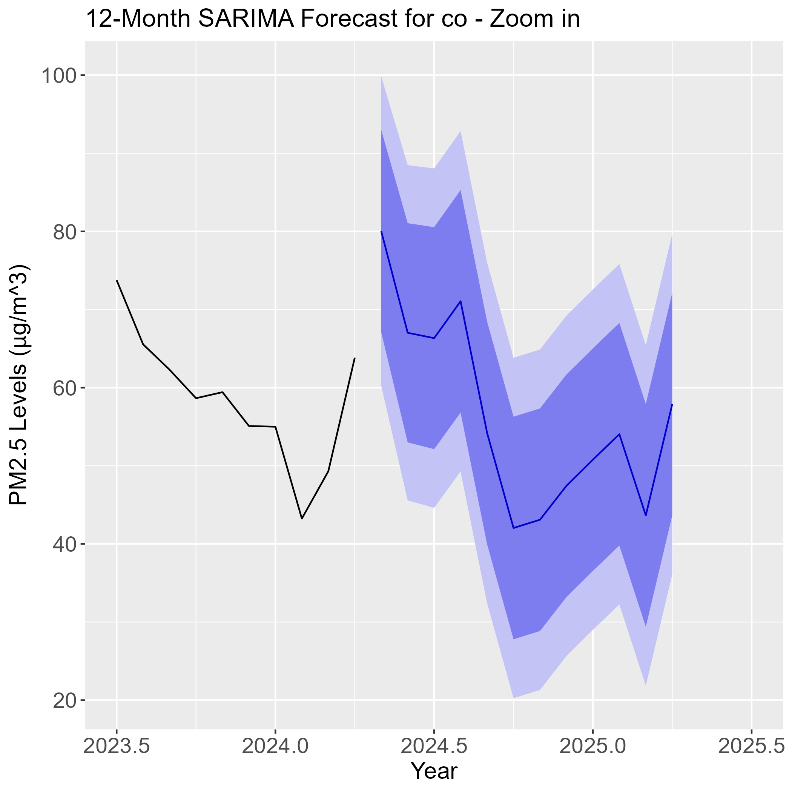
Figure 4. SARIMA Forecast of the Daily Average PM2.5 data (μg/m³) for June 2024 to May 2025.
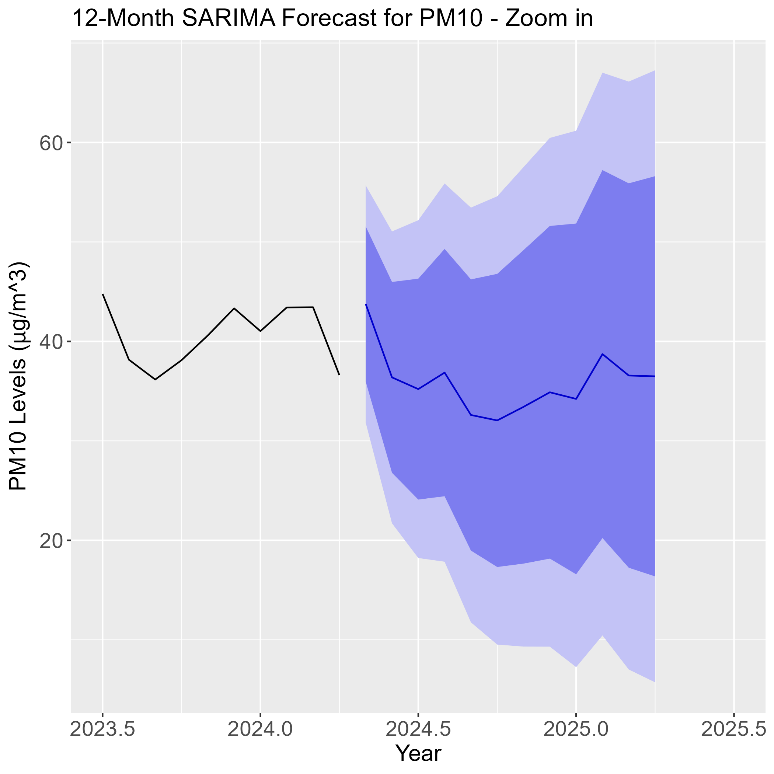
Figure 5. SARIMA Forecast of the Daily Average PM10 data (μg/m³) for June 2024 to May 2025.
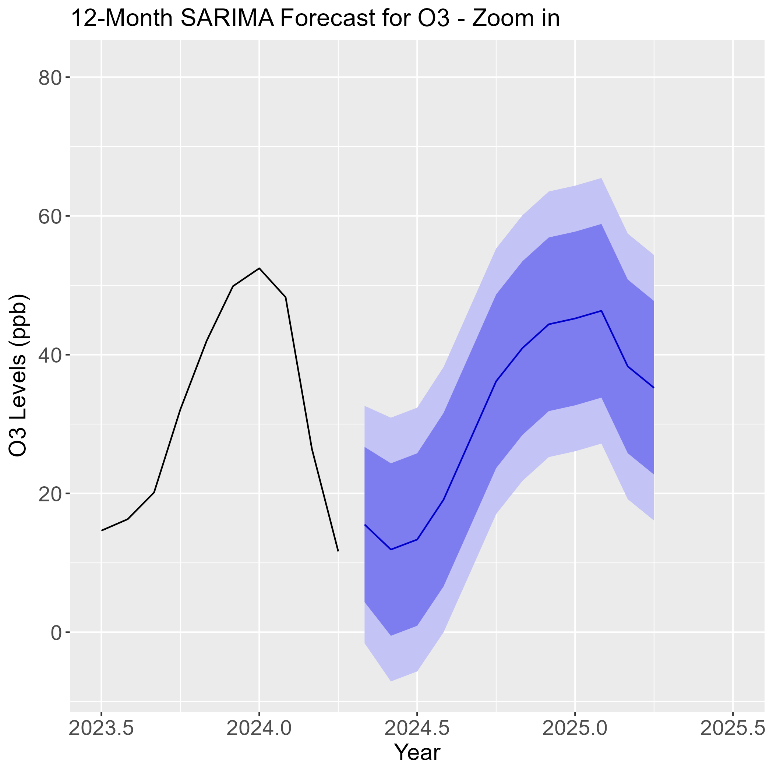
Figure 6. SARIMA Forecast of the Daily Average O₃ data (ppb) for June 2024 to May 2025.
Specifically, PM2.5 concentrations are expected to peak around 70 µg/m³ during winter, while PM10 levels are predicted to range between 30 and 45 µg/m³ during the same period. This slight decrease in peak PM2.5 levels compared to historical data suggests a possible gradual improvement in air quality, assuming current mitigation efforts continue [9]. Dark blue shaded area indicates higher confidence while the light one indicates lower confidence.
For O₃, as shown in Figure 6, the model forecasts a seasonal rise during the summer months, with levels expected to reach a peak of 46 ppb around January 2025. This trend aligns with past data and reflects the typical influence of higher solar radiation on ozone formation. While O₃ levels are projected to remain in a safe range, the forecast underscores the importance of reducing NOx and VOC emissions during warmer months to prevent ozone spikes.
Confidence intervals for all three pollutants suggest some uncertainty, especially regarding the precise peak levels. Nonetheless, the forecasts provide valuable insights into the expected seasonal patterns and highlight the ongoing need for interventions during periods of elevated pollution.
3.1.3. Residual analysis. As shown in Figure 7, 8 and 9, the residual analysis for PM2.5, PM10, and O₃ concentrations reveals that the SARIMA model performs well in capturing the seasonal trends for each pollutant. Residuals fluctuate around zero, indicating that the model accurately reflects the underlying data patterns. The autocorrelation function (ACF) plot for each pollutant shows minimal correlation between residuals, confirming that the model effectively accounts for the primary seasonal factors influencing air quality in Santiago.
However, the presence of occasional outliers in the residuals suggests that certain pollution events or unexpected variations were not fully captured by the model. These deviations could stem from factors such as sudden weather changes, episodic industrial emissions, or specific pollution episodes that are not part of the regular seasonal cycle. The histogram of residuals for all three pollutants follows an approximately normal distribution, though some deviations at the tails indicate potential areas for refinement. Despite these minor shortcomings, the SARIMA model provides reliable forecasts for air quality trends, and further model adjustments could enhance its accuracy, particularly in accounting for unpredictable events.
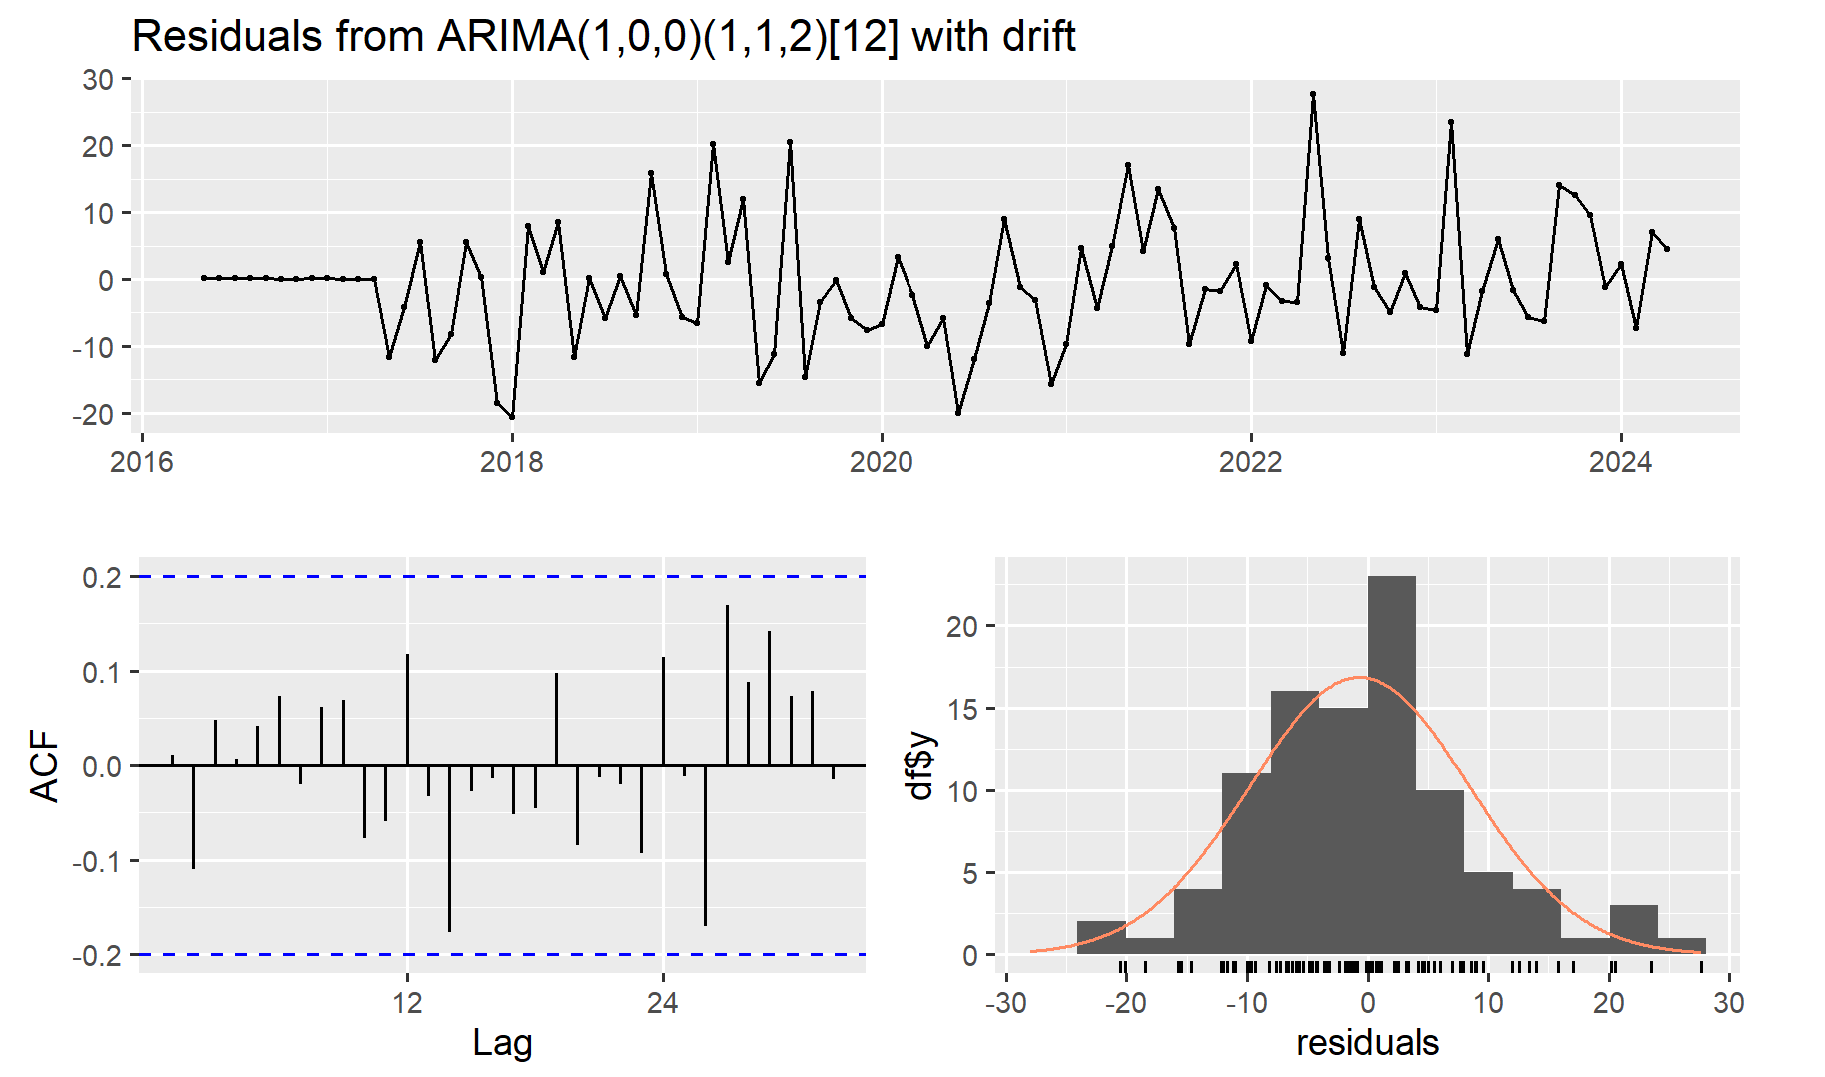
Figure 7. Residuals from SARIMA for PM2.5 data
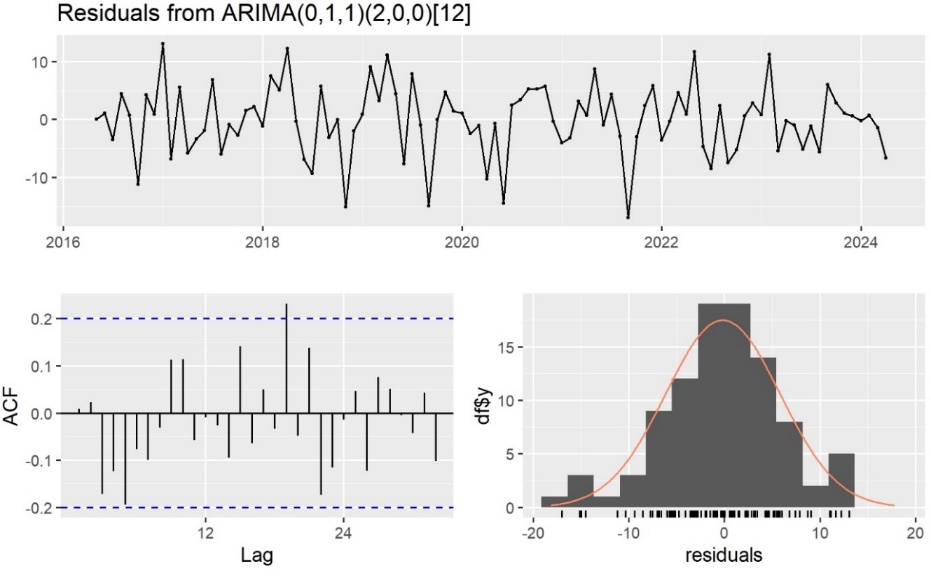
Figure 8. Residuals from SARIMA for PM10 data

Figure 9. Residuals from SARIMA for O₃ data
3.2. NO₂
The historical data for nitrogen dioxide (NO₂) concentrations (Figure 10) in Santiago displays a clear seasonal pattern, with peaks during the colder months. A significant shift is observed starting in 2020, when NO₂ levels dropped from a peak of 71 ppb in 2019 to 23 ppb in 2020. This decrease is likely a result of the COVID-19 pandemic, which caused a reduction in industrial activity and transportation due to lockdown measures.
Beyond the temporary impact of the pandemic, this reduction in NO₂ may also reflect the effects of ongoing air quality management efforts. However, NO₂ levels remain above a healthy range, indicating that air quality still poses health risks, particularly during peak periods in winter.
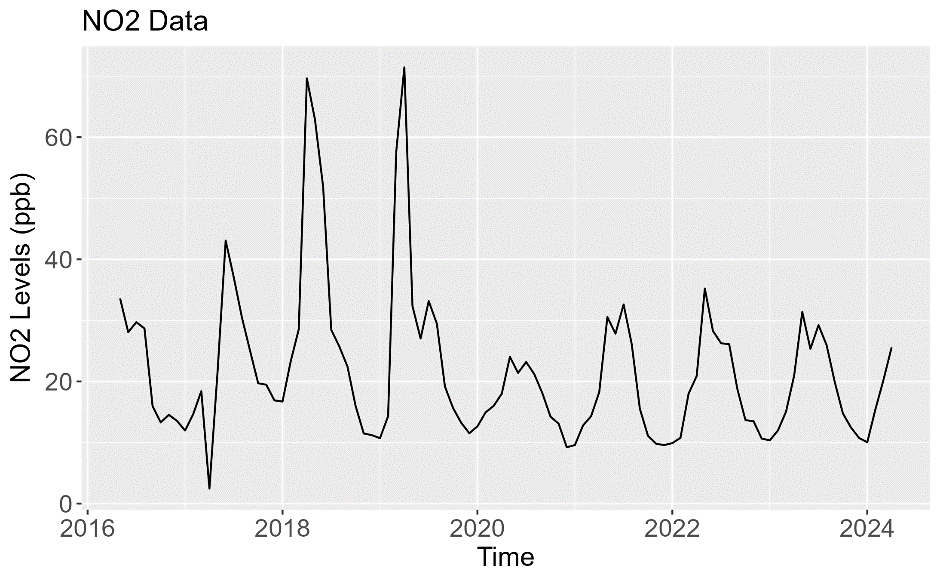
Figure 10. An overview of the Daily Average NO₂ data (ppb) from May 2016 to May 2024.
The SARIMA model forecast (Figure 11) for NO₂ concentrations over the next 12 months suggests that the seasonal pattern will persist, with higher levels expected in winter. However, the forecasted values remain lower than pre-2020 levels, reflecting the sustained impact of recent air quality interventions. The trend suggests that, if current regulations continue, NO₂ concentrations may stabilize at reduced levels, highlighting the effectiveness of environmental policies in Santiago.
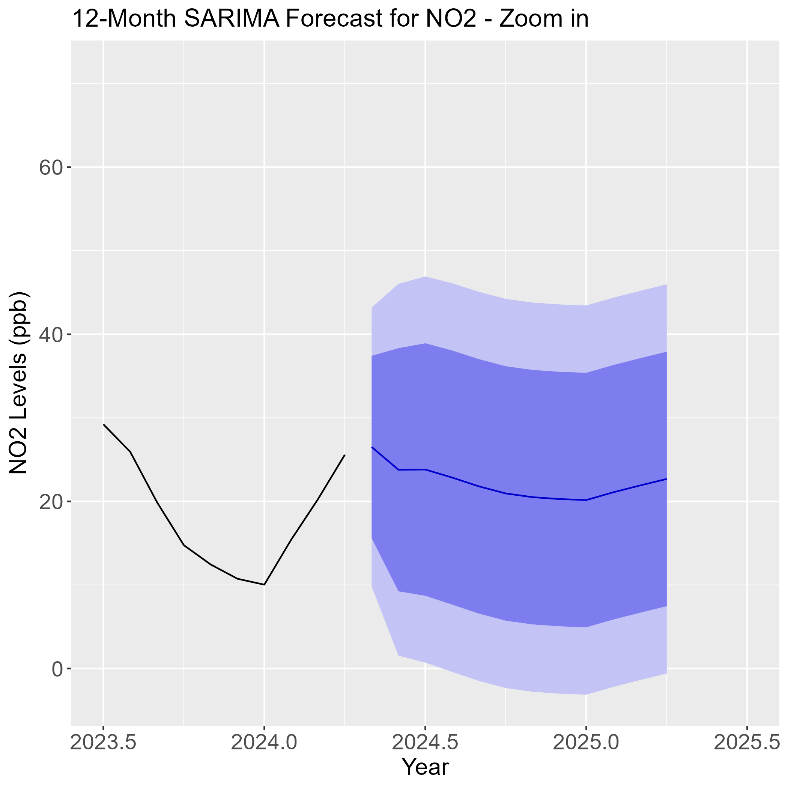
Figure 11. SARIMA Forecast of the Daily Average NO₂ data (ppb) for June 2024 to May 2025.
In the residuals plot (Figure 12). the ACF plot reveals some lingering correlations, suggesting that certain seasonal effects or external factors were not fully captured by the model. The histogram approximates a normal distribution but shows deviations at the extremes as well. While these residuals suggest areas for refinement to improve its accuracy, the SARIMA model still provides a reliable forecast as the residuals generally centred around zero.
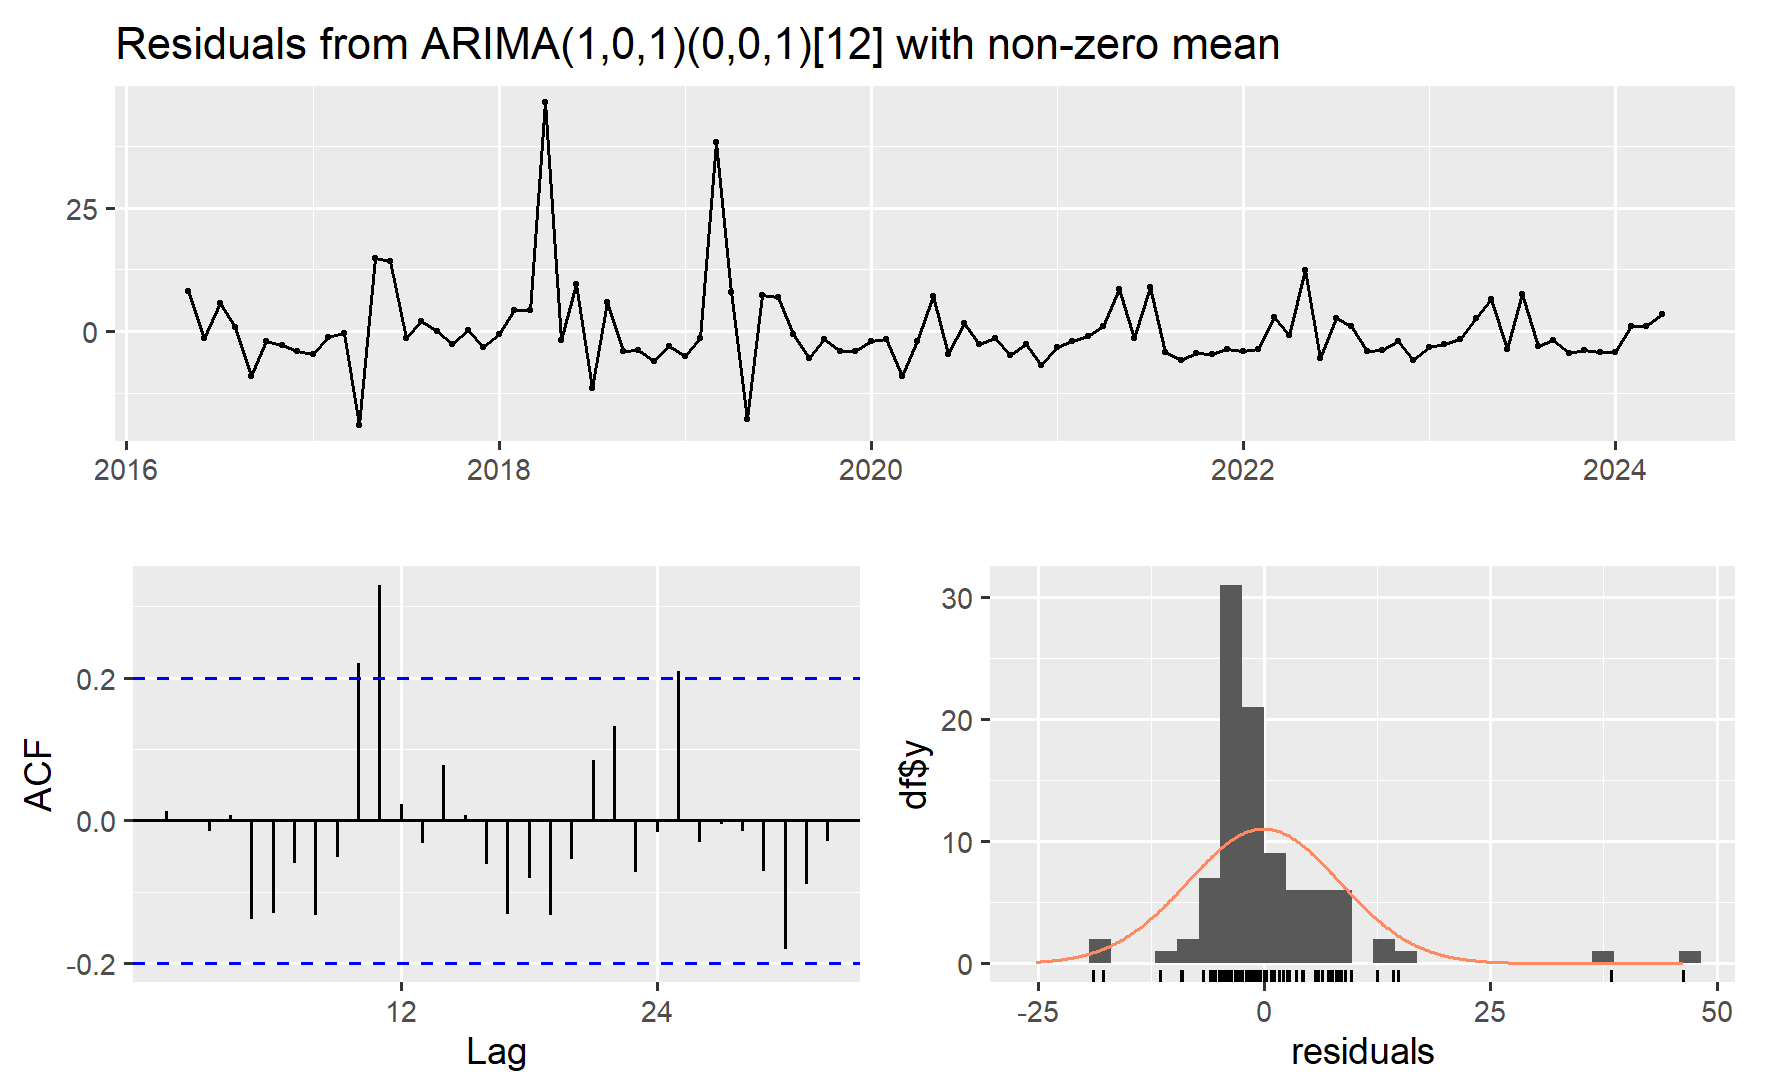
Figure 12. Residuals from SARIMA for NO₂ data
4. Conclusion
This study provides a comprehensive analysis of Santiago's air quality by employing the Seasonal Autoregressive Integrated Moving Average (SARIMA) model to forecast the concentrations of key pollutants, including PM2.5, PM10, NO₂ and O₃ over the next 12 months. The results highlight the ongoing challenges the city faces in managing air quality, particularly during the colder months when pollutant levels tend to peak due to seasonal factors such as increased residential heating and atmospheric conditions that trap pollutants close to the ground.
The analysis indicates that while there have been some improvements in air quality, particularly with a notable reduction in NO₂ levels since 2020, likely influenced by the COVID-19 pandemic and ongoing air quality management efforts, the overall trends suggest that Santiago continues to struggle with maintaining pollutant levels within healthy limits. The forecasted data reinforces the need for targeted interventions during high-pollution periods, particularly in the winter months, to mitigate the health impacts of elevated pollutant concentrations.
By predicting future air quality trends, policymakers and public health officials can better prepare for and respond to periods of high pollution, ultimately safeguarding the health and well-being of Santiago's residents. Actions such as implementing stricter emission standards for vehicles and industrial sources, particularly diesel engines which are significant contributors to NO₂ and PM levels; promoting cleaner heating solutions such as electric or natural gas heating instead of traditional wood stoves; expanding public transportation systems including electric buses and subway lines; and introducing low-emission zones or vehicle usage restrictions during peak pollution periods can be considered.
In conclusion, the SARIMA model has proven to be a valuable tool in understanding and forecasting air quality trends, providing actionable insights that can help guide future efforts to achieve cleaner air in Santiago.
References
[1]. Gramsch E, et al. 2006 Examination of pollution trends in Santiago de Chile with cluster analysis of PM10 and Ozone data. Atmospheric Environment, 40, 5464-5475.
[2]. Cifuentes L, et al. 2001 Hidden health benefits of greenhouse gas mitigation. Science, 293, 1257.
[3]. Ji J S, et al. 2022 NO2 and PM2.5 air pollution co-exposure and temperature effect modification on pre-mature mortality in advanced age: a longitudinal cohort study in China. Environ Health, 21(1), 97.
[4]. Blanco J 2016 Sustainable urban development in Chile: paths to introduce sustainability rating systems for neighborhoods. J Architectural and Planning Research, 33, 251-270.
[5]. Borsdorf A and Hidalgo R 2010 From polarization to fragmentation. Recent Changes in Latin American urbanization Decentralized Development in Latin America. Dordrecht: Springer, 23-34.
[6]. Gallardo L, et al. 2018 Evolution of air quality in Santiago: The role of mobility and lessons from the science-policy interface. Elementa: Science of the Anthropocene, 38.
[7]. Villacura L, et al. 2024 An overview of air pollution research in Chile: Bibliometric analysis and scoping review, challenger and future directions. Heliyon, 10, 3.
[8]. Toro R A, et al. 2021 Air pollution and COVID-19 lockdown in a large South American city: Santiago Metropolitan Area. Chile Urban Climate, 36.
[9]. Jorquera H 2020 Ambient particulate matter in Santiago, Chile: 1989-2018: A tale of two size fractions. J Environmental Management, 258.
[10]. Pope C A 2006 Health effects of fine particulate air pollution: lines that connect. J Air Waste Manag Assoc, 56.
[11]. Tang Y, et al. 2024 Causal Effects of PM2.5, NOx, and NO2 on Cognitive Function: A Two-sample Mendelian Randomization Study. Aerosol and Air Quality Research, 24, 230326.
Cite this article
Guan,Y. (2024). A Comprehensive Analysis of Santiago's Air Quality Forecasts Using SARIMA Model. Theoretical and Natural Science,42,95-104.
Data availability
The datasets used and/or analyzed during the current study will be available from the authors upon reasonable request.
Disclaimer/Publisher's Note
The statements, opinions and data contained in all publications are solely those of the individual author(s) and contributor(s) and not of EWA Publishing and/or the editor(s). EWA Publishing and/or the editor(s) disclaim responsibility for any injury to people or property resulting from any ideas, methods, instructions or products referred to in the content.
About volume
Volume title: Proceedings of the 2nd International Conference on Mathematical Physics and Computational Simulation
© 2024 by the author(s). Licensee EWA Publishing, Oxford, UK. This article is an open access article distributed under the terms and
conditions of the Creative Commons Attribution (CC BY) license. Authors who
publish this series agree to the following terms:
1. Authors retain copyright and grant the series right of first publication with the work simultaneously licensed under a Creative Commons
Attribution License that allows others to share the work with an acknowledgment of the work's authorship and initial publication in this
series.
2. Authors are able to enter into separate, additional contractual arrangements for the non-exclusive distribution of the series's published
version of the work (e.g., post it to an institutional repository or publish it in a book), with an acknowledgment of its initial
publication in this series.
3. Authors are permitted and encouraged to post their work online (e.g., in institutional repositories or on their website) prior to and
during the submission process, as it can lead to productive exchanges, as well as earlier and greater citation of published work (See
Open access policy for details).
References
[1]. Gramsch E, et al. 2006 Examination of pollution trends in Santiago de Chile with cluster analysis of PM10 and Ozone data. Atmospheric Environment, 40, 5464-5475.
[2]. Cifuentes L, et al. 2001 Hidden health benefits of greenhouse gas mitigation. Science, 293, 1257.
[3]. Ji J S, et al. 2022 NO2 and PM2.5 air pollution co-exposure and temperature effect modification on pre-mature mortality in advanced age: a longitudinal cohort study in China. Environ Health, 21(1), 97.
[4]. Blanco J 2016 Sustainable urban development in Chile: paths to introduce sustainability rating systems for neighborhoods. J Architectural and Planning Research, 33, 251-270.
[5]. Borsdorf A and Hidalgo R 2010 From polarization to fragmentation. Recent Changes in Latin American urbanization Decentralized Development in Latin America. Dordrecht: Springer, 23-34.
[6]. Gallardo L, et al. 2018 Evolution of air quality in Santiago: The role of mobility and lessons from the science-policy interface. Elementa: Science of the Anthropocene, 38.
[7]. Villacura L, et al. 2024 An overview of air pollution research in Chile: Bibliometric analysis and scoping review, challenger and future directions. Heliyon, 10, 3.
[8]. Toro R A, et al. 2021 Air pollution and COVID-19 lockdown in a large South American city: Santiago Metropolitan Area. Chile Urban Climate, 36.
[9]. Jorquera H 2020 Ambient particulate matter in Santiago, Chile: 1989-2018: A tale of two size fractions. J Environmental Management, 258.
[10]. Pope C A 2006 Health effects of fine particulate air pollution: lines that connect. J Air Waste Manag Assoc, 56.
[11]. Tang Y, et al. 2024 Causal Effects of PM2.5, NOx, and NO2 on Cognitive Function: A Two-sample Mendelian Randomization Study. Aerosol and Air Quality Research, 24, 230326.