


1.Introduction
The construction of Taipei 101 was a collaborative endeavor between private enterprises and government, resulting in a total investment of 58 billion Taiwanese dollars. This construction spanned approximately seven years. Standing at a height of 508 meters, Taipei 101 boasts 101 floors above ground, with its foundation rooted in a square base. This base has 100 meters in width, occupying an area of 30,277 square meters [2]. The sheer mass of Taipei 101 reaches about 700,000 tons. Its lower levels, comprising the bottom six floors along with the first floor, are dedicated to a shopping mall known as the Podium. As heights becomes bigger, the usage of floors transitions from retail to professional conference rooms and residential houses. Above the 26th floor, Taipei 101 adopts an innovative structural design, with every eight floors forming an independent structural unit. This structure is repeated eight times throughout the building, ensuring stability, resilience, and flexibility when encountering natural forces or any potential structural stresses. From the 91st to the 101st floor, Taipei 101’s area significantly reduced to spire-like silhouette. This tapering design not only adds uniqueness to the building's appearance but also serves to reduce wind load and enhance structural efficiency [3].
In the pursuit of architectural excellence and structural resilience, the designers of Taipei 101 comprised innovative features such as "saw tooth" and "double notch" corners. These unique design elements effectively reduce the impact of strong winds, ensuring the stability and safety of the Taipei 101 building [4]. Furthermore, a massive damper system was employed to significantly enhance the building's seismic resistance [5].
Previous researches surrounding Taipei 101 have mainly focused on its complex structural design. Scholars have studied the analysis of the building's lateral load resisting system and lateral system stiffness, aiming to examine how these elements contribute to its overall stability [6]. Additionally, research has focused on observing the creep strain and shrinkage phenomena within the structure, providing valuable insights into its material behavior over time.
Recognizing the lack of research specifically addressing the dynamic vibration and natural frequency of Taipei 101 building, we carried out this research. This investigation aims to fill the gap in existing knowledge and lay solid foundation for the building's response to dynamic loading, further enhancing our understanding of its overall performance.
ANSYS is introduced to analyse the vibration in different modes using finite element method. Şimon-Marinică, A.B., Vlasin, N.-I., Manea, F. and Florea, G.-D [7] stated that “The Finite Element Analysis method, is a powerful computational technique for approximate solutions to a variety of real – world engineering problems having complex domains subjected to general boundary conditions. The method itself has become an essential step in the design or modelling of a physical phenomenon in various engineering disciplines.”
2.Construction
2.1.Model Establishment
In all, the model of Taipei 101 building is constructed step by step. This model is composed with 12 parts, in which 8 parts are the same. The first component shown in Figure 1(a) is the base of the whole tower.
|
|
|
|
|
|
(a) |
(b) |
(c) |
|
|
|
|
||
|
(d) |
(e) |
||
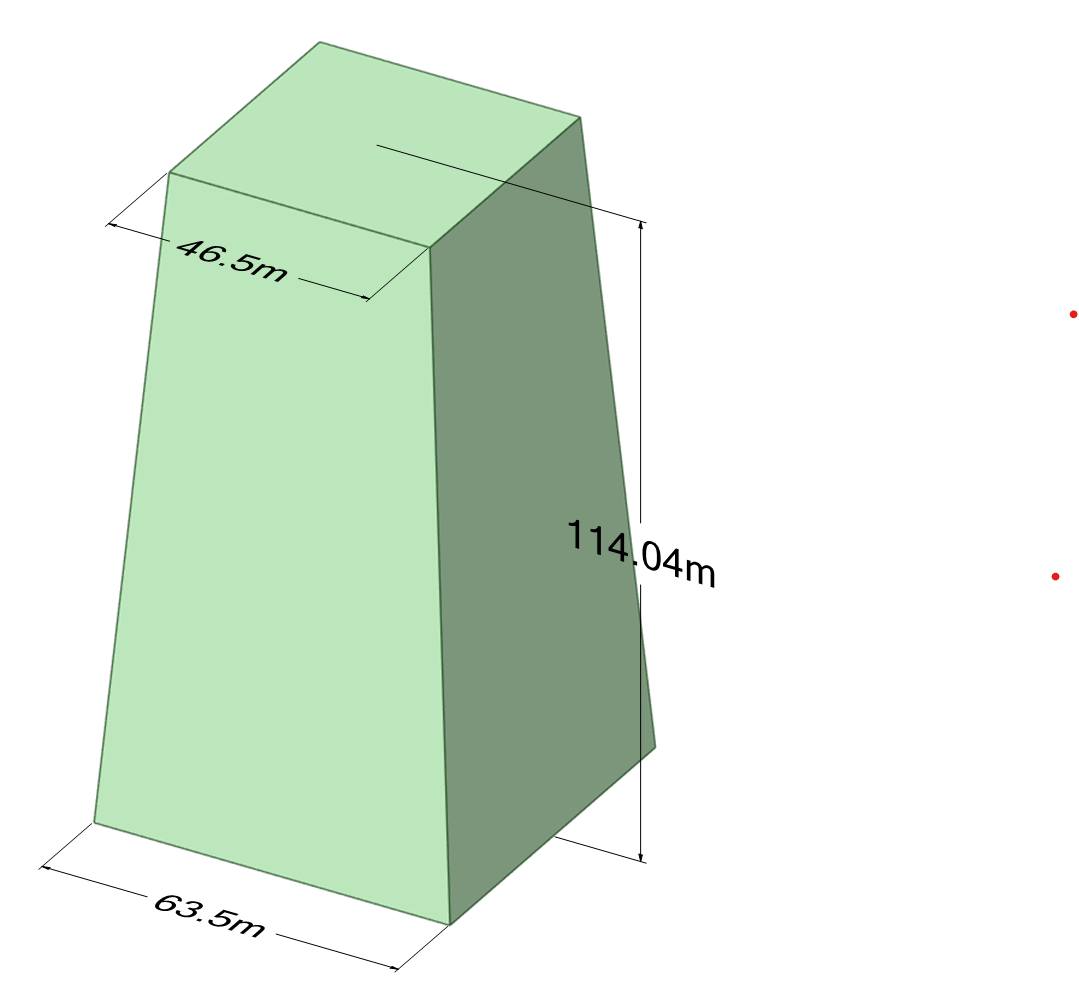
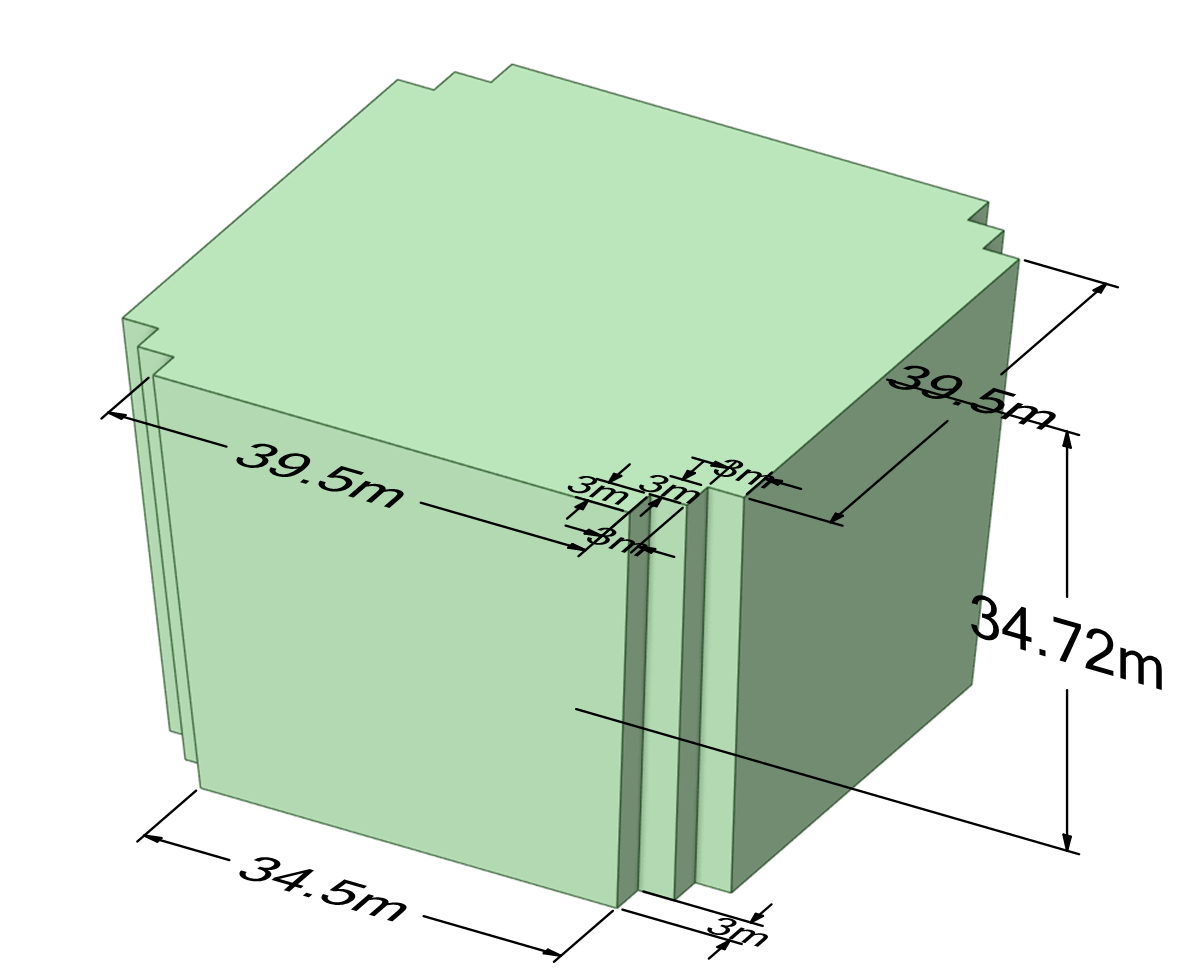
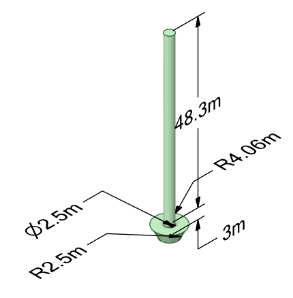
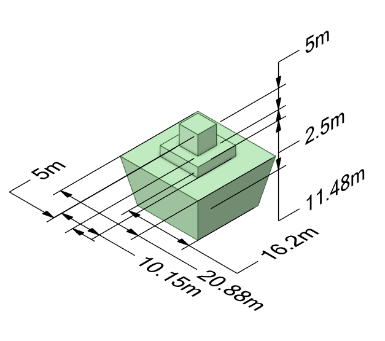
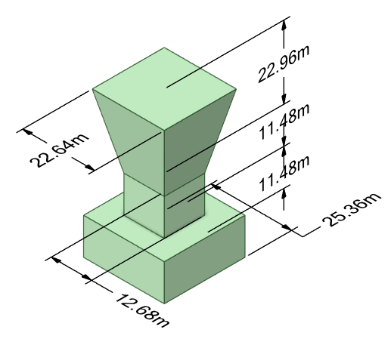
Figure 1. Taipei 101 building.
The second component shown in Figure 1(b) is the block of tower. Due to its unique shape and the specific design of the building, this component is repeated eight times.
The third component shown in Figure 1(c) is the top part of spire. It is made up of a cylinder and an upturned circular truncated cone.
The fourth component shown in Figure 1(d) is the middle part of spire. It has three parts in total.
The fifth component shown in Figure 1(e) is the bottom part of spire. It has two cuboids in different size and an upturned terrace.
Finally, after constructing all the components, their locations are adjusted and arranged separately. Then the whole tower is combined shown in Figure 2.
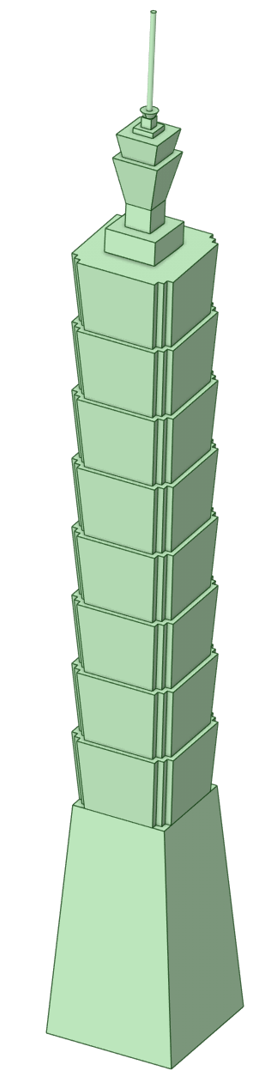
Figure 2. Model of Taipei 101 building.
2.2.Material Settings
The main material of the Taipei 101 building is structural steel, decorating with glass as its curtain wall. The actual total weight is 700,000 tons (excluding the foundation), and the volume of the model is 1006465.7858 m^3. Structural steel was chosen as the only material in this simulation. As a simplification, the equivalent density of the model was set. It equals to the actual mass of the building divided by the model volume shown (see Equation (1)):
\( ρ=\frac{M}{V}=\frac{700000000}{1006465.7858}≈695.5 kg/{m^{3}} \)(1)
Other properties of structural steel have been adjusted as follows (see Table 1):
Table 1. Material Settings.
|
Material |
Structural Steel |
|
Volume |
1006465.7858\( {m^{3}} \) |
|
Mass |
700,000 ton |
|
Density |
695.5\( kg/{m^{3}} \) |
|
Young’s Modulus |
5\( ×{10^{9}} \)Pa |
|
Poisson’s Ratio |
0.3 |
|
Bulk Modulus |
4.1667\( ×{10^{9}} \)Pa |
|
Shear Modulus |
1.9231\( ×{10^{9}} \)Pa |
2.3.Boundary Conditions
The tower had a basement. The floors beneath the ground are ignored and the first floor is set as the fixed spot shown in Figure 3.
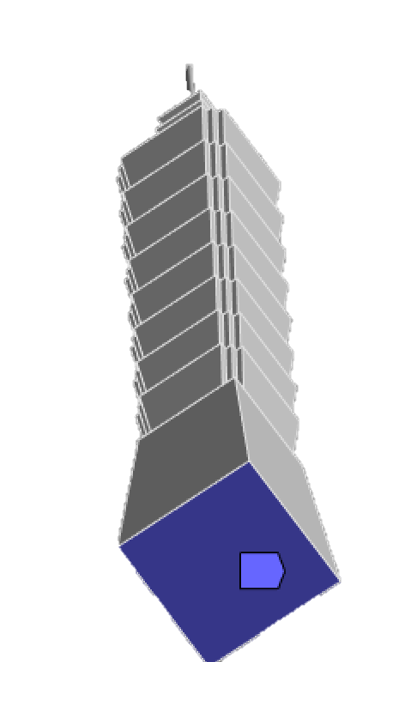
Figure 3. Boundary Conditions.
2.4.Mesh Generation
Appropriate mesh generation is the key to accurate model analysis. A test is operated to show the relationship between different mash sizes and the frequency of Taipei 101 building. The chart is shown in Figure 4.
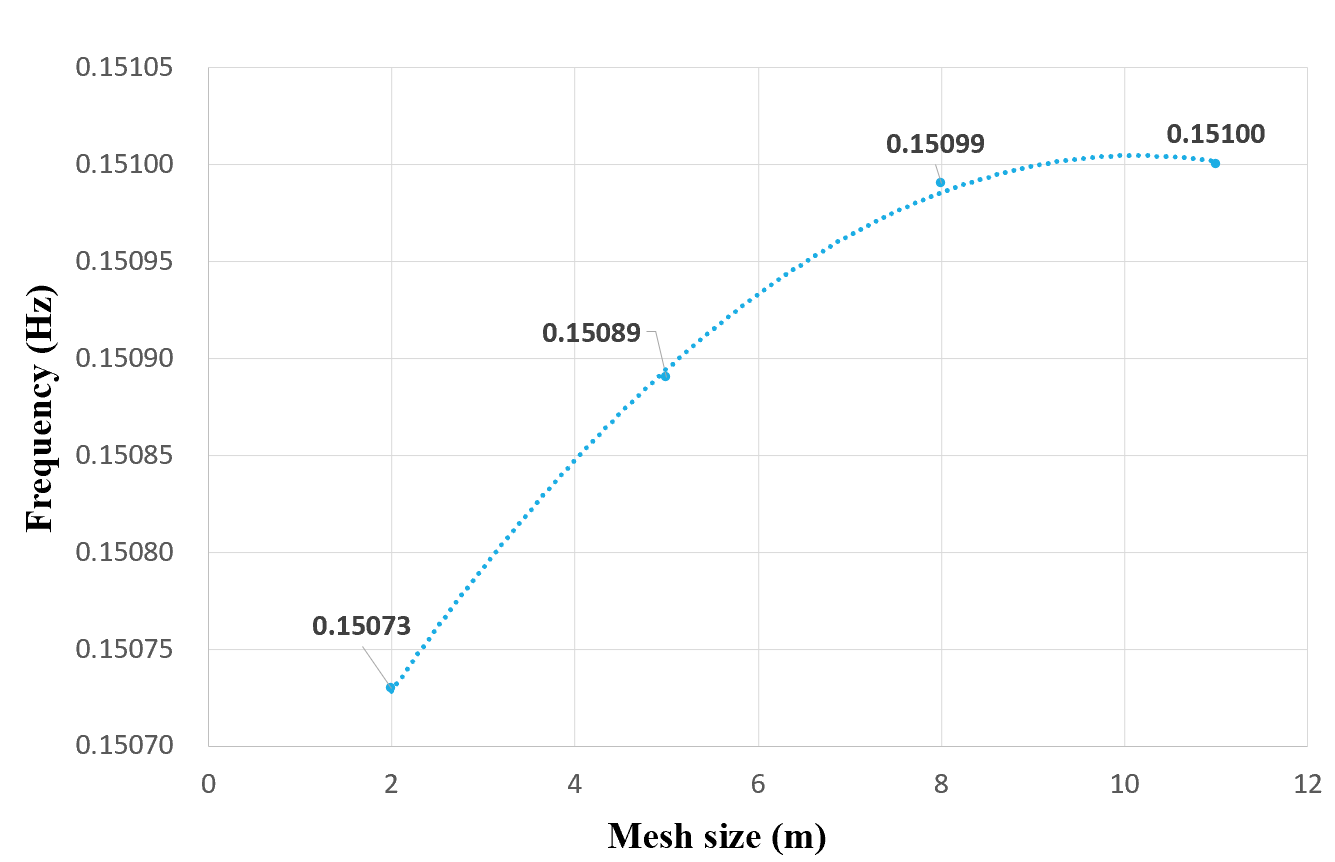
Figure 4. Mesh convergence study.
What can be told from the trend is that with the decrease of the mass size, the analysis becomes more accurate and precise, and the frequency tends to one certain figure. Considering the capability of the software and the accuracy of frequency, the eight metre grids were chosen as our model shown in Figure 5.
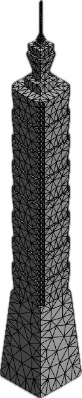
Figure 5. Mesh of Taipei 101 building.
3.Results
The model analysis results were obtained by Ansys Student Version. Analysis and comparison results are under 4 different grid densities shown in Figure 6 and Tables 2-5.
|
|
|
|
(a) 11-meter grid model (mode 1). |
(b) 8-meter grid model (mode 1). |
|
|
|
|
(c) 5-meter grid model (mode 1). |
(d) 2-meter grid model (mode 1). |
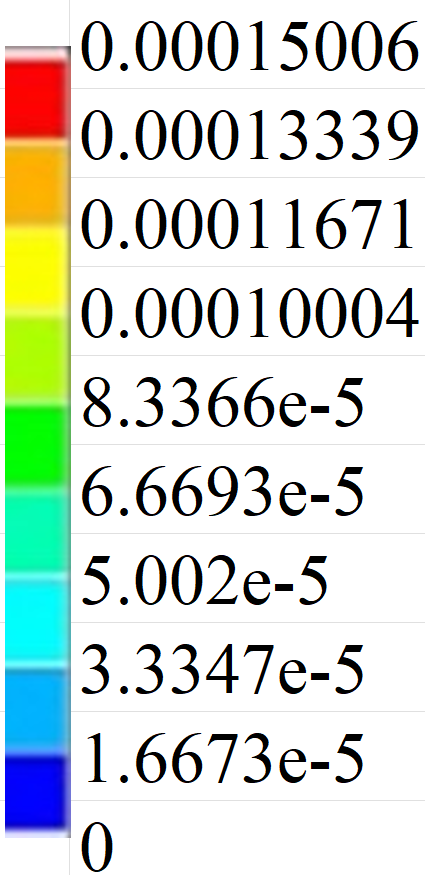

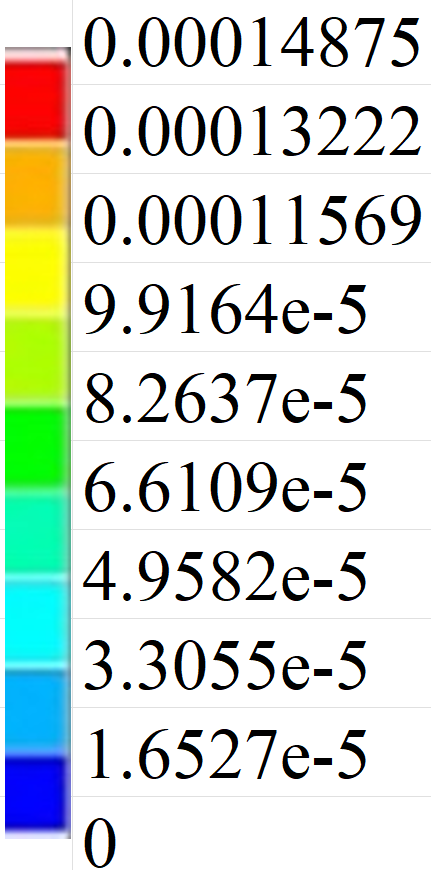

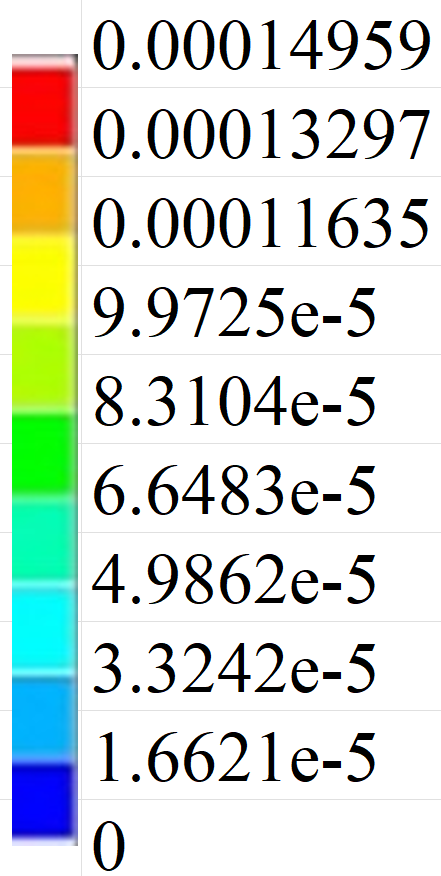


Figure 6. Meter grid model.
Table 2. Frequencies of 11-meter grid model in 6 modes.
|
Mode |
Frequency (Hz) |
|
1 |
0.15100 |
|
2 |
0.15101 |
|
3 |
0.37395 |
|
4 |
0.38709 |
|
5 |
0.79915 |
|
6 |
0.79941 |
Table 3. Frequencies of 8-meter grid model in 12 modes.
|
Mode |
Frequency (Hz) |
|
1 |
0.15099 |
|
2 |
0.15100 |
|
3 |
0.37954 |
|
4 |
0.38738 |
|
5 |
0.79936 |
|
6 |
0.79954 |
|
7 |
1.10090 |
|
8 |
1.45480 |
|
9 |
1.45910 |
|
10 |
1.76740 |
|
11 |
2.17730 |
|
12 |
2.17980 |
Table 4. Frequencies of 5-meter grid model in 6 modes.
|
Mode |
Frequency (Hz) |
|
1 |
0.15089 |
|
2 |
0.15089 |
|
3 |
0.38135 |
|
4 |
0.38425 |
|
5 |
0.79797 |
|
6 |
0.79807 |
Table 5. Frequencies of 2-meter grid model in 6 modes.
|
Mode |
Frequency (Hz) |
|
1 |
0.15073 |
|
2 |
0.15073 |
|
3 |
0.37699 |
|
4 |
0.38125 |
|
5 |
0.79617 |
|
6 |
0.79622 |
Compared by changing the grid size, the result showed that the smaller the grid division, the closer the results obtained are to the actual value shown in Figure 7 and Table 6.

Figure 7. Meter grid model.
Table 6. Maximum Deformation at Different Frequencies (8-meter grid model).
|
Frequency (Hz) |
Maximum Deformation (m) |
|
0.15099 |
0.00014875 |
|
0.37954 |
0.00497820 |
|
0.79936 |
0.00028289 |
Based on data statistics of 8-meter grid model, this research shows a trend of frequency and amplitude: the higher the frequency, the greater the amplitude.
4.Conclusion
Based on the results and discussions presented above, the conclusions are obtained as below: (1) Deformation analysis was performed under 8-meter grid model natural frequencies ranging from 0.15 Hz to 0.80 Hz, the total deformation was from 0.00015 m to 0.00028 m. (2) Deformation analysis performed under 8-meter grid model has nearly the same natural frequency as the real Taipei 101 building. The simulation is quite good. (3) The higher the vertical height of the component, the bigger the degree of deformation. The evaluation can be assessed in the following aspects:In the initial modelling, due to the complicated dynamic characteristics and the study's current range limitation, the Tuned Mass Damper (TMD) was omitted. However, it is acknowledged that adding a TMD into the later model and revising its internal structure can significantly improve its capacity for real-life condition simulation [8,9]. This enhancement would allow this model to predict the dampening influence of TMD towards structural vibrations. Therefore, the understanding of the system's dynamic response patterns can be more comprehensive [10]. The current model was approached as a solid entity, without considering its internal layout. This approach ignored detailed aspects, especially the steel pillars, which are vital for assessing this structure’s stability. To fill in this gap, future research will concentrate on refining the model to simulate these components more accurately. By incorporating these details, the modelling of complex internal structures will achieve higher precision and accuracy. As a result, this modelling is expected to be closer to the actual situation, facilitating subsequent stress analysis. This modified method aims to provide more useful predictions and design suggestions for practical applications.
References
[1]. Lin, C.-H. 2005. Seismicity increases after the construction of the world’s tallest building: An active blind fault beneath the Taipei 101. Geophysical research letters. 32(22), pp. L22313-n/a.
[2]. Chen, K.-C., Wang, J.-H., Huang, B.-S., Liu, C.-C. and Huang, W.-G. 2012. Vibrations of the TAIPEI 101 skyscraper caused by the 2011 Tohoku earthquake, Japan. Earth, planets, and space. 64(12), pp.1277–1286.
[3]. "Taipei 101 Building", Structural Engineering Construction Record. (n.d.). Retrieved July 21, 2024, from ws.moi.gov.tw
[4]. Ding, F. and Kareem, A. 2020. Tall Buildings with Dynamic Facade Under Winds. Engineering (Beijing, China). 6(12), pp.1443–1453.
[5]. Dennis Poon et al. (2004), Structural Design of Taipei 10, the World’s Tallest Building. from global.ctbuh.org
[6]. Zhi, L., Li, Q.S. and Fang, M. 2016. Identification of Wind Loads and Estimation of Structural Responses of Super-Tall Buildings by an Inverse Method. Computer-aided civil and infrastructure engineering. 31(12), pp.966–982.
[7]. Şimon-Marinică, A.B., Vlasin, N.-I., Manea, F. and Florea, G.-D. 2021. Finite element method to solve engineering problems using ansys. MATEC Web of Conferences. 342, pp.1015.
[8]. Caicedo, D., Lara-Valencia, L., Blandon, J. and Graciano, C. 2021. Seismic response of high-rise buildings through metaheuristic-based optimization using tuned mass dampers and tuned mass dampers inerter. Journal of Building Engineering. 34, pp.101927.
[9]. Greco, R., Marano, G.C. and Fiore, A. 2016. Performance-cost optimization of tuned mass damper under low-moderate seismic actions. The structural design of tall and special buildings. 25(18), pp.1103–1122.
[10]. Chung, L.L., Wu, L.Y., Lien, K.H., Chen, H.H. and Huang, H.H. 2013. Optimal design of friction pendulum tuned mass damper with varying friction coefficient. Structural control and health monitoring. 20(4), pp.544–559.
Cite this article
Chen,K.;Li,R.;Xi,Y. (2024). Modeling and Analysis of Taipei 101 Building Based on ANSYS. Theoretical and Natural Science,56,81-88.
Data availability
The datasets used and/or analyzed during the current study will be available from the authors upon reasonable request.
Disclaimer/Publisher's Note
The statements, opinions and data contained in all publications are solely those of the individual author(s) and contributor(s) and not of EWA Publishing and/or the editor(s). EWA Publishing and/or the editor(s) disclaim responsibility for any injury to people or property resulting from any ideas, methods, instructions or products referred to in the content.
About volume
Volume title: Proceedings of the 2nd International Conference on Applied Physics and Mathematical Modeling
© 2024 by the author(s). Licensee EWA Publishing, Oxford, UK. This article is an open access article distributed under the terms and
conditions of the Creative Commons Attribution (CC BY) license. Authors who
publish this series agree to the following terms:
1. Authors retain copyright and grant the series right of first publication with the work simultaneously licensed under a Creative Commons
Attribution License that allows others to share the work with an acknowledgment of the work's authorship and initial publication in this
series.
2. Authors are able to enter into separate, additional contractual arrangements for the non-exclusive distribution of the series's published
version of the work (e.g., post it to an institutional repository or publish it in a book), with an acknowledgment of its initial
publication in this series.
3. Authors are permitted and encouraged to post their work online (e.g., in institutional repositories or on their website) prior to and
during the submission process, as it can lead to productive exchanges, as well as earlier and greater citation of published work (See
Open access policy for details).
References
[1]. Lin, C.-H. 2005. Seismicity increases after the construction of the world’s tallest building: An active blind fault beneath the Taipei 101. Geophysical research letters. 32(22), pp. L22313-n/a.
[2]. Chen, K.-C., Wang, J.-H., Huang, B.-S., Liu, C.-C. and Huang, W.-G. 2012. Vibrations of the TAIPEI 101 skyscraper caused by the 2011 Tohoku earthquake, Japan. Earth, planets, and space. 64(12), pp.1277–1286.
[3]. "Taipei 101 Building", Structural Engineering Construction Record. (n.d.). Retrieved July 21, 2024, from ws.moi.gov.tw
[4]. Ding, F. and Kareem, A. 2020. Tall Buildings with Dynamic Facade Under Winds. Engineering (Beijing, China). 6(12), pp.1443–1453.
[5]. Dennis Poon et al. (2004), Structural Design of Taipei 10, the World’s Tallest Building. from global.ctbuh.org
[6]. Zhi, L., Li, Q.S. and Fang, M. 2016. Identification of Wind Loads and Estimation of Structural Responses of Super-Tall Buildings by an Inverse Method. Computer-aided civil and infrastructure engineering. 31(12), pp.966–982.
[7]. Şimon-Marinică, A.B., Vlasin, N.-I., Manea, F. and Florea, G.-D. 2021. Finite element method to solve engineering problems using ansys. MATEC Web of Conferences. 342, pp.1015.
[8]. Caicedo, D., Lara-Valencia, L., Blandon, J. and Graciano, C. 2021. Seismic response of high-rise buildings through metaheuristic-based optimization using tuned mass dampers and tuned mass dampers inerter. Journal of Building Engineering. 34, pp.101927.
[9]. Greco, R., Marano, G.C. and Fiore, A. 2016. Performance-cost optimization of tuned mass damper under low-moderate seismic actions. The structural design of tall and special buildings. 25(18), pp.1103–1122.
[10]. Chung, L.L., Wu, L.Y., Lien, K.H., Chen, H.H. and Huang, H.H. 2013. Optimal design of friction pendulum tuned mass damper with varying friction coefficient. Structural control and health monitoring. 20(4), pp.544–559.