


1. Introduction
In modern architectural design, skyscrapers have become a characteristic of urban development. These structures are continually increasing in height, presenting complex new challenges for structural engineers. In such architectural designs, the structural system must effectively fulfill critical requirements including strength, rigidity, and stability [1]. Particularly under lateral loads, the internal forces within the structure undergo significant changes, and as height increases, lateral displacement may vary with the fourth power of building height [2]. Consequently, understanding the dynamic behavior of these structures has become paramount in modern high-rise building design. The Bank of China Tower (BOC Tower) in Central Hong Kong is a striking architectural landmark, reaching a height of 367.4 meters including its spires and encompassing a total gross floor area of 129,000 square meters. Designed by I.M. Pei, the building features a square plan divided into triangular sections that rise in varying heights. Its innovative structural design includes four large steel columns at the corners, which support the tower's weight, and prominent "X"-shaped steel frames on the exterior. These frames transfer vertical loads to the corner columns, minimizing the need for internal columns and reducing steel usage. The structure's design addresses the unique challenges posed by Hong Kong's high wind speeds and frequent seismic activities, focusing on ensuring safety and stability through advanced materials and dynamic response considerations. This study utilizes ANSYS software to perform modal and transient structural analyses of the building. Initially, two models are created in SpaceClaim: the solid entity model and the framework model. Both models are discretized into finite element meshes within ANSYS Mechanical for modal analysis, obtaining multiple natural frequencies and corresponding vibration modes across different orders. Additionally, the framework model undergoes transient structural analysis under seismic wave conditions using El Centro seismic waves applied in velocity form at the base of the model. Safety assessments are conducted by calculating inter-story displacement angles between the top and bottom of the columns.
2. Method
This study developed two models: a framework model and a solid entity model. The frame model includes only columns and diagonal braces; The solid model treats the entire building as a single unit, with consistent material parameters throughout.
2.1. Framework model
2.1.1. Model Construction
During the modeling process, the columns are erected initially. Subsequently, the position of the diagonal braces is established within the internal plane defined by the columns, culminating in the completion of the model. Fig.1 shows the framework model constructed in SpaceClaim.
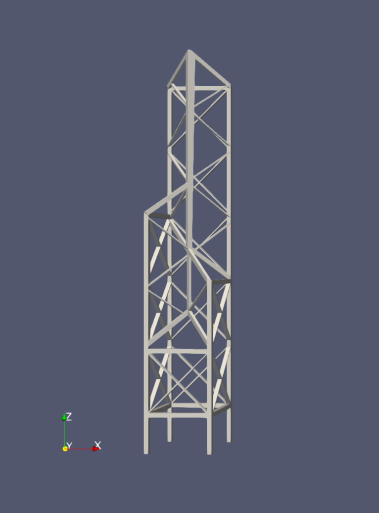
Figure 1. Framework model of BOC Tower.
2.1.2. Material setup
To facilitate the finite element simulation, the density of reinforced concrete is set to 2800 kg/m³. The modulus of elasticity is specifically defined as 3.34 × 10¹⁰ Pa based on the concrete's elastic modulus value and the Poisson's ratio of the material is set to 0.2.
To address the deformation and residual deformation of the framework structure caused by seismic waves, it is essential to incorporate material plasticity. The constitutive relationship for reinforced concrete materials, shown in Fig.2, is expressed as Eq.(1) [3]:
\( {f_{si}}=\begin{cases}{E_{s}}{ε_{si}} 0 \lt {ε_{si}}≤{ε_{y}} \\ {f_{y}} {ε_{y}} \lt {ε_{si}}≤{ε_{sh}} \\ {f_{y}}+{E_{sh}}({ε_{si}}-{ε_{sh}})≤{f_{u}} {ε_{si}} \gt {ε_{sh}}\end{cases} \) (1)
where \( {E_{s}} \) is the modulus of elasticity, \( {E_{sh}} \) is the modulus of strain hardening, \( {ε_{sh}} \) is the strain at the onset of strain hardening, \( {f_{y}} \) is the yield strength, and \( {f_{u}} \) is the ultimate strength of the reinforcement. Perfect bond is assumed between the concrete and steel.
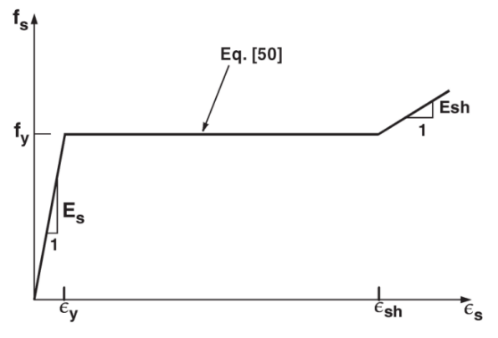
Figure 2. Reinforcement stress-strain relationship.
In this study, the modulus of elasticity \( {E_{s}} \) defined as 3.34 × 10¹⁰ Pa, and the yield strength \( {f_{y}} \) was set to 2.35 × 10⁸ Pa. The third deformation effect was disregarded, meaning that the strain-hardening modulus \( {E_{sh}} \) was assumed to be 0.
2.1.3. Meshing
To perform finite element analysis, this study segmented the framework model into six mesh types with spacings of 1 meter, 2 meters, 3meters, 5 meters, 8 meters, and 10 meters, respectively. The partitioned mesh model is shown in Fig.3. Table 1 shows the number of meshes under different mesh sizes.
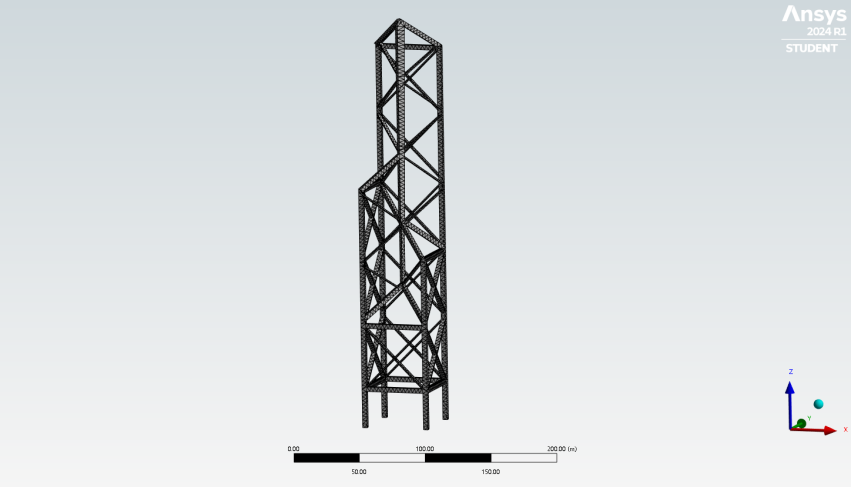
Figure 3. Mesh division of the solid entity model (3 m).
Table 1. Number of meshes under different mesh sizes (framework).
Mesh Size (m) | Nodes | Units | 1 | 117971 | 52551 | 2 | 42139 | 17238 | 3 | 27166 | 10368 | 5 | 24393 | 8910 | 8 | 15825 | 5873 | 10 | 14552 | 5348 |
2.2. Solid entity model
2.2.1. The structural system of the solid entity model
The geometric model of the Bank of China Tower's solid structure is constructed using a triangular framework as the primary component unit. The tower can be divided into five distinct parts: the base and four rising towers. The base is a block with dimensions of 52 meters in length, 52 meters in width, and 28 meters in height. The four towers extend to varying heights of 52 meters, 104 meters, 156 meters, and 260 meters, respectively [4]. The process of constructing the model is illustrated in Fig.4.
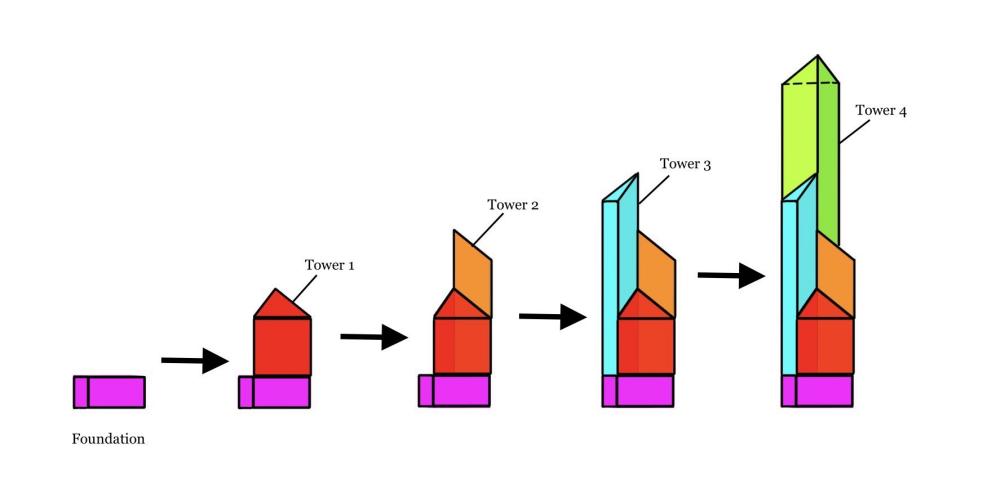
Figure 4. Modeling process of the solid entity model.
2.2.2. Material setup
The constant load design value for the Bank of China Tower in Hong Kong is 6.08 × 10⁷ kg, and the live load design value is 3.76 × 10⁷ kg. Therefore, the total mass of the solid entity model can be assumed to be 9.84 × 10⁷ kg. The solid entity model can be approximated as a combination of foundation and four triangular frustums and triangular cones. Taking Tower 1 as an example, as shown in Fig.5, the volume of Tower 1 can be calculated as follows:

Figure 5. Geometric model of tower 1.
\( {S_{1}}=\frac{1}{2}×26\sqrt[]{2} m×26\sqrt[]{2} m=676 {m^{2}} \) (2)
\( {V_{1}}=676 {m^{2}}×52 m+\frac{1}{3}×676 {m^{2}}×26 m=4.1×{10^{4}} {m^{3}} \) (3)
Similarly, the volumes of the other four towers and the foundation base are calculated. The foundation has a height of 28 meters, while the heights of the towers are as follows: Tower 2 is 104 meters, Tower 3 is 156 meters, and Tower 4 is 208 meters. Additionally, the height of the triangular cone is 26 meters. The results of these calculations are presented in Table 2.
Table 2. Volume of each part of the solid entity structure
Portion | Volume ( \( ×{10^{4}} {m^{3}} \) ) | Tower 1 | 4.1 | Tower 2 | 7.6 | Tower 3 | 11.1 | Tower 4 | 14.6 | Foundation | 1.9 | Total | 39.4 |
Therefore, the average density of the physical model is:
\( ρ=\frac{{M_{Total}}}{{V_{Total}}}=\frac{9.84×{10^{7}} kg}{39.4×{10^{4}} {m^{3}}}=250 kg∙{m^{3}} \) (4)
In materials mechanics, the bending stiffness of a component is commonly represented as the product of the elastic modulus E and the moment of inertia I. To ensure equal bending stiffness between the solid model and the frame model, the equivalent elastic modulus of the solid model is determined by computing the ratio of the moments of inertia about the neutral axis for both models.
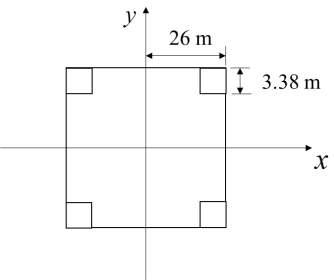
Figure 6. Cross section of columns and solid entity model.
In this case, the moment of inertia of the column is calculated as follows:
\( {I_{x,column}}=4\int _{22.62}^{26}dx\int _{22.62}^{26}{y^{2}}dy=2.7×{10^{4}} {m^{4}} \) (5)
The moment of inertia of the tower profile is calculated as follows:
\( {I_{x,solid}}=4\int _{0}^{26}dx\int _{0}^{26}{y^{2}}dy=6.1×{10^{5}} {m^{4}} \) (6)
As \( {E_{s,column}} \) is defined as 3.34 × 10¹⁰ Pa, the equivalent elastic modulus of the solid structure is
\( {E_{s,solid}}={E_{s,column}}×\frac{{I_{x,column}}}{{I_{x,solid}}}=1.45 GPa \) (7)
Following the deliberations in sections 2.1.2 and 2.2.2, the material parameters employed in this study are presented in Table 3.
Table 3. Material parameters of two models.
Material Parameters | Solid Entity | Framework | Density ( kg/m3 ) | 250 | 2800 | Young's Modulus (GPa) | 1.45 | 33.4 | Poisson's Ratio | 0.2 | 0.2 | Bulk Modulus (GPa) | 0.806 | 18.56 | Shear Modulus (GPa) | 0.604 | 13.92 | Yield Strength (MPa) | - | 235 | Tangent Modulus | - | 0 |
2.2.3. Meshing
The solid entity model is then subjected to structural meshing, followed by mechanical analysis. Mesh partitioning is a crucial step in finite element modeling, as the mesh configuration directly affects both the accuracy and the computational scale of the analysis. To assess the impact of mesh accuracy on the calculation results, the solid entity model is divided into meshes with spacing of 2 meters, 3 meters, 5 meters, 8 meters, 10 meters, and 15 meters. Fig.7 shows the geometric model of the Bank of China Tower with a 5-meter mesh spacing. Table 4 shows the number of meshes under different mesh sizes.
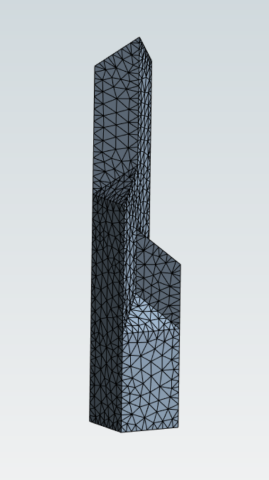
Figure 7. Mesh division of the solid entity model (5 m).
Table 4. Number of meshes under different mesh sizes (solid entity).
Mesh Size (m) | Nodes | Units | 2 | 42152 | 23864 | 3 | 18808 | 10355 | 5 | 7083 | 3715 | 8 | 2854 | 1420 | 10 | 2049 | 985 | 15 | 965 | 436 | 20 | 629 | 266 | 25 | 430 | 166 | 30 | 298 | 108 |
3. Modal Analysis Results
The modal analysis deals with the dynamic behavior of mechanical structures under the dynamic excitation. The modal analysis is used to determine the dynamic characteristics of a system such as natural frequency, mode shapes etc [5]. Modal analysis allows the design to avoid resonant vibrations or to vibrate at a specified frequency and gives engineers an idea of how the design will respond to different types of dynamic loads [6].
3.1. Framework model
The vibration pattern of a structure corresponds to the eigenvector matrix associated with its eigenvalue matrix. Physically, the vibration pattern at a specific natural frequency reflects the maximum displacement values of points along the neutral axis or plane during structural vibration. In a continuous elastic body, there are theoretically an infinite number of natural frequencies. The first six natural frequencies correspond to rigid body motions, representing three translational and three rotational movements without bending or torsional deformation. The seventh mode introduces overall transverse bending vibrations, while the eighth mode involves overall longitudinal bending vibrations.
For the framework model of the Bank of China Tower in Hong Kong as described in Section 2.1.1, modal analysis using ANSYS was conducted to determine natural frequencies and their free vibration modes. Free vibration is the natural response of a structure to some impact or displacement [7]. The results, which include calculated natural frequencies and vibration modes, are documented in the table. Moreover, the frequencies corresponding to each vibration mode obtained from the modal analysis are depicted in Table 5.
Table 5. Natural frequency of framework model (Hz).
Modal Mesh size (m) | 1 | 2 | 3 | 4 | 5 | 6 | 7 | 8 | 10 | 0.2748 | 0.2890 | 0.4959 | 0.5850 | 0.7098 | 0.9438 | 1.1962 | 1.3377 | 8 | 0.2737 | 0.2878 | 0.4928 | 0.5819 | 0.7063 | 0.9408 | 1.1922 | 1.3322 | 5 | 0.2724 | 0.2863 | 0.4885 | 0.5779 | 0.7018 | 0.9346 | 1.1849 | 1.3224 | 3 | 0.2716 | 0.2854 | 0.4863 | 0.5758 | 0.6996 | 0.9324 | 1.1824 | 1.3175 | 2 | 0.2712 | 0.2849 | 0.4851 | 0.5748 | 0.6984 | 0.9306 | 1.1805 | 1.3147 | 1 | 0.2704 | 0.2840 | 0.4810 | 0.5725 | 0.6959 | 0.9247 | 1.1762 | 1.3082 |
Using Mode 1 as an example, it can be observed that as the grid size decreases, the simulated natural frequency also decreases gradually, indicating an anticipated convergence toward a specific value, as illustrated in Fig.8.
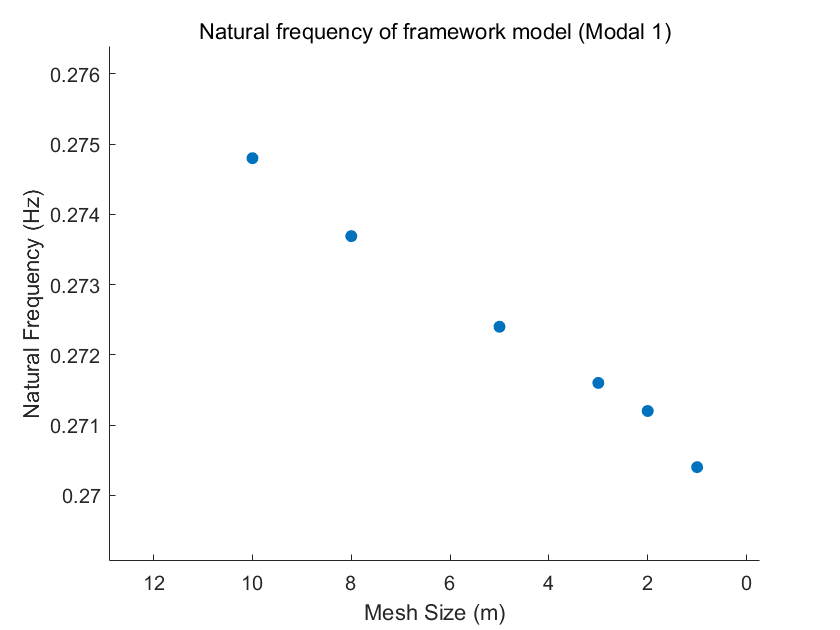
Figure 8. Natural frequency of framework model (Modal 1).
3.2. Solid entity model
For the solid entity model of the Bank of China Tower in Hong Kong as described in Section 2.2.1, modal analysis using ANSYS was conducted to determine natural frequencies and their corresponding vibration modes. The results, which include calculated natural frequencies and vibration modes, are documented in the table. The frequencies corresponding to each vibration mode obtained from the modal analysis are depicted in Table 6.
Table 6. Natural frequency of solid entity model (Hz).
Modal Mesh size (m) | 1 | 2 | 3 | 4 | 5 | 6 | 30 | 0.3262 | 0.3719 | 0.9504 | 1.1805 | 1.9708 | 2.2161 | 25 | 0.3257 | 0.3714 | 0.9463 | 1.1758 | 1.9365 | 2.2033 | 20 | 0.3242 | 0.3700 | 0.9372 | 1.1643 | 1.8313 | 2.1849 | 15 | 0.3232 | 0.3695 | 0.9346 | 1.1606 | 1.8012 | 2.1754 | 10 | 0.3223 | 0.3689 | 0.9293 | 1.1564 | 1.7641 | 2.1666 | 8 | 0.3219 | 0.3686 | 0.9284 | 1.1550 | 1.7607 | 2.1639 | 5 | 0.3214 | 0.3683 | 0.9263 | 1.1529 | 1.7506 | 2.1603 | 3 | 0.3211 | 0.3681 | 0.9253 | 1.1517 | 1.7471 | 2.1586 | 2 | 0.3210 | 0.3680 | 0.9247 | 1.1512 | 1.7459 | 2.1578 |
Using Mode 1 as an example, it can be observed that as the grid size decreases, the simulated natural frequency also decreases gradually, indicating an anticipated convergence toward a specific value, as illustrated in Fig.9.
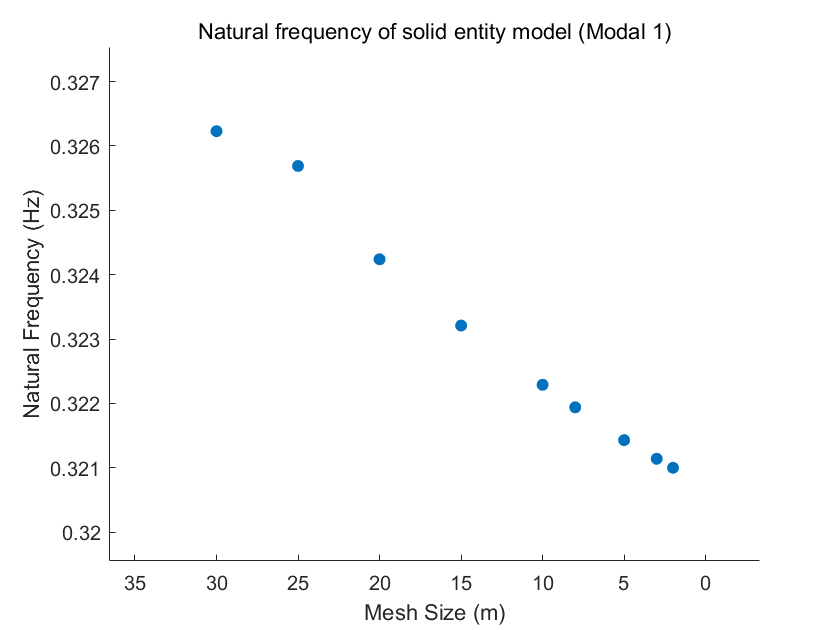
Figure 9. Natural frequency of framework model (Modal 1).
3.3. Comparison of Modal Analysis Results for Framework and Solid-entity Models
The results from the analysis of both the framework and the solid-entity models, divided with 2-meter meshes, are compared to illustrate the differences between the two models. In Fig.10, the black data represent the modal analysis results for the solid structure, while the red data correspond to the frame structure. It is observed that the frequencies of the first and second vibration modes are similar for both models. However, starting from the third mode onward, the frequency differences between the two models increase.
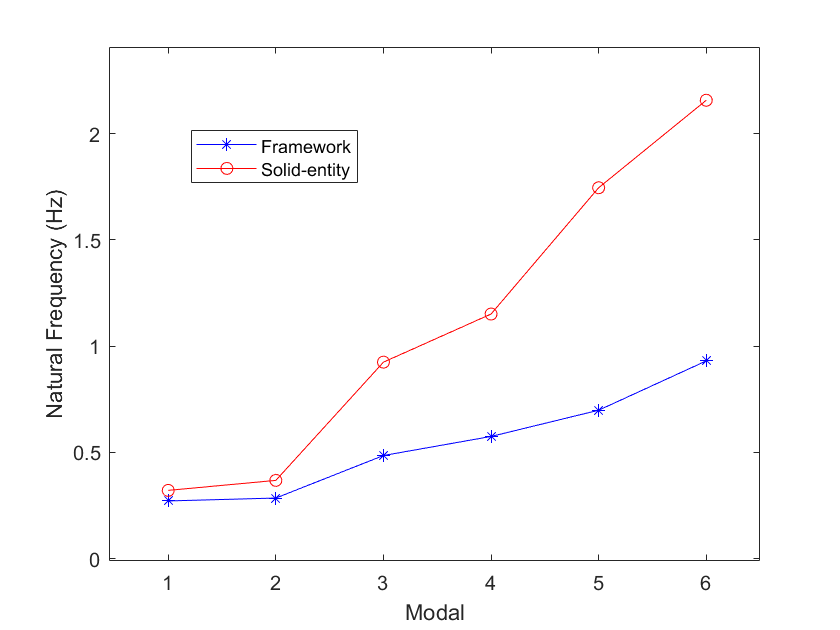
Figure 10. Comparison of framework and solid-entity models.
4. Transient Analysis Results
4.1. Seismic wave
The seismic waves utilized in this study are El Centro waves, which are ground motion waves resulting from a series of earthquakes that occurred in the El Centro area of southern California on May 18, 1940 [8]. These seismic waves generate strong ground motion and exert a significant impact on structures, making them valuable for researching the seismic response of buildings and other structures [9].
4.2. Storey drift of framework model
The frame structure is analyzed using two models, one is non-plastic and another one is plastic. A probe is positioned 28 meters above the base of the frame. The El Centro earthquake wave is inputted into the ANSYS finite element analysis software to calculate the displacement at this probe. The displacement value at the top probe is denoted as \( {u_{1}} \) , and at the lower probe as \( {u_{2}} \) . Subsequently, the storey drift angle is calculated using the following formula:
\( θ=\frac{{u_{1}}-{u_{2}}}{h} \) (8)
According to Chinese Standards (GB 50011), the allowable limit for the inter-story drift angle in reinforced concrete frame structures is 1/50 [10]. This corresponds to a maximum displacement ratio of 0.02 times the story height. Fig.11 illustrates the calculated storey drift as it varies over time.
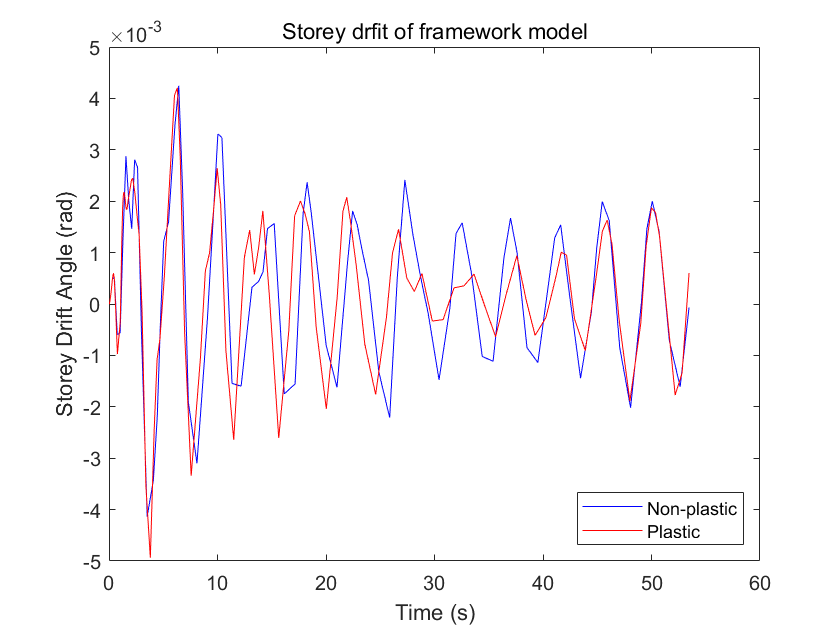
Figure 11. Storey drift of framework model.
5. Discussion
In section 3.3, this study found significant differences in modal analysis between the framework model and the solid entity model. Therefore, it is still important to conduct additional measurements and compare them with actual building data to further establish a more realistic numerical simulation analysis model. In section 4.2, this research conducted a computational simulation of the inter-story displacement angle for the frame structure subjected to El Centro seismic waves. The maximum value observed was 0.005, significantly below the limit for inter-story displacement angle specified in Chines standard GB 50011. Consequently, it can be inferred that the structure remains safe under the impact of an earthquake of this intensity. Moving forward, this approach can be employed to assess the stability of various buildings under specific seismic waves.
6. Conclusion
Meshes with varying levels of accuracy were created for the calculations, and the frequencies of the first six vibration modes were analyzed. A comparison was made between the results from the solid structure and the frame structure.
The frequencies of the first six vibration modes, calculated for both the framework and solid entity models of the BOC Tower, converge to stable values as the mesh density increases.
For a grid spacing of 2 meters, the frequencies of the modal 1 and modal 2 are similar for both the framework and solid entity models. However, significant differences are observed starting from the third-order vibration mode. This indicates that comparing the frame and solid structures with actual structural data is necessary to select a simulation model that more accurately represents the real structure.
ANSYS was used to calculate the frame structure, with the El Centro earthquake wave input to determine the displacement at the probe. The maximum inter-story displacement angle for the BOC Tower was found to be 0.005, which is below the allowable limit for multi-storey structures. This confirms that the structure is both safe and stable.
References
[1]. Bungale ST. (1988) Structural analysis and design of tall building. The William Byrd Press, New York.
[2]. Li GQ, Li QS. (2001) Theory and its application of time-dependent reliability of engineering structures. Science Press, Beijing.
[3]. R. G Selby and F. J Vecchio. (1997) A constitutive model for analysis of reinforced concrete solids. Canadian Journal of Civil Engineering. 24(3): 460-470.
[4]. 2024 Council on Tall Buildings and Urban Habitat. (2024) Bank of China Tower. https://www.skyscrapercenter.com/building/bank-of-china-tower/287
[5]. N. A. Khadse, S. R. Zaweri. (2015) Modal Analysis of Aircraft Wing using Ansys Workbench Software Package. International Journal of Engineering Research and Technology. 4(7): 225-230.
[6]. C. M. Ramesha, et al. (2015) Modal Analysis and Harmonic Response Analysis of a Crankshaft. International Journal of Emerging Technology and Advanced Engineering. 5(6). 323-327.
[7]. P. Y. Ghodke, et al. (2017) Modal Analysis Of Cracked Continuous Beam Using ANSYS. International Research Journal of Engineering and Technology. 4(2):86-93.
[8]. Southern California Earthquake Data Center. (2012) Significant Earthquakes and Faults. https://web.archive.org/web/20120302175713/http://www.data.scec.org/significant/imperial1940.html
[9]. Vibrationdata. (2019) El Centro Earthquake. https://www.vibrationdata.com/elcentro.htm
[10]. Standardization Administration of the People's Republic of China. (2010) Code for Seismic Design of Buildings (GB 50011-2010). Standards Press of China, Beijing.
Cite this article
Fan,Z.;An,P. (2024). Analysis of Vibrational Characteristics of the Bank of China Tower in Hong Kong with ANSYS. Theoretical and Natural Science,53,226-235.
Data availability
The datasets used and/or analyzed during the current study will be available from the authors upon reasonable request.
Disclaimer/Publisher's Note
The statements, opinions and data contained in all publications are solely those of the individual author(s) and contributor(s) and not of EWA Publishing and/or the editor(s). EWA Publishing and/or the editor(s) disclaim responsibility for any injury to people or property resulting from any ideas, methods, instructions or products referred to in the content.
About volume
Volume title: Proceedings of the 2nd International Conference on Applied Physics and Mathematical Modeling
© 2024 by the author(s). Licensee EWA Publishing, Oxford, UK. This article is an open access article distributed under the terms and
conditions of the Creative Commons Attribution (CC BY) license. Authors who
publish this series agree to the following terms:
1. Authors retain copyright and grant the series right of first publication with the work simultaneously licensed under a Creative Commons
Attribution License that allows others to share the work with an acknowledgment of the work's authorship and initial publication in this
series.
2. Authors are able to enter into separate, additional contractual arrangements for the non-exclusive distribution of the series's published
version of the work (e.g., post it to an institutional repository or publish it in a book), with an acknowledgment of its initial
publication in this series.
3. Authors are permitted and encouraged to post their work online (e.g., in institutional repositories or on their website) prior to and
during the submission process, as it can lead to productive exchanges, as well as earlier and greater citation of published work (See
Open access policy for details).
References
[1]. Bungale ST. (1988) Structural analysis and design of tall building. The William Byrd Press, New York.
[2]. Li GQ, Li QS. (2001) Theory and its application of time-dependent reliability of engineering structures. Science Press, Beijing.
[3]. R. G Selby and F. J Vecchio. (1997) A constitutive model for analysis of reinforced concrete solids. Canadian Journal of Civil Engineering. 24(3): 460-470.
[4]. 2024 Council on Tall Buildings and Urban Habitat. (2024) Bank of China Tower. https://www.skyscrapercenter.com/building/bank-of-china-tower/287
[5]. N. A. Khadse, S. R. Zaweri. (2015) Modal Analysis of Aircraft Wing using Ansys Workbench Software Package. International Journal of Engineering Research and Technology. 4(7): 225-230.
[6]. C. M. Ramesha, et al. (2015) Modal Analysis and Harmonic Response Analysis of a Crankshaft. International Journal of Emerging Technology and Advanced Engineering. 5(6). 323-327.
[7]. P. Y. Ghodke, et al. (2017) Modal Analysis Of Cracked Continuous Beam Using ANSYS. International Research Journal of Engineering and Technology. 4(2):86-93.
[8]. Southern California Earthquake Data Center. (2012) Significant Earthquakes and Faults. https://web.archive.org/web/20120302175713/http://www.data.scec.org/significant/imperial1940.html
[9]. Vibrationdata. (2019) El Centro Earthquake. https://www.vibrationdata.com/elcentro.htm
[10]. Standardization Administration of the People's Republic of China. (2010) Code for Seismic Design of Buildings (GB 50011-2010). Standards Press of China, Beijing.