


1. Introduction
Heat dissipation is a crucial part of machine design, especially for systems that continuously generate heat during operation. Effective heat dissipation measures are essential to prevent component from overheating and damage, and even system crashes. Usually, to conduct heat out of a designated area, materials with high thermal conductivity such as metals are used. However, in addition to the thermal conductivity of the material, adjusting the geometric shape and internal structure of the cooling system can also significantly improve the heat dissipation efficiency. One of the common approaches is introducing porous media.
Previous studies have delved into various aspects of heat conduction in porous media, particularly the relationship between pore shape and effective thermal conductivity. For example, Smith et al. found that pore shapes are relevant to overall thermal conductivity. Thus, through adjusting them, heat transfer performance can be optimized based on specific applications [1]. However, research on the impact of aperture, a key parameter involved, is still insufficient.
The pore size directly affects the balance between two distinct types of heat transfer which are solid-phase conduction and gas-phase conduction. Larger pores usually induce more gas-phase conduction, thus improving overall thermal conductivity in many cases. This phenomenon is especially important in applications involving radiators and heat exchangers. The Maxwell Eucken model provides a mathematical framework to help us understand how pore size and its distribution affect the effective thermal conductivity of mixtures that consists of multiple materials [2].
In recent years, research has further expanded our understanding of the factors affecting the thermal conductivity of porous media. For instance, through the method of numerical analysis, the effect of pore size distribution on overall thermal conductivity was investigated by Zhang, Huang and Liu. The results showed that under certain conditions, the increase of pore size would directly improve the thermal performance [3]. Similarly, Nguyen, Vo, and Pham pointed out that the connectivity of pores plays an important role in thermal conduction as well [4]. The porosity (i.e. pore volume fraction) of a material largely determines its thermal conductivity. Yang and Yu concluded that as the porosity increases, the effective thermal conductivity usually decreases because more air fills the pores, thus disrupting the solid's thermal conductivity path [5]. However, at a fixed porosity, the balance between solid-phase and gas-phase conduction can be optimized. Chen, Li, and Zhou found that adjusting pore size can adapt thermal conductivity to specific requirements [6].
In addition, the arrangement direction of pores in the material is also a factor affecting thermal conductivity. The study by Li, Sun, and Wang showed that arranging pores along the direction of heat flow can significantly improve thermal conductivity compared to randomly arranging them [7]. Finally, the type of material used is also crucial in porous media. Bianchi, Manzolini, and Silva discovered that even materials with extremely high intrinsic thermal conductivity will experience a significant decrease in overall thermal conductivity after the introduction of pores that interrupts the thermal conduction path [8]. Based on the research mentioned above, this study will quantify the effect of pore size on thermal conductivity through software simulations. Specifically, this study will simulate porous metal components with different pore sizes in Ansys to identify the optimal pore size that maximizes thermal conductivity efficiency. This study is of great significance for the design of cooling systems in various engineering applications, and can provide valuable insights for the development of more efficient heat dissipation technologies.
2. Methodology
2.1. Related Theory
The simulation involves some related theory, including the concept of heat flux. Heat flux refers to the rate of transfer of thermal energy across a given surface per unit time, measuring how much thermal energy moves through a particular area. Since this simulation deals mainly with conduction, the heat flux can be described by Fourier's Law (Eq1) [9]:
\( q=-k\frac{dT}{dx}\ \ \ (1) \)
where \( k \) is the conductivity of the material.
2.2. Model Construction
In the study, a piece of porous media is simplified into a cuboid with four cylindrical pores in fixed positions. The dimension of the cuboid is 1.4m*0.8m*1m. The diameters of the pores are then changed to different values during the process of simulation. Our final model is shown in Figure 1.
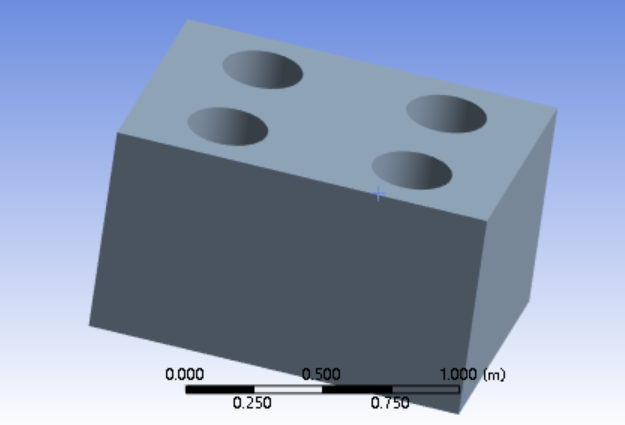
Figure 1. The geometry of model.
2.3. Material Settings
Structural steel, one of the most common ingredients in industries, is chosen to be the material of the porous media. Air is selected to be the fluid within the pores. Crucial thermal attributes of the two materials are listed in Table 1, including density, isotropic thermal conductivity and specific heat under constant pressure.
Table 1. Thermal attributes of the materials.
Material | Density/ \( kg*{m^{-3}} \) | Isotropic thermal conductivity/ \( \frac{W}{m*K} \) | Specific heat under constant pressure/ \( \frac{J}{kg*K} \) |
Structural Steel | 7850 | 60.5 | 434 |
Air | 1.225 | 0.0242 | 1006.4 |
2.4. Boundary Conditions and Solution
Two essential boundary conditions (i.e. two different temperatures) are set on two opposite surfaces. The leftmost surface of the cuboid is set with a temperature of 300K, and its opposite surface is set with 500K as shown separately in Figure 2 and Figure 3. One of the edges between the surfaces is defined as the observed path as shown in Figure 4. The temperature and heat flux along the path can properly reflect the heat conduction situation inside the media. The model is solved to generate the temperature contour plot and the heat flux contour plot. The data of each node along the path is then accessible. A larger heat flux value can reflect a relatively better heat conduction efficiency. The process is repeated for four times with different pore diameter values of 0.05m, 0.15m, 0.3m and 0.4m to yield a trend.
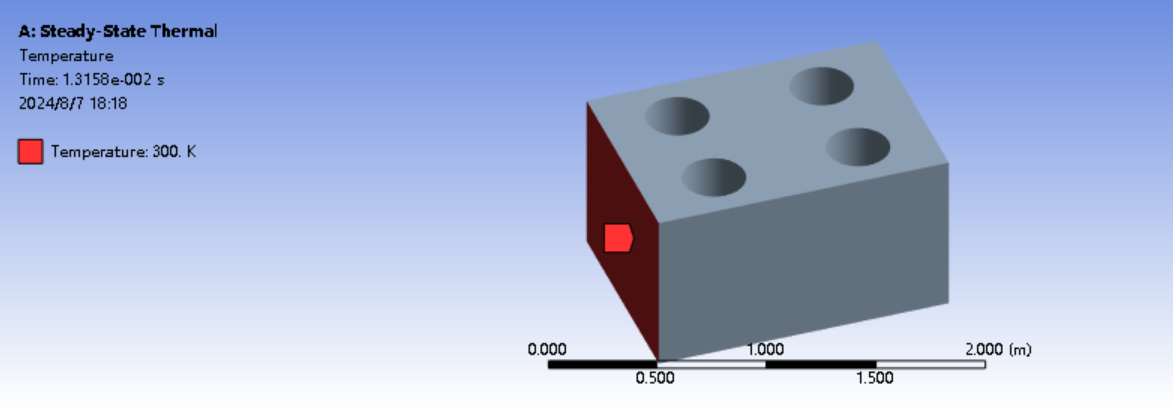
Figure 2. The surface set with temperature of 300K.
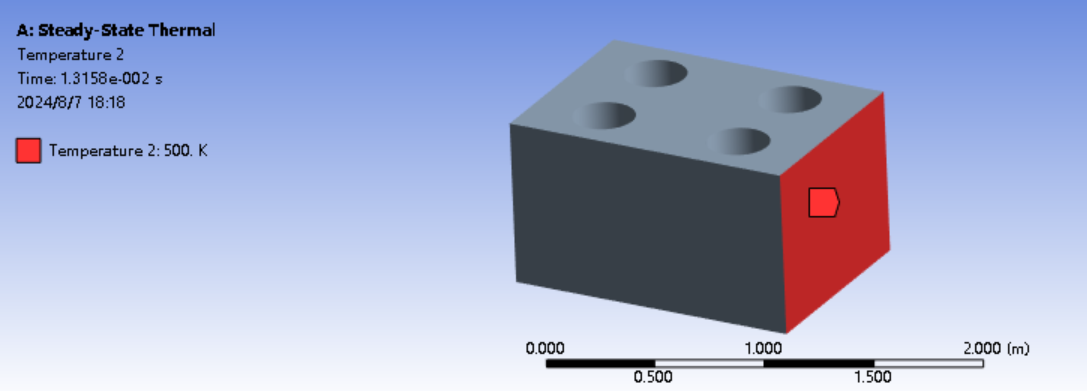
Figure 3. The surface set with temperature of 500K.
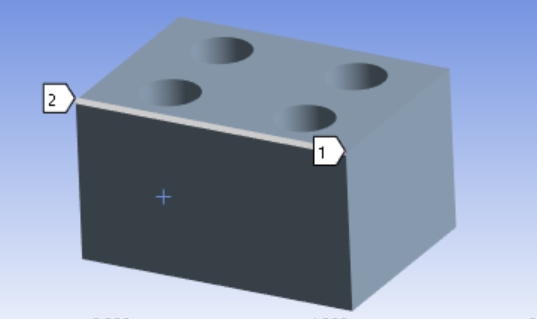
Figure 4. The path defined in the simulation.
3. Results
For comparison, the temperature on each node is then put into Table 2 with separate columns for different pore diameters. Similarly, the data of heat flux on each node is put into another table, Table 3. To better contrast the results, line graphs for temperatures and heat flux are plotted separately with each colour indicating a different pore diameter using Python, as shown in Figure 5 and Figure 6. It can be noticed that the curvature of the temperature curve is prone to be more significant with the increase of pore diameter. The heat flux values tend to reach a peak when the nodes are around the location of the pores. It is worth to note that the value of the peak increases with pore diameter, indicating a better heat conduction efficiency. Figure 7 illustrates the 2D heat flux plots of one corner of the porous media in the four simulations.
Table 2. Node temperature values in the simulations.
Distance from one end /m | Pore diameter d=0.05m, node temperature value / K | Pore diameter d=0.15m, node temperature value / K | Pore diameter d=0.3m, node temperature value / K | Pore diameter d=0.4m, node temperature value / K |
0 | 500 | 500 | 500 | 500 |
4.67E-02 | 493.39 | 493.83 | 495.13 | 496.54 |
9.33E-02 | 486.77 | 487.61 | 489.97 | 492.81 |
0.14 | 480.14 | 481.28 | 484.95 | 488.62 |
0.18667 | 473.5 | 474.77 | 478.61 | 483.1 |
0.23333 | 466.82 | 468 | 471.53 | 476.07 |
0.28 | 460.1 | 460.97 | 463.48 | 466.78 |
0.32667 | 453.36 | 453.54 | 454.24 | 455.22 |
0.37333 | 446.61 | 446.1 | 444.64 | 442.9 |
0.42 | 439.87 | 438.92 | 435.79 | 431.78 |
0.46667 | 433.16 | 431.82 | 427.84 | 422.99 |
0.51333 | 426.49 | 425.04 | 420.83 | 416.22 |
0.56 | 419.85 | 418.71 | 415.24 | 411.25 |
0.60667 | 413.22 | 412.38 | 409.81 | 407.08 |
0.65333 | 406.61 | 406.16 | 404.86 | 403.47 |
0.7 | 400 | 400.01 | 400.04 | 400.12 |
0.74667 | 393.39 | 393.85 | 395.25 | 396.76 |
0.79333 | 386.77 | 387.64 | 390.25 | 393.1 |
0.84 | 380.15 | 381.32 | 384.87 | 388.79 |
0.88667 | 373.5 | 374.8 | 378.81 | 383.56 |
0.93333 | 366.82 | 368.04 | 371.75 | 376.39 |
0.98 | 360.11 | 360.94 | 363.5 | 367.01 |
1.0267 | 353.36 | 353.58 | 354.34 | 355.28 |
1.0733 | 346.61 | 346.14 | 344.7 | 342.77 |
1.12 | 339.86 | 338.81 | 335.62 | 331.45 |
1.1667 | 333.16 | 331.81 | 327.61 | 322.62 |
1.2133 | 326.49 | 325.09 | 320.78 | 316.03 |
1.26 | 319.84 | 318.62 | 314.96 | 310.83 |
1.3067 | 313.22 | 312.35 | 309.68 | 306.87 |
1.3533 | 306.61 | 306.15 | 304.77 | 303.31 |
1.4 | 300 | 300 | 300 | 300 |
Table 3. Node heat flux values in the simulations.
Distance from one end /m | When pore diameter d=0.05m, node heat flux value / \( \frac{W}{{m^{2}}} \) | When pore diameter d=0.15m, node heat flux value / \( \frac{W}{{m^{2}}} \) | When pore diameter d=0.3m, node heat flux value / \( \frac{W}{{m^{2}}} \) | When pore diameter d=0.4m, node heat flux value / \( 3\frac{W}{{m^{2}}} \) |
0 | 8567.6 | 7977.3 | 6173.1 | 4331.9 |
4.67E-02 | 8574.9 | 8041.7 | 6360.7 | 4632.3 |
9.33E-02 | 8582.1 | 8106 | 6551.8 | 4934.6 |
0.14 | 8610.1 | 8362.5 | 7805.4 | 6461.2 |
0.18667 | 8638 | 8619.1 | 9072.3 | 7995.3 |
0.23333 | 8684 | 8984.7 | 10053 | 10917 |
0.28 | 8730.1 | 9351.9 | 11033 | 13841 |
0.32667 | 8740.8 | 9341 | 11530 | 14951 |
0.37333 | 8751.4 | 9335.9 | 12067 | 16063 |
0.42 | 8712 | 9232.1 | 11142 | 13080 |
0.46667 | 8672.6 | 9128.2 | 10226 | 10102 |
0.51333 | 8634.7 | 8656.9 | 8671.6 | 7883 |
0.56 | 8596.8 | 8187.8 | 7126.8 | 5667.4 |
0.60667 | 8583.1 | 8088 | 6671.9 | 5007.2 |
0.65333 | 8569.5 | 7988.8 | 6220.6 | 4351.6 |
0.7 | 8571.6 | 7994.5 | 6243.9 | 4363.3 |
0.74667 | 8573.7 | 8000.2 | 6267.2 | 4375.3 |
0.79333 | 8586.6 | 8150.4 | 6765.3 | 5127.5 |
0.84 | 8599.4 | 8300.6 | 7263.5 | 5884 |
0.88667 | 8640.9 | 8648.3 | 8657.2 | 8344.1 |
0.93333 | 8682.4 | 8996.1 | 10051 | 10806 |
0.98 | 8721.2 | 9332.5 | 11270 | 13788 |
1.0267 | 8760 | 9668.9 | 12508 | 16780 |
1.0733 | 8739.2 | 9495.2 | 11861 | 15009 |
1.12 | 8718.4 | 9321.9 | 11225 | 13241 |
1.1667 | 8674.1 | 8938.3 | 9607.4 | 10349 |
1.2133 | 8629.7 | 8554.8 | 7989.6 | 7465.5 |
1.26 | 8603.9 | 8305.7 | 7255.4 | 6070.4 |
1.3067 | 8578.1 | 8056.7 | 6521.2 | 4685.8 |
1.3533 | 8571 | 8002 | 6316.6 | 4424.6 |
1.4 | 8563.9 | 7947.4 | 6112 | 4165.1 |
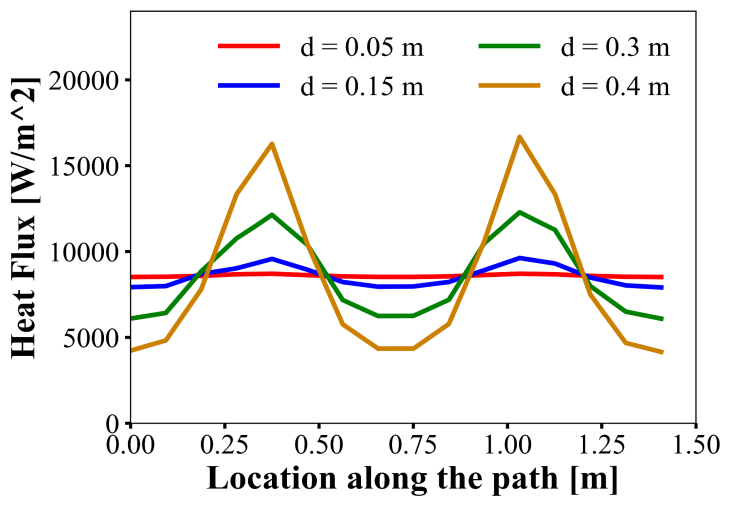
Figure 5. Heat flux vs Node location along the path.
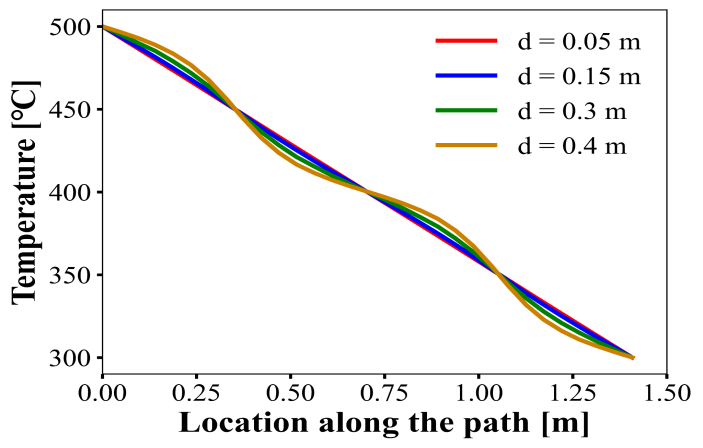
Figure 6. Temperature vs Node location along the path.
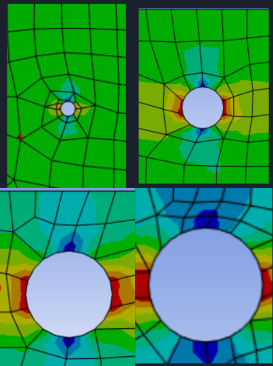
Figure 7. Four 2D temperature contour plots on the corners.
4. Discussions
The increase of temperature curve curvature with pore diameter can be explained by more significant heat flux fluctuation, given that the value of heat flux is proportional to the first derivative of temperature. Thus, when the overall slope of the heat flux curve increases, the rate of change of the temperature curve slope increases as well. The Maxwell-Eucken1 (ME1) Model [2] helps interpret better heat conduction efficiency with pore size. In ME1 Model, the effective thermal conductivity \( {K_{eff}} \) is given by the equation (Eq2):
\( {K_{eff}}= \frac{{k_{1}}{v_{1}}+{k_{2}}{v_{2}}\frac{3{k_{1}}}{2{k_{1}}+{k_{2}}}}{{v_{1}}+{v_{2}}\frac{3{k_{1}}}{2{k_{1}}+{k_{2}}}}\ \ \ (2) \)
In which \( {k_{1}} \) , \( {k_{2}} \) are the thermal conductivity of continuous phase and dispersed phase respectively and \( {v_{1}} \) , \( {v_{2}} \) are separately the volume of the two phases. In the data range of the simulation, the effective thermal conductivity \( {K_{eff}} \) tends to increase as the volume of continuous phase decreases and the volume of dispersed phase increases, resulting in higher heat conduction efficiency. An alternative interpretation is heating flux concentration, which can be concluded from the four 2D heat flux contour plots shown in Figure 7. Due to the increase of pore diameter, the edge of the porous media tends to be thinner, causing the heat flux to accumulate around that area. This study’s findings are further supported by recent research that emphasizes the critical role of pore scale in heat transfer within porous media. For instance, He et al. demonstrated that variations in pore size significantly impact thermal convection, suggesting that optimizing pore dimensions can enhance overall heat transfer efficiency within porous structures [10]. This aligns with the positive correlation observed in this study between pore diameter and thermal conductivity.
5. Conclusion
In this study, a porous model is set up, and the conduction is simulated using Ansys. Several conclusions can be made based on the results:
(1) Within the range involved in the simulation, as the diameter of the pores enlarges, the conductivity of the media increased.
(2) Considering the results and the interpretation of heat flux fluctuation and heat flux concentration, it can be anticipated that there is a positive correlation between the pore size and the thermal conductivity. Therefore, it can be further concluded that increasing the size of pores on certain cooling devices with porous plate do help transfer heat more efficiently.
(3) However, limitations of this investigation also exist, including overlooking the influence of porosity. This can be a focus for future studies in this field.
References
[1]. Smith, David S. et al. “Thermal Conductivity of Porous Materials.” Journal of Materials Research 28.17 (2013): 2260–2272.
[2]. J.F. Wang, J. K. Carson, M. F. North, D. J. Cleland. A new approach to modelling the effective thermal conductivity of heterogeneous materials. International Journal of Heat and Mass Transfer, 2006, 49(17-18): 3075-3083
[3]. Zhang, X., Huang, Y., & Liu, G. (2020). Numerical analysis of thermal conductivity in open-cell metal foams: Effect of pore size distribution. Journal of Heat Transfer, 142(4), 042601.
[4]. Nguyen, T., Vo, T., & Pham, Q. (2021). Impact of pore structure on thermal conductivity of porous ceramics for thermal barrier coatings. Materials Science Forum, 1016, 407-414.
[5]. Yang, J., & Yu, W. (2018). The impact of porosity on the thermal conductivity of metallic foams: A computational study. International Journal of Heat and Mass Transfer, 123, 189-197.
[6]. Chen, X., Li, H., & Zhou, Y. (2019). Tuning thermal conductivity in nanoporous materials through pore size variation. Applied Physics Letters, 115(3), 033105.
[7]. Li, M., Sun, F., & Wang, H. (2022). Enhancing thermal conductivity of porous materials through pore orientation. Journal of Applied Physics, 131(14), 143506.
[8]. Bianchi, G., Manzolini, G., & Silva, P. (2015). Thermal conductivity of high-temperature porous materials: Effect of material type and pore size. Energy Procedia, 75, 3090-3097.
[9]. Struik, Dirk Jan. "Joseph Fourier". Encyclopaedia Britannica, 12 May. 2024, https://www.britannica.com/biography/Joseph-Baron-Fourier. Accessed 8 August 2024.
[10]. He, X., Funfschilling, D., Nobach, H., Bodenschatz, E., & Ahlers, G. (2012). Effects of pore scale and conjugate heat transfer on thermal convection in porous media. Journal of Fluid Mechanics, 719, 551–586.
Cite this article
Liu,Y.;Ou,Y. (2024). Impact of Pore Diameter on Heat Conduction Efficiency in Porous Media Based on Ansys. Theoretical and Natural Science,53,59-66.
Data availability
The datasets used and/or analyzed during the current study will be available from the authors upon reasonable request.
Disclaimer/Publisher's Note
The statements, opinions and data contained in all publications are solely those of the individual author(s) and contributor(s) and not of EWA Publishing and/or the editor(s). EWA Publishing and/or the editor(s) disclaim responsibility for any injury to people or property resulting from any ideas, methods, instructions or products referred to in the content.
About volume
Volume title: Proceedings of the 2nd International Conference on Applied Physics and Mathematical Modeling
© 2024 by the author(s). Licensee EWA Publishing, Oxford, UK. This article is an open access article distributed under the terms and
conditions of the Creative Commons Attribution (CC BY) license. Authors who
publish this series agree to the following terms:
1. Authors retain copyright and grant the series right of first publication with the work simultaneously licensed under a Creative Commons
Attribution License that allows others to share the work with an acknowledgment of the work's authorship and initial publication in this
series.
2. Authors are able to enter into separate, additional contractual arrangements for the non-exclusive distribution of the series's published
version of the work (e.g., post it to an institutional repository or publish it in a book), with an acknowledgment of its initial
publication in this series.
3. Authors are permitted and encouraged to post their work online (e.g., in institutional repositories or on their website) prior to and
during the submission process, as it can lead to productive exchanges, as well as earlier and greater citation of published work (See
Open access policy for details).
References
[1]. Smith, David S. et al. “Thermal Conductivity of Porous Materials.” Journal of Materials Research 28.17 (2013): 2260–2272.
[2]. J.F. Wang, J. K. Carson, M. F. North, D. J. Cleland. A new approach to modelling the effective thermal conductivity of heterogeneous materials. International Journal of Heat and Mass Transfer, 2006, 49(17-18): 3075-3083
[3]. Zhang, X., Huang, Y., & Liu, G. (2020). Numerical analysis of thermal conductivity in open-cell metal foams: Effect of pore size distribution. Journal of Heat Transfer, 142(4), 042601.
[4]. Nguyen, T., Vo, T., & Pham, Q. (2021). Impact of pore structure on thermal conductivity of porous ceramics for thermal barrier coatings. Materials Science Forum, 1016, 407-414.
[5]. Yang, J., & Yu, W. (2018). The impact of porosity on the thermal conductivity of metallic foams: A computational study. International Journal of Heat and Mass Transfer, 123, 189-197.
[6]. Chen, X., Li, H., & Zhou, Y. (2019). Tuning thermal conductivity in nanoporous materials through pore size variation. Applied Physics Letters, 115(3), 033105.
[7]. Li, M., Sun, F., & Wang, H. (2022). Enhancing thermal conductivity of porous materials through pore orientation. Journal of Applied Physics, 131(14), 143506.
[8]. Bianchi, G., Manzolini, G., & Silva, P. (2015). Thermal conductivity of high-temperature porous materials: Effect of material type and pore size. Energy Procedia, 75, 3090-3097.
[9]. Struik, Dirk Jan. "Joseph Fourier". Encyclopaedia Britannica, 12 May. 2024, https://www.britannica.com/biography/Joseph-Baron-Fourier. Accessed 8 August 2024.
[10]. He, X., Funfschilling, D., Nobach, H., Bodenschatz, E., & Ahlers, G. (2012). Effects of pore scale and conjugate heat transfer on thermal convection in porous media. Journal of Fluid Mechanics, 719, 551–586.