


1. Introduction
Stroke, also known as “cerebrovascular accident,” is a severe medical emergency that occurs when brain tissue does not receive enough oxygen and nutrients due to interrupted or reduced blood supply, leading to death within minutes. The global death rate from stroke reached 41.1 per 100,000 people in 2021 [1], making the study of stroke prognosis prediction urgently necessary. Currently, research on stroke prognosis prediction is in a phase of diversified development, with researchers trying to explore key factors affecting prognosis from multiple angles, such as the patient’s age, medical history, physiological and psychological state.
Despite this, the field of stroke still faces difficulties. For example, accurately assessing the recovery potential of older patients, or quantifying the specific impact of social support on patient recovery, requires more refined research methods for detailed answers. Current research shows that factors such as urinary incontinence, consciousness state, loss of time and place, severity of paralysis, sitting balance, and ADL (Activities of Daily Living) score at the time of admission are closely related to patient’s functional recovery. These factors can not only help doctors assess patients’ short-term prognosis but also provide guidance for the long-term rehabilitation process.
This article will focus on how mathematical statistics and machine learning key methods are used for stroke patient prognosis prediction. It will review commonly used mathematical statistical methods in stroke prognosis prediction, such as survival analysis, t-tests, and ANOVA (analysis of variance).
Through this research, it is hoped to provide a more accurate method of prognosis prediction for stroke patients and researchers. Not only can it help medical teams develop more personalized treatment plans, but it can also give patients and families a clearer direction and hope when facing the long-term effects of stroke. At the same time, this study aims to reduce the risks that patients may encounter during the rehabilitation process and improve their quality of life.
2. Overview of Common Mathematical Statistical Methods
This paper summarizes 11 statistical methods commonly used in stroke prognosis prediction and categorizes them based on the research timeline into three classifications: statistical methods applicable to basic data processing before the start of treatment, methods for processing different sample data during the research process, and methods for integrating all data to establish regression models. is shown in Figure 1.
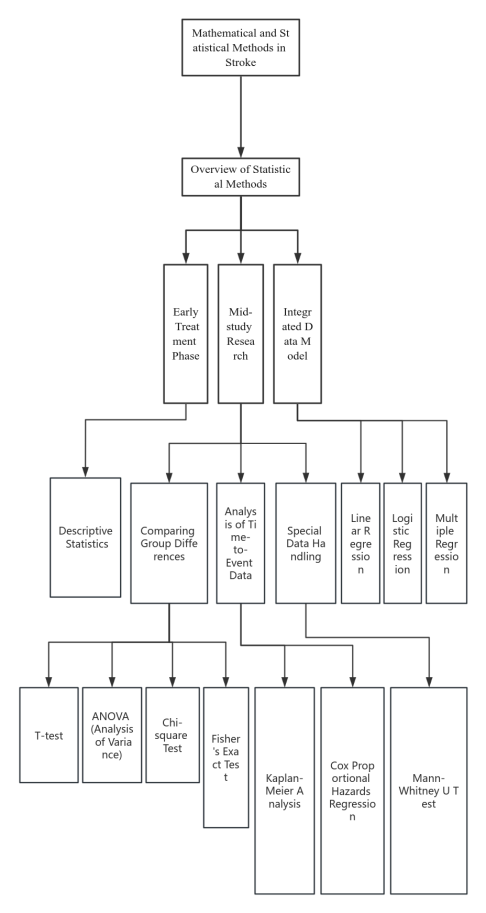
Figure 1. This figure shows the form of 11 methods presented in the article
2.1. Methods Suitable for Analysis in the Early Stages of Treatment
Basic data collected before the start of treatment typically records and assesses the patient’s gender, age, disease history, and provides a simple description and record based on the general situation of the research topic. For example, studies on the association between the location of brain thrombosis and the degree of upper limb recovery would record the location of the brain thrombus in the basic data processing. Descriptive statistics can be used to analyze and integrate such basic data. Descriptive statistics are primarily used to summarize the basic characteristics of the research sample, such as age, gender, disease history, etc. In stroke treatment, it can be applied to describe basic characteristics, evaluate prognostic indicators, and for the presentation and interpretation of data and graphs, providing a foundational data analysis for stroke prognosis prediction.
2.2. Methods Suitable for Data Processing During the Mid-Study
In the mid-study phase, researchers often make further comparisons and contrasts based on the precise research data collected. Different statistical methods can be used according to different comparison factors.
For studies comparing differences between groups, such as comparing the effects of different treatment methods, the incidence of adverse reactions, differences in recovery caused by different factors, T-tests, ANOVA (analysis of variance), chi-square tests, and Fisher’s exact tests can be used to refine the study. Although all four statistical methods are suitable for comparing differences between groups, each has subtle differences, and researchers can choose the appropriate method based on the characteristics of the research data and the research approach. The T-test is mainly used to assess whether there is a significant difference between the mean values of two sets of data, commonly used to analyze data from two groups of patients receiving different treatment schemes or to study the impact of factors such as age and gender on the stroke recovery process. This method helps us understand the specific effects of different treatments or conditions on the outcomes. ANOVA extends this analysis scope, allowing the comparison of the mean values of three or more groups of data to determine whether there are significant differences between them. It is particularly suitable for exploring the impact of various treatment methods on the recovery of stroke patients or evaluating the interaction of different factors such as treatment type, gender, weight, etc., in stroke recovery, revealing how they collectively affect recovery outcomes. The chi-square test adds another dimension to our analysis, used to explore the association between two categorical variables, such as lifestyle habits, blood sugar levels, weight, and other risk factors or patient characteristics and the incidence of stroke. In clinical research, this test method helps identify prognostic factors and guide the optimization of treatment strategies. Finally, Fisher’s exact test provides a powerful tool for analyzing small sample data, especially when the data distribution is uneven or the sample size is small, allowing precise analysis of the correlation between different factors and the prognosis of stroke patients, offering deep insights for limited data sets.
If researchers need to process and analyze data related to time measurements during the study, statistical methods related to time series, such as Kaplan-Meier analysis and Cox proportional hazards regression model, can be used. Kaplan-Meier analysis (survival analysis) is primarily used to estimate the probability of an event (such as death, disease recurrence, etc.) after a certain point in time. By constructing survival curves, it visually shows the change in survival probability over time. This method allows for the comparison of survival situations between different groups, thus evaluating the impact of different factors on survival rates. The Cox proportional hazards regression model, or Cox model, is more suitable for studying the impact of certain factors on survival time. In stroke prognosis prediction, the Cox model is used to identify and quantify risk factors affecting the survival and recovery of patients, thus providing personalized prognostic information and guiding treatment decisions.
When processing data in research, researchers may encounter special data, and at such times, methods suitable for processing special data, such as the Mann-Whitney U test, can be used. The Mann-Whitney U test is a non-parametric statistical method used to compare whether there is a significant difference in the median between two independent samples, especially useful in dealing with small samples or uneven data distribution. In stroke prognosis prediction research, this test method is widely used to evaluate differences in various prognostic indicators among different patient groups, such as risk factors or comparing the effects of different treatment methods, and is particularly suitable for data that do not follow a normal distribution.
2.3. Integrating Data to Build Models
At the end of the research analysis, it is often necessary to establish an integrative model to conclude all data. At this stage, regression analysis is usually employed. There are three types of regression analysis methods available: linear regression, logistic regression, and multiple regression. Each regression method has different characteristics, and the appropriate method can be chosen based on the specific situation of the research to perform regression analysis and build models. Linear regression is a basic but powerful tool among the three regression analyses, mainly used to reveal the linear relationship between variables, widely used to assess continuous outcome variables related to stroke, such as the patient’s functional recovery status, recovery of upper limb movement and language system, and to explore the specific impact of other factors such as gender and pain intensity on patient recovery. Logistic regression is particularly suitable for analyzing categorical outcome variables, such as predicting the survival status of stroke patients or the occurrence of complications. It enables researchers to effectively identify and analyze which factors significantly affect the prognosis of patients. The last regression method, multiple regression analysis, offers a more complex and comprehensive perspective for research, considering multiple independent variables simultaneously—such as age, gender, type and severity of stroke, comorbid conditions, and treatment methods—to explore how they collectively affect the prognosis of stroke patients. The application of multiple regression not only deepens the analysis of the stroke recovery process but also helps identify key intervention points, thus providing more personalized and effective treatment plans for patients.
3. Practical Cases of Mathematical Statistics
3.1. Case Study of Early Treatment Methods
The application of descriptive statistics is actually very common. For example, in one study, researchers used descriptive methods to analyze MRI images after a stroke. They collected 304 T1-weighted MRI images and manually drew masks of brain lesions using the MRIcron tool. Then, by employing descriptive statistics, they tested and compared these masks to determine the different impacts brought by various lesion segmentation techniques and analyzed the main obstacles facing the performance of automated lesion segmentation algorithms. This study focused on T1-weighted MRI images commonly used in post-stroke rehabilitation research, providing valuable resources for improving the accuracy of lesion segmentation methods for such images. This example demonstrates the practical application of descriptive statistics in stroke research, specifically in analyzing and evaluating medical images. Through descriptive statistical methods, researchers were able to better understand the changes in the brain after a stroke and enhance the accuracy of lesion segmentation techniques. [2]
3.2. Mid-Study Methodological Experimental Cases
Many studies require comparing differences between various groups. A research case published in the Neuroscience Bulletin journal in 2012 on stroke prognosis prediction used the T-test to compare different indicators among patients with varying degrees of recovery to determine their precise connection with the modified Rankin Scale (mRS). The study recorded EEG data from 22 stroke patients, including 10 who experienced posterior circulation strokes and 12 who had anterior circulation infarcts (8 in the left hemisphere and 4 in the right). Based on mRS scores, patients were categorized into corresponding groups. Researchers then applied the T-test method, using variables such as the Brain Symmetry Index (BSI), National Institutes of Health Stroke Scale (NIHSS), Glasgow Coma Scale (GCS), and Acute Physiology and Chronic Health Evaluation II (APACHE II) scores for comparisons between different groups. The study’s findings indicated a definitive correlation between these indicators and the patients’ mRS scores. The use of the T-test method concluded that a higher BSI index suggests a poorer short-term prognosis for stroke patients, and acute EEG monitoring may have predictive value for prognosis at 28 days. This suggests that clinical staff should predict outcomes for stroke patients as early as possible to enhance clinical management and reduce short-term mortality rates. [3]
ANOVA (Analysis of Variance), suitable for analyzing multiple groups, effectively helps identify significant differences in disability levels among patients with different types of cerebral infarction during follow-up, providing data support for post-stroke clinical treatment and management. A community-based study on the disability level post-stroke published in 2002 demonstrates the practicality of ANOVA. This study aimed to assess the disability status of stroke patients at 3 and 12 months after their first stroke. Variance analysis was used to examine differences in disability and impairment levels at different time points among patients with different types of cerebral infarction (CI). Specifically, researchers collected disability score data from patients and used ANOVA to compare disability levels among different CI subtypes. The study found that patients with total anterior circulation infarcts (TACI) showed significantly higher levels of disability and impairment at 3 and 12 months compared to other types of CI patients. [4]
When comparing different factors across groups, the chi-square test can be applied to analyze relationships between higher-dimensional factors. Research using the chi-square test explored the association between different clinical and imaging markers and hemorrhagic transformation (HT) in stroke patients. This study established a model of baseline characteristics, including high NIHSS scores, poor collateral circulation, high systolic blood pressure, atrial fibrillation, and the use of antiplatelet drugs, with different types of HT. The chi-square test was used to examine if there was a statistical association between categorical variables (such as patient characteristics and lifestyle habits) and the incidence of stroke. This method revealed which factors are significantly related to the risk of hemorrhagic transformation, thus crucial for determining patient treatment strategies and prognosis assessment. The chi-square test is favored because it effectively handles and analyzes categorical data, assessing the independence or association between two categorical variables. [5]
For comparing small sample data, the appropriate statistical method is the Fisher exact test. One application highlighting the Fisher exact test’s characteristics is a study using initial multiparametric computed tomography (CT) techniques, including whole-brain CT perfusion (WB-CTP), to identify imaging predictors for the development of malignant cerebellar edema (MCE) following acute ischemic cerebellar stroke. The Fisher exact test was used to analyze categorical variables, especially in assessing risk factors for the development of MCE. The study analyzed 51 patients, of which 9 (17.6%) were classified as MCE positive. By comparing differences in various parameters (such as cerebellar blood flow, cerebellar blood volume, mean transit time, and the volume of perfusion defects) between MCE positive and negative patients, the Fisher exact test was used to determine whether these parameters have statistical significance in association with the development of MCE. The application of the Fisher exact test in this study emphasizes its importance and suitability when dealing with small sample sizes and categorical data. [6]
Statistical methods for dealing with time-series data also have some case studies. For predicting the probability of events after a precise time point, especially death, the Kaplan-Meier analysis was applied in a study analyzing the impact of serum omentin-1 levels on the functional prognosis of ischemic stroke in non-diabetic patients. The study utilized the Kaplan-Meier analysis method to analyze patient data treated at a hospital in China from March 2016 to December 2017, assessing the relationship between serum omentin-1 levels and patient prognosis, with a particular focus on the association between low serum omentin-1 levels and the risk of adverse functional outcomes or death. The model was established by dividing patients into different groups based on their serum omentin-1 levels (e.g., high level vs. low level) and comparing their survival rates over time. By plotting Kaplan-Meier survival curves, researchers could visually present how the survival probability of patients in different groups changed over time and evaluate whether there were significant differences in the survival curves between groups using statistical tests (such as the log-rank test). The results showed that lower serum omentin-1 levels were associated with an increased risk of poor prognosis, indicating that omentin-1 could serve as a valuable biomarker for predicting the prognosis of cerebral ischemia in non-diabetic patients. The Kaplan-Meier analysis played a key role in displaying the survival probability of patients over time, highlighting the importance of omentin-1 levels in the prognosis of cerebral ischemia patients. [7] If the study focuses on the impact of factors on survival time, the Cox proportional hazards regression model can be very useful. A study predicting the risk of recurrent stroke or transient ischemic attack (TIA) after non-cardiogenic posterior circulation ischemic stroke (IS) utilized the Cox model. The study included 723 patients with symptoms of non-cardiogenic posterior circulation IS occurring less than 7 days prior. It collected data on stroke risk factors, admission symptoms and signs, acute infarct distribution and responsible cerebral arteries, and any recurrent IS or TIA within a year. COX regression analysis was used to identify risk factors related to recurrent IS or TIA after posterior circulation IS. Ultimately, multivariate COX regression analysis identified major symptoms of dysphagia, recurrent TIAs within the 3 months before the stroke, responsible artery stenosis ≥70%, multi-area infarction, and the absence of antithrombotic treatment at discharge as independent predictors of recurrent IS or TIA. Thus, the Cox model can consider the changing risk ratios over time, making it very useful in assessing time-related risk factors. [8]
There are many cases where the Mann-Whitney U test is needed to handle special data in research. A study published in 2017 that utilized the Mann-Whitney U test aimed to identify imaging predictors for the development of malignant cerebellar edema (MCE) using multiparametric computed tomography (CT) technology (including whole-brain CT perfusion) in acute ischemic stroke patients. The Mann-Whitney U test in this study was used to compare ordinal or continuous variables between MCE positive and negative patients to identify predictors related to the development of MCE. The model was based on WB-CTP imaging parameters, such as CBF deficit volume and pc-ASPECTS (Posterior Circulation - Acute Stroke Prognosis Early CT Score) scores under different parameters. The test results showed that CBF deficit volume, CBV deficit volume, MTT (Mean Transit Time) deficit volume, and TTD (Time to Drain) deficit volume were significantly larger in MCE+ patients than in MCE- patients, with all these parameters having p-values less than 0.001. This means the study identified significant correlations between parameters such as CBF (cerebral blood flow) deficit volume, CBV (cerebral blood volume) deficit volume, and the development of MCE. The reason for choosing the Mann-Whitney U test is that it is suitable for comparing the medians of two independent samples, especially when the data do not assume a normal distribution. This allows researchers to effectively assess the relationship between the development of MCE and various imaging parameters, even when the data distribution is not perfectly symmetrical. [9]
3.3. Research Case Studies on Regression Analysis
In the application of regression analysis models, linear regression is definitely used to reveal the linear relationships between variables. A study published in 2021 explored the predictive role of upper limb (UL) injury in the first two weeks after a stroke on the actual use of the upper limb three months later. The aim was to identify additional predictive factors for upper limb use and the characteristics of patients who failed to achieve normal upper limb use. The study assessed upper limb injury through the Fugl-Meyer Assessment scale and measured actual upper limb use with accelerometers. A linear regression model was established to explore the relationship between upper limb injury at baseline and the ratio of upper limb use, adjusting for secondary variables such as motor-evoked potential (MEP) status and neglect. The study found that the Fugl-Meyer score two weeks post-stroke was a significant predictor of upper limb use three months later, accounting for a large portion of the variance in usage ratio. Including MEP status and other factors in the multivariable model was also significant, enhancing the predictive power for upper limb use. This study demonstrated the flexibility and efficacy of linear regression models in handling multiple variables and exploring their interactions. [10]
For variables that reveal categorical outcomes, logistic regression can be applied. For example, a study assessed the association between small dense low-density lipoprotein cholesterol (sdLDL-C) and acute ischemic stroke (AIS) in terms of risk, severity, and outcomes. In this study, a predictive model was established using logistic regression to screen high-risk patients and predict the prognosis of AIS patients. The reason for choosing logistic regression is its ability to handle categorical outcomes, such as the occurrence of stroke, and assess the relative impact of multiple predictive variables on the outcome. The specific performance in the study was establishing a model including sdLDL-C and other related variables, such as history of diabetes, hypertension, blood sugar levels, with an AUC value of 0.77±0.13. The model could assess the probability of AIS occurrence and effectively differentiate between high-risk and low-risk groups among patients with cerebrovascular disease. In summary, logistic regression provided a quantitative method for risk assessment, helping clinicians to offer better preventive measures and monitor the prognosis for high-risk patients. [11]Lastly, for studies considering multiple independent variables, multiple regression models would be applied. A good example is a study published in “Stroke” in April 2019. This study investigated the relationship between serum netrin-1 levels and the prognosis of patients with ischemic stroke. The purpose was to examine the connection between the levels of serum netrin-1 in the acute phase and the prognosis (including death and major disability) within three months after the stroke. Multiple regression methods were applied in the study. Multivariate regression was used to analyze the relationship between serum netrin-1 levels and the prognosis of patients with ischemic stroke. By dividing patients into four groups based on serum netrin-1 levels and controlling for multiple potential confounding variables, a multivariate regression model was established. The results showed that patients with higher serum netrin-1 levels had a lower risk of death or major disability three months post-stroke, indicating that an increase in serum netrin-1 levels is associated with an improved prognosis for patients with ischemic stroke. Additionally, including serum netrin-1 as a variable in a model containing traditional risk factors significantly improved the risk prediction for death or major disability, suggesting that serum netrin-1 might be a potential biomarker for the prognosis of ischemic stroke. Therefore, the use of multivariate regression analysis is because it can simultaneously consider multiple influencing factors, allowing for a more accurate assessment of the independent relationship between serum netrin-1 levels and stroke prognosis in this study. [12]
4. Conclusion
This article provides a comprehensive analysis of the application of mathematical statistical methods in stroke prognosis prediction and demonstrates the specific application and outcomes of these methods in actual research through case studies. An overview and classification of 11 commonly used statistical methods have detailed the role and advantages of each method in stroke prognosis prediction. The case study section further confirms that these statistical methods can effectively analyze prognostic factors in stroke patients, showing how these methods help understand the impact of different factors on stroke prognosis and guide clinical treatment decisions. It aids researchers and medical teams in improving the accuracy of prognosis prediction, allowing for more personalized treatment plans for patients. Future research on stroke prognosis prediction still has many topics that need attention and discussion. As seen from the case studies analyzed in this article, most cases have the limitation of small sample sizes, restricting the generalizability of the results, limitations in data representativeness, or issues with not considering factors comprehensively. It is hoped that future related experiments will pay more attention to and address these primary difficulties.
References
[1]. CDC. Stroke Facts [Internet]. Centers for Disease Control and Prevention. 2021. Available from: https://www.cdc.gov/stroke/facts.htm
[2]. Liew SL, Anglin JM, Banks NW, Sondag M, Ito KL, Kim H, et al. A large, open source dataset of stroke anatomical brain images and manual lesion segmentations. Scientific Data. 2018 Feb 20;5(1).
[3]. Xin X, Gao Y, Zhang H, Cao K, Shi Y. Correlation of continuous electroencephalogram with clinical assessment scores in acute stroke patients. Neuroscience Bulletin. 2012 Sep 11;28(5):611–7.
[4]. Sturm JW, Dewey HM, Donnan GA, Macdonell RAL, McNeil JJ, Thrift AG. Handicap After Stroke: How Does It Relate to Disability, Perception of Recovery, and Stroke Subtype? Stroke. 2002 Mar;33(3):762–8.
[5]. Kranendonk van, Treurniet KM, Anna. M.M. Boers, Berkhemer OA, Lucie, Chalos V, et al. Clinical and Imaging Markers Associated With Hemorrhagic Transformation in Patients With Acute Ischemic Stroke. Stroke. 2019 Aug 1;50(8):2037–43.
[6]. Fabritius MP, Thierfelder KM, Meinel FG, Othman AE, Dorn F, Sabel BO, et al. Early Imaging Prediction of Malignant Cerebellar Edema Development in Acute Ischemic Stroke. Stroke. 2017 Sep;48(9):2597–600.
[7]. Wu DM, Wang S, Wen X, Han XR, Wang YJ, Shen M, et al. Impact of serum omentin-1 levels on functional prognosis in nondiabetic patients with ischemic stroke. PubMed. 2019 Jan 1;11(3):1854–63.
[8]. Zhang C, Wang Y, Zhao X, Liu L, Wang C, Pu Y, et al. Prediction of Recurrent Stroke or Transient Ischemic Attack After Noncardiogenic Posterior Circulation Ischemic Stroke. Stroke. 2017 Jul;48(7):1835–41.
[9]. Fabritius MP, Thierfelder KM, Meinel FG, Othman AE, Dorn F, Sabel BO, et al. Early Imaging Prediction of Malignant Cerebellar Edema Development in Acute Ischemic Stroke. Stroke. 2017 Sep;48(9):2597–600.
[10]. Lundquist CB, Nielsen JF, Brunner IC. Prediction of Upper Limb use Three Months after Stroke: A Prospective Longitudinal Study. Journal of Stroke and Cerebrovascular Diseases. 2021 Nov;30(11):106025.
[11]. Zhou P, Liu J, Wang L, Feng W, Cao Z, Wang P, et al. Association of Small Dense Low-Density Lipoprotein Cholesterol with Stroke Risk, Severity and Prognosis. Journal of Atherosclerosis and Thrombosis. 2020 Dec 1;27(12):1310–24.
[12]. Guo D, Zhu Z, Zhong C, Peng H, Wang A, Xu T, et al. Increased Serum Netrin-1 Is Associated With Improved Prognosis of Ischemic Stroke. Stroke. 2019 Apr;50(4):845–52.
Cite this article
Li,Z. (2024). Mathematical statistical methods for stroke prognosis prediction and their clinical application research. Theoretical and Natural Science,49,22-29.
Data availability
The datasets used and/or analyzed during the current study will be available from the authors upon reasonable request.
Disclaimer/Publisher's Note
The statements, opinions and data contained in all publications are solely those of the individual author(s) and contributor(s) and not of EWA Publishing and/or the editor(s). EWA Publishing and/or the editor(s) disclaim responsibility for any injury to people or property resulting from any ideas, methods, instructions or products referred to in the content.
About volume
Volume title: Proceedings of the 4th International Conference on Biological Engineering and Medical Science
© 2024 by the author(s). Licensee EWA Publishing, Oxford, UK. This article is an open access article distributed under the terms and
conditions of the Creative Commons Attribution (CC BY) license. Authors who
publish this series agree to the following terms:
1. Authors retain copyright and grant the series right of first publication with the work simultaneously licensed under a Creative Commons
Attribution License that allows others to share the work with an acknowledgment of the work's authorship and initial publication in this
series.
2. Authors are able to enter into separate, additional contractual arrangements for the non-exclusive distribution of the series's published
version of the work (e.g., post it to an institutional repository or publish it in a book), with an acknowledgment of its initial
publication in this series.
3. Authors are permitted and encouraged to post their work online (e.g., in institutional repositories or on their website) prior to and
during the submission process, as it can lead to productive exchanges, as well as earlier and greater citation of published work (See
Open access policy for details).
References
[1]. CDC. Stroke Facts [Internet]. Centers for Disease Control and Prevention. 2021. Available from: https://www.cdc.gov/stroke/facts.htm
[2]. Liew SL, Anglin JM, Banks NW, Sondag M, Ito KL, Kim H, et al. A large, open source dataset of stroke anatomical brain images and manual lesion segmentations. Scientific Data. 2018 Feb 20;5(1).
[3]. Xin X, Gao Y, Zhang H, Cao K, Shi Y. Correlation of continuous electroencephalogram with clinical assessment scores in acute stroke patients. Neuroscience Bulletin. 2012 Sep 11;28(5):611–7.
[4]. Sturm JW, Dewey HM, Donnan GA, Macdonell RAL, McNeil JJ, Thrift AG. Handicap After Stroke: How Does It Relate to Disability, Perception of Recovery, and Stroke Subtype? Stroke. 2002 Mar;33(3):762–8.
[5]. Kranendonk van, Treurniet KM, Anna. M.M. Boers, Berkhemer OA, Lucie, Chalos V, et al. Clinical and Imaging Markers Associated With Hemorrhagic Transformation in Patients With Acute Ischemic Stroke. Stroke. 2019 Aug 1;50(8):2037–43.
[6]. Fabritius MP, Thierfelder KM, Meinel FG, Othman AE, Dorn F, Sabel BO, et al. Early Imaging Prediction of Malignant Cerebellar Edema Development in Acute Ischemic Stroke. Stroke. 2017 Sep;48(9):2597–600.
[7]. Wu DM, Wang S, Wen X, Han XR, Wang YJ, Shen M, et al. Impact of serum omentin-1 levels on functional prognosis in nondiabetic patients with ischemic stroke. PubMed. 2019 Jan 1;11(3):1854–63.
[8]. Zhang C, Wang Y, Zhao X, Liu L, Wang C, Pu Y, et al. Prediction of Recurrent Stroke or Transient Ischemic Attack After Noncardiogenic Posterior Circulation Ischemic Stroke. Stroke. 2017 Jul;48(7):1835–41.
[9]. Fabritius MP, Thierfelder KM, Meinel FG, Othman AE, Dorn F, Sabel BO, et al. Early Imaging Prediction of Malignant Cerebellar Edema Development in Acute Ischemic Stroke. Stroke. 2017 Sep;48(9):2597–600.
[10]. Lundquist CB, Nielsen JF, Brunner IC. Prediction of Upper Limb use Three Months after Stroke: A Prospective Longitudinal Study. Journal of Stroke and Cerebrovascular Diseases. 2021 Nov;30(11):106025.
[11]. Zhou P, Liu J, Wang L, Feng W, Cao Z, Wang P, et al. Association of Small Dense Low-Density Lipoprotein Cholesterol with Stroke Risk, Severity and Prognosis. Journal of Atherosclerosis and Thrombosis. 2020 Dec 1;27(12):1310–24.
[12]. Guo D, Zhu Z, Zhong C, Peng H, Wang A, Xu T, et al. Increased Serum Netrin-1 Is Associated With Improved Prognosis of Ischemic Stroke. Stroke. 2019 Apr;50(4):845–52.