


1. Introduction
Type 2 diabetes(T2D) is a chronic disease that will affect patients throughout life. When the pancreas produces less insulin, glucose cannot enter cells and people develop diabetes. Stephen et al. stated that problems with the pancreas can also destroy other organs [1]. To be more specific Lehrke et. al concluded heart failure is an obvious factor [2]. Additionally, Amanat et al. concluded that T2D had become the 9th most common death reason because of the exponential increase during the past 3 decades [3]. The World Health Organization claimed recently that people die directly due to diabetes is over 1.5 million each year in a total of 422 million people with the disease. Diabetes has always been ignored, but now it should be taken seriously. Therefore, this article aims to explore the different influencing factors that increase the incidence of T2D and assist people in paying attention in the field to avoid further health issues according to their risk level.
The factors that force people to develop T2D are complicated because they include modified and non-modified characteristics, and the characteristics can be interrelated. Domestic and foreign scholars have discovered that hypertension, lack of exercise, diet, weight, smoking, and stress are related to T2D [4-6]. In addition, Ali et al. state that in high-income countries (HICs) patients with diabetes can get medical attention and amputations to reduce the rates of acute glycemic fluctuations and death [7]. However, none of the literature includes BMI or skin thickness that causes T2D which means they’re not systematic and incomplete statistics. The following paper will focus on 8 factors (pregnancies, glucose, blood pressure, skin thickness, insulin, BMI, diabetes pedigree function, and age) and select Binary Logistic Regression to establish the model to find out how these factors influence T2D.
In similar directions, Wang et al. used the particle swarm optimization (PSO) algorithm to test 1053 T2D patients and 914 healthy people. They concluded that fasting blood glucose, heart rate, age, waist-arm ratio, and marital status are the main factors [8]. However, it’s worth highlighting that a study by researchers about Australian early-onset T2D illustrates a different opinion that family history and weight are the main reasons [9]. Family history is like a balloon while obesity is one of the pumps. Excessive obesity in childhood causes the balloon to explode prematurely, but luckily it is easier to control and has less chance of causing heart complications at a young age. Moreover, Petermann et al. support that people with a family history get a higher chance of developing T2D, especially in men with an 8.16 odds ratio compared to a 5.49 odds ratio in women [10]. COVID-19 causes endothelial cell dysfunction, and healthy subjects with a family history of type 2 diabetes have early endothelial dysfunction, in which changes in glucose metabolism, nitric oxide (NO), and reactive oxygen species (ROS) are related to COVID-19. The synthesis causes damage to the expression of its related genes and affects the release of insulin [11]. All this shows that people should pay more attention to preventing T2D in the era of COVID-19. Previous research has shown that it’s conducive to do more exercise to avoid a more serious T2D status for the patients and to keep healthy for the high-risk people.
2. Methodology
2.1. Data source
The dataset used in this paper is collected from the Kaggle website which was collected and updated by Akshay Dattatray Khare in 2023. This dataset contains 768 individuals, and the original format remains in .csv format.
2.2. Variable selection
The data used in this paper count a total of 768 females, including those who have and do not have T2D diabetes, of whom are at least 21 years old of Pima Indian heritage (Table 1). The data contains 8 variables (pregnancies, glucose, blood pressure, skin thickness, insulin, BMI, diabetes pedigree function, and age).
Table 1. List of Variables.
Variables | Type | Range | Meaning |
Pregnancies | Numeric | 0 to 17 | To express the number of pregnancies |
Glucose | Numeric | 0 to 199 mg/dL | To express the Glucose level in blood |
Blood Pressure | Numeric | 0 to 122 mmHg | To express the Blood pressure |
Skin Thickness | Numeric | 0 to 99 mm | To express the thickness of the skin |
Insulin | Numeric | 0 to 846 | To express the insulin level in blood |
BMI | Numeric | 0 to 67.1 | To express the Body mass index |
Diabetes Pedigree | Numeric | 0.08 to 2.24 | To express the diabetes percentage |
Age | Numeric | 21 to 81 | To express the age |
2.3. Method introduction
The method used in this study is Binary Logistic Regression through SPSS. The outcome shows whether the female gets diabetes or not (1 is YES, 0 is NO). The binary logic regression model predicts diabetes using each variable and can be represented as:
\( P=\frac{exp{(a+b1x1+b2x2+b3x3+…bnxn)}}{1+exp{(a+b1x1+b2x2+b3x3+…bnxn)}}\ \ \ (1) \)
Where P is the probability that a case is in a particular category, exp is the exponential function (approx. 2.72), a is the constant (or intercept) of the equation and, b is the coefficient (or slope) of the predictor variables. A logit transformation on \( logit(P)=ln(\frac{P}{1-P} \) ), so the relationship in the least-square regression can be linear:
\( logit(p)=a+b1x1+b2x2+b3x3+…\ \ \ (2) \)
3. Results and discussion
3.1. Data processing
From Figure 1, it can be seen the Pearson correlation coefficient between these factors and T2D. The research data found that there is a positive correlation between 7 of the 8 variables and T2D. The most significant positive correlation is between glucose and T2D, so glucose maybe one of the most important factors. Pregnancies, skin thickness, insulin, BMI, diabetes pedigree function, and age are also positive correlation factors, but they are not as significant as glucose. The correlation between T2D and blood pressure is 0.065, which is close to 0, and p value is 0.072>0.05, so T2D and blood pressure is not relevant. From all the above, what affects T2D are obvious. There are many factors that affect people’s health from many different angles. After analyzing the Pearson correlation matrix of various factors, Chi-Square analysis is conducted to introduce more details.

Figure 1. Relevance Analysis Between Dependent and Independent Variables.
The figure 2 is the Chi-Square of the relation between pregnancies and having T2D. Blue means healthy people and green means people who have T2D. With more frequent of pregnancies, women get more chance to have diabetes.
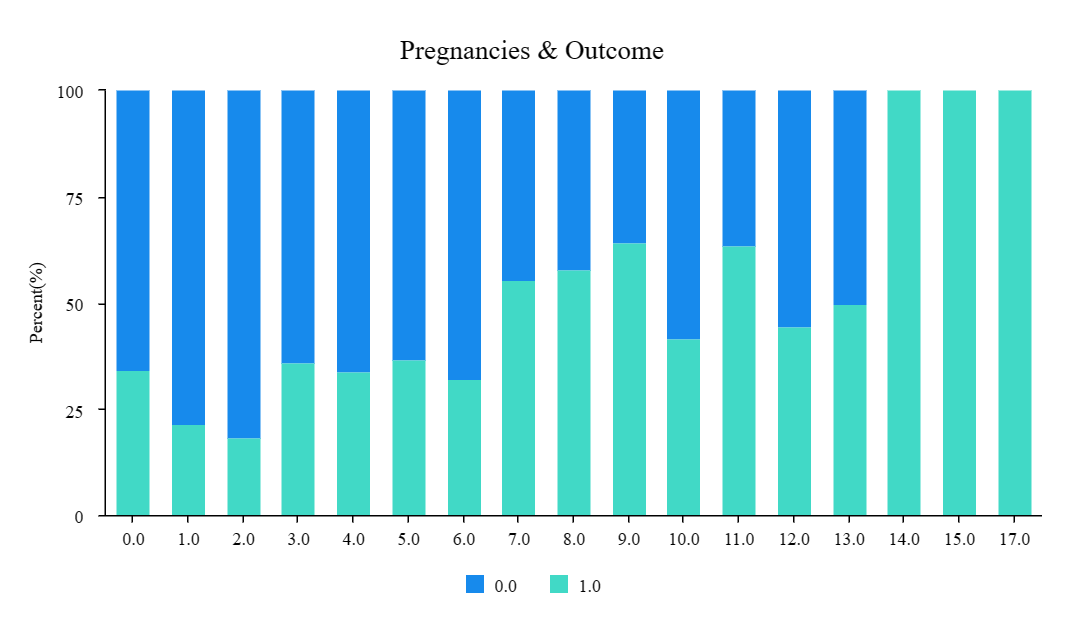
Figure 2. The Chi-Square of Pregnancies & Outcome.
The figure 3 is the Chi-Square of the relation between blood pressure and women with T2D (0 means healthy, 1 means T2D patients). The normal blood pressure range is less than 80mm Hg, but there are also a lot of people who don’t have T2D exceeded the standard. Therefore, high blood pressure will not count as a significant factor in causing people to develop T2D.
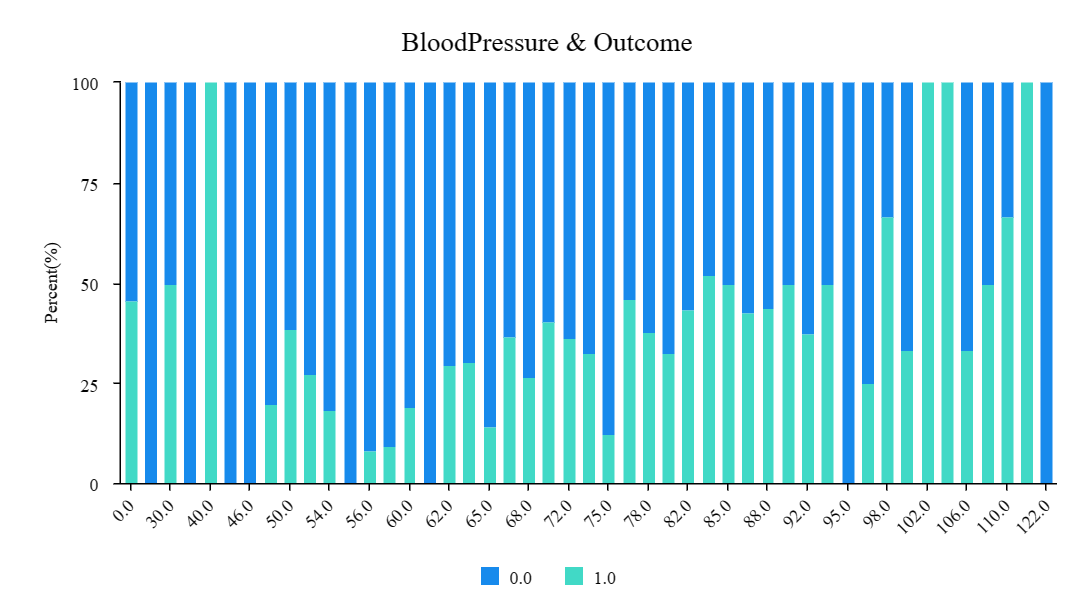
Figure 3. Chi-Square of BloodPressure & Outcome.
The figure 4 is the Chi-Square between the relationship of ages and women who have T2D (0 means healthy, 1 means T2D patients). More than half women get T2D at a younger age, while the most frequent age to get a T2D is between 43-55.
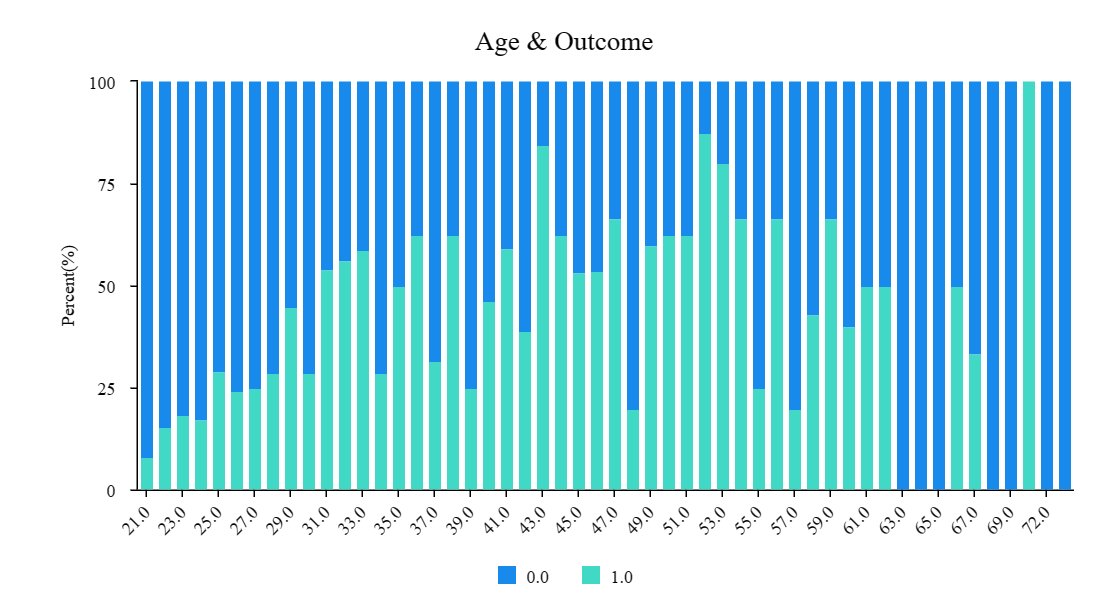
Figure 4. Chi-Square of Age & Outcome.
The figure 5 is a Chi-Square between the relation of Skin thickness and Women with T2D (0 is healthy women, 1 is women with T2D). People with thicker skin get more chance to have T2D.
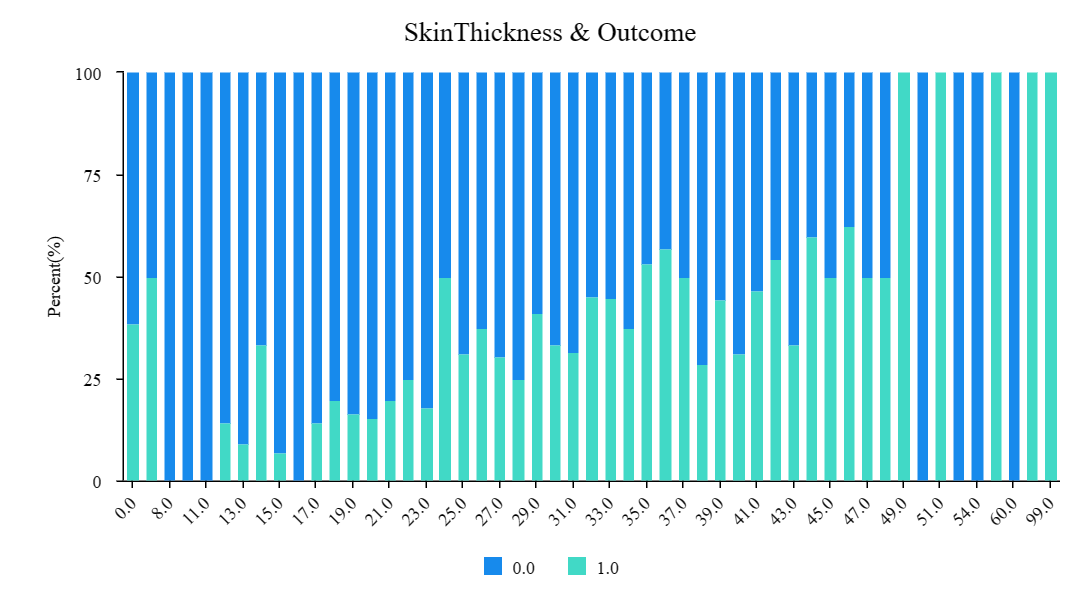
Figure 5. Chi-Square of SkinThickness & Outcome.
3.2. Binary logit regression
Various factors, including the type of pregnancies, glucose, blood pressure, skin thickness, insulin, BMI, diabetes pedigree function, and age were utilized as independent variables. Outcomes (women with T2D) served as the dependent variable. The training set was established with 0.8, employing the lbfgs optimization algorithm, incorporating L2 regularization, and introducing an intercept for logistic regression modeling, Variables are divided into two states: 0.0 (healthy) and 1.0 (T2D). In Table 2, as shown, this training set model about 78% accuracy rate, suggesting that this paper needs more data to make the result more accurate.
Table 2. Training set model evaluation results.
Precision | Recall | f1-score | Samples | |
0.0 (healthy) | 0.80 | 0.89 | 0.84 | 401 |
1.0 (T2D) | 0.74 | 0.58 | 0.65 | 213 |
Accuracy | 0.78 | 614 | ||
Average | 0.77 | 0.74 | 0.75 | 614 |
Average (comprehensive) | 0.78 | 0.78 | 0.78 | 614 |
The fitting model is then tested. In table 3, the accuracy rate is similar to the training table. This shows the prediction results of this logistic regression model are good. The final model has an accuracy of about 78%, and fl-score 0.77 on the test set. This model effect is acceptable, but still needs more data to make it more accurate.
Table 3. Testing set model evaluation results.
Precision | Recall | f1-score | Samples | |
0.0 (healthy) | 0.79 | 0.90 | 0.84 | 99 |
1.0 (T2D) | 0.76 | 0.56 | 0.65 | 55 |
Accuracy | 0.78 | 154 | ||
Average | 0.77 | 0.73 | 0.74 | 154 |
Average(comprehensive) | 0.78 | 0.78 | 0.77 | 154 |
4. Conclusion
The current study selected diverse data and focuses on influencing factors that may be associated with developing T2D. Pregnancies, glucose, blood pressure, skin thickness, insulin, BMI, diabetes pedigree function, and age are the important variables to predict T2D. The accuracy on both testing and training table is not accurate enough, but with a decent result 77%. It is undeniable that due to the limited amount of data, only 8, this model may have deviation in addition to factors, and the sample only covers women, causing possible differences, which may also affect the accuracy of the results. For further research, more relevant data should be collected, not just average values, but also extreme values, which will bring important information to the progress of preventing or treating diabetes. Analyze data patterns to identify key factors that significantly influence an individual’s development of diabetes. This may lead to better access to preventive health care measures for high-risk groups. In this experiment, Chi-Square was used to display the data differences more clearly, and Logit regression was used to maximize the utilization of the data. This also yields other factors besides known influencing factors such as blood sugar, which can be further investigated to point out the direction for future related research. Use more advanced models to analyze potential interactions and nonlinear effects between variables.
References
[1]. Stephen B 2016 Pathophysiology of type 2 diabetes: The evolution of our understanding. The Journal of family practice.
[2]. Lehrke M and Marx N 2017 Diabetes mellitus and heart failure. The American journal of medicine.
[3]. Amanat S, et al. 2020 Exercise and type 2 diabetes. Advances in experimental medicine and biology.
[4]. Agnieszka P, Bielka W and Pawlik A 2022 Hypertension and type 2 diabetes-the novel treatment possibilities. International journal of molecular sciences.
[5]. Qiu S, et al. 2018 Exercise training and endothelial function in patients with type 2 diabetes: A meta-analysis. Cardiovascular diabetology.
[6]. Kolb H and Martin S 2017 Environmental/lifestyle factors in the pathogenesis and prevention of type 2 diabetes. BMC medicine.
[7]. Ali M K, Pearson S J, Selvin E and Gregg E W 2022 Interpreting global trends in type 2 diabetes complications and mortality. Diabetologia.
[8]. Wang S, et al. 2024 Analysis of the risk factors and screening model establishment of type 2 diabetes mellitus based on the particle swarm optimization BP Neural Network. Working paper.
[9]. Kao K T and Sabin M A 2016 Type 2 diabetes mellitus in children and adolescents. Australian family physician.
[10]. Petermann F, et al. 2018 Association between type 2 diabetes and physical activity in individuals with family history of diabetes. Gaceta sanitaria.
[11]. Alvarado V N 2021 Could a family history of type 2 diabetes be a risk factor to the endothelial damage in the patient with covid-19. Medical hypotheses.
Cite this article
Zheng,R. (2024). Research on the influencing factors of type 2 diabetes. Theoretical and Natural Science,49,46-52.
Data availability
The datasets used and/or analyzed during the current study will be available from the authors upon reasonable request.
Disclaimer/Publisher's Note
The statements, opinions and data contained in all publications are solely those of the individual author(s) and contributor(s) and not of EWA Publishing and/or the editor(s). EWA Publishing and/or the editor(s) disclaim responsibility for any injury to people or property resulting from any ideas, methods, instructions or products referred to in the content.
About volume
Volume title: Proceedings of the 4th International Conference on Biological Engineering and Medical Science
© 2024 by the author(s). Licensee EWA Publishing, Oxford, UK. This article is an open access article distributed under the terms and
conditions of the Creative Commons Attribution (CC BY) license. Authors who
publish this series agree to the following terms:
1. Authors retain copyright and grant the series right of first publication with the work simultaneously licensed under a Creative Commons
Attribution License that allows others to share the work with an acknowledgment of the work's authorship and initial publication in this
series.
2. Authors are able to enter into separate, additional contractual arrangements for the non-exclusive distribution of the series's published
version of the work (e.g., post it to an institutional repository or publish it in a book), with an acknowledgment of its initial
publication in this series.
3. Authors are permitted and encouraged to post their work online (e.g., in institutional repositories or on their website) prior to and
during the submission process, as it can lead to productive exchanges, as well as earlier and greater citation of published work (See
Open access policy for details).
References
[1]. Stephen B 2016 Pathophysiology of type 2 diabetes: The evolution of our understanding. The Journal of family practice.
[2]. Lehrke M and Marx N 2017 Diabetes mellitus and heart failure. The American journal of medicine.
[3]. Amanat S, et al. 2020 Exercise and type 2 diabetes. Advances in experimental medicine and biology.
[4]. Agnieszka P, Bielka W and Pawlik A 2022 Hypertension and type 2 diabetes-the novel treatment possibilities. International journal of molecular sciences.
[5]. Qiu S, et al. 2018 Exercise training and endothelial function in patients with type 2 diabetes: A meta-analysis. Cardiovascular diabetology.
[6]. Kolb H and Martin S 2017 Environmental/lifestyle factors in the pathogenesis and prevention of type 2 diabetes. BMC medicine.
[7]. Ali M K, Pearson S J, Selvin E and Gregg E W 2022 Interpreting global trends in type 2 diabetes complications and mortality. Diabetologia.
[8]. Wang S, et al. 2024 Analysis of the risk factors and screening model establishment of type 2 diabetes mellitus based on the particle swarm optimization BP Neural Network. Working paper.
[9]. Kao K T and Sabin M A 2016 Type 2 diabetes mellitus in children and adolescents. Australian family physician.
[10]. Petermann F, et al. 2018 Association between type 2 diabetes and physical activity in individuals with family history of diabetes. Gaceta sanitaria.
[11]. Alvarado V N 2021 Could a family history of type 2 diabetes be a risk factor to the endothelial damage in the patient with covid-19. Medical hypotheses.