


1. Introduction
The prediction of stock trends can effectively help investors maximize return on their future investments and the stock market’s uncertainty poses challenges for consistent returns. The factors affecting stocks including valuation, price-earnings ratio, price-to-book ratio, supply-demand relationship, public psychology, and national policy orientation.
Investors also learn about stock prices through the news media. The stock market is a multivariate information highly concentrated market, the successful operation of the stock market, the price of the stock should be able to extract all the information on the market, this kind of information can affect the stock price changes and fluctuation of information, and further affect the rate of return on investment information, information content is very extensive, including by major news agencies or public release of information. On the other hand, whether such information can be used as a standard for stock price fluctuations depends on whether the majority of investors know such information and how they understand and digest it.
Meanwhile, in the era of globalization and information, all kinds of information can be spread to various places through news, which means that news absorbs a large amount of diversified information, and some information is very likely to be one of the factors affecting the future trend of the stock market. Meanwhile, the uncertainty of its content, such as exaggeration, false information, and bias may also affect human judgment and affect the stock market to a certain extent. This project aims to collect UK news information from the Guardian and transform unstructured text data into usable structured data information, view, or text through machine learning and other technologies, to predict the future trend of the UK stock market potentially affected by the news, particularly the FTSE 100 index.
2. Literature Review
Stock price movement prediction has been more and more a valued matter due to the volatility of the stock market since the outbreak of COVID-19. Even though Efficient Market Hypothesis [1] claims the lack of predictability of the stock market, researchers have applied various techniques to analyze the movement of the stock market.
Research about sentiment correlation in financial news applied NLP techniques to understand news sentiment of 87 companies among the most reported on Reuters for a period of 7 years [2-3]. It draws a conclusion that there exists a this work but statistically significant association this work strong media sentiment and abnormal market return as this work as volatility. A report presented a sentiment analysis methodology to quantify and statistically validate which assets could qualify for trading from social media analytic in an ex_ante configuration. The results of this report suggest that, for the majority of financial instruments considered, this work changes in social media sentiment do not contain lead-time information about securities’ his work returns when evaluated from a data-set of up to 10% of all messages from Twitter’s network [4-6].
In the sentiment analysis of news, Sousa used the two-way encoder table from Transformers BERT and made suggestions for investment decisions. He fine-tuned this work stock market sentiment analysis model by marking the sentiment in stock news as positive, negative, and neutral. A stock markets. research introduced a method of mining text opinions to analyze Korean language news [7]. A novel brain-inspired evolving Mamdani-Takagi-Sugeno Neural-Fuzzy Inference System (eMTSFIS) , in which the eMTSFIS predictive model possesses synaptic mechanisms and information processing capabilities of the human hippocampus, results in a more robust and adaptive forecasting model. The trading strategy of the proposed system is based on the moving-averages-convergence/divergence (MACD) principle to generate buy-sell trading signals. By introducing forecasting capabilities to the computation of the MACD trend signals, the lagging nature of the MACD [8-10].
The fuzzy models that developed the two nonlinear processes this work developed by TS Technology, using the standard S&P 500 and the software NASA, for the purpose of forecasting the stock market for the next this work. The development of TS fuzzy models is accomplished by using model input data to determine membership functions in rule antecedents. The algorithm shows that the average relative error margins of the linear model and the fuzzy model calculate similar evaluation criteria, therefore, the fuzzy model can replace the linear model as the solution [11-12].
3. Data
For this experiment, this work aims to predict FTSE100 stock price movement through analyzing business news sentiment post-covid (January 1, 2020, to December 31, 2021). The FTSE100 stock price information is taken directly from the London Stock Exchange website and then by analyzing the daily increase, an extra column is added to the generated. csv file. The added column includes the classification of the daily performance of the FTSE100 as “rise” and “fall”. If the FTSE100 closed negative for the day, the value will be a 0, whereas, if the FTSE closed positive the value will be a 1. For business news, this work used the Guardian API to collect business news published by the Guardian. By filtering the news with the targeted time period (January 1, 2020, to December 31, 2021) and by the business news sections of the Guardian. The resultant data set yields 8414 news articles from the business section of the Guardian. The data and the meta-data of each article, comes in a JSON format. This work retrieve the following data from the JSON file of each article: the first published date, the news headline, and the news text body.
4. Methodology
The experiment can be divided into two parts, the data pre-processing of the business news and FTSE100 index data, and the machine learning of the processed data.
4.1. Data Preprocessing
Use the search endpoint of the Guardian to get JSON files of business news from the time period. Convert JSON article to a python dictionary, retrieve the targeted data, and put it into a Pandas data frame, resulting in three columns: published_date, headline, and the text body of every news article comes with HTML tags. Use Beautiful Soup to get rid of all tags, scripts, and styles from the text main body.
After having articles with their body text without HTML tags, proceed to clean up the text data of each article. For each article, the text of the news headline and body is first tokenized with the NLTK tokenizer. This breaks every sentence into individual words. During the process, a regular expression is used to remove numbers, emails, and site links from the text. Then this work will remove stop words from the texts with the stop words from the NLTK library. Then this work performs stemming to remove all grammar tenses and transform each word in the texts to its original form. This work aggregate all news articles together for each day and compute sentiment measures using two different sentiment dictionaries: TextBlob and VADER. VADER returns three results (neg, pos, neu, compound) and TextBlob returns two results (polarity and subjectivity). By running the two sentiment analysis on both the headline and body of the news, this work gets 12 features from sentiment analysis.
For the FTSE100 index data, by evaluating both day-to-day change and daily change, this work has two columns recording both the performance of day to day and performance of the single day. If the change is larger or equal to 0, the performance is recorded as 1 and otherwise, it is recorded as 0. And the two performance columns are the target features of the machine learning experiment.
4.2. Machine Learning
This work now uses six different machine learning classification algorithms to predict the FTSE 100 price movement. The six machine learning classification algorithms include five machines learning models and one voting classifier. The five machine learning classification algorithms include Logistic Regression, Naive Bayes, K-Nearest neighbour, Random Forest and Support Vector Machines. This work divides the data set into a 70-30 split for training and testing. This work then performs the machine learning procedure on the T + 1 scenario (news corresponds to the FTSE100 performance the next day). Model performance (precision, recall, F-score, accuracy) is calculated for each model.
5. Result
The output, Confusion Matrices for Machine Learning Algorithms are presented below (figures 1-6).
|
|
Figure 1. Confusion Matrix for SVM. | Figure 2. Confusion Matrix for random forest. |
|
|
Figure 3. Confusion Matrix for KNN. | Figure 4. Confusion Matrix for Naive Bayes. |
|
|
Figure 5. Confusion Matrix for Logistic Regression. | Figure 6. Confusion Matrix for Voting Classifier. |
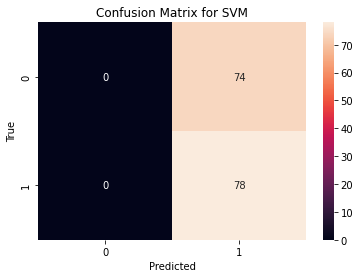
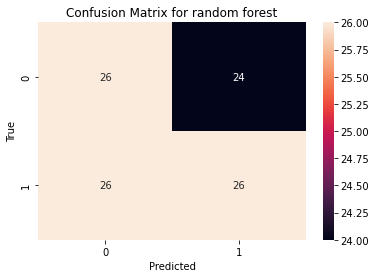
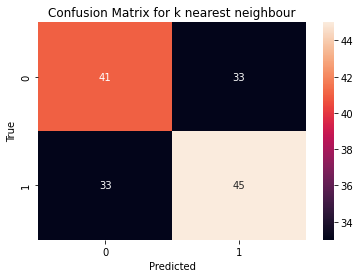
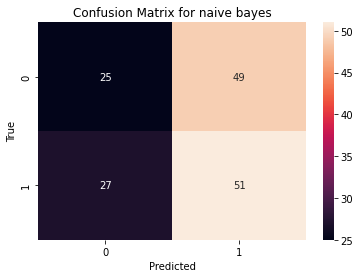
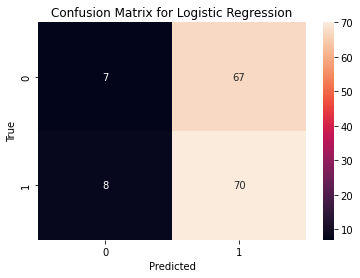
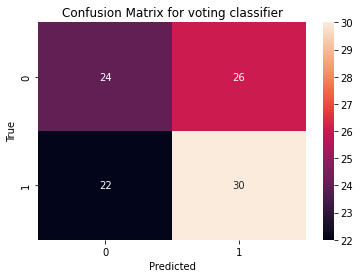
Table 1. Overview of Different Machine Learning Models.
MLA | F1 Score_1 | F1 Score_0 | Accuracy | Precision | Recall |
Naïve Bayes | 0.57 | 0.4 | 0.5 | 0.51 | 0.65 |
Random Forest | 0.56 | 0.5 | 0.53 | 0.52 | 0.5 |
SVM | / | / | 0.51 | 0.51 | 1.0 |
Logistic Regression | 0.65 | 0.16 | 0.51 | 0.51 | 0.90 |
K Nearest Neighbour | 0.58 | 0.55 | 0.57 | 0.51 | 0.90 |
Voting Classifier | 0.65 | 0.32 | 0.53 | 0.54 | 0.58 |
6. Discussion
This work used 2 types of sentiment analysis method vader and text blob, 5 different machine learning algorithms, K-NN, Logistic Regression, Naïve Bayes, Random Forest (importance of feature), Support Vector Machine. And this work applied a voting classifier to gather the effect of 5 different algorithms to provide a comprehensive view of the model.
Such five algorithms provide accuracy near and above 50%, in which K-NN performs the best with an accuracy of 57%.
And it is surprising that while the positive f1 scores range from 0.56 to 0.65, the negative f1 score ranges from 0.16 to 0.55. It can be seen that for all the models, positive f1 scores are more stable and higher than the negative score. Logistic Regression gives the greatest difference when the positive f1 score is 0.65 and the negative is only 0.16. It implies that distribution of positive and negative stock volatility can influence the performance of machine learning. And indeed, after the statistics, in the duration of 507 days, there are 31 more positive days than negative days, which is about 13% more. It means the machine learning of the model has 13% more chance to learn about positive prediction than negative. On the other hand, News media as a medium for transmitting information, is supposed to be neutral to some extent, and the wording tends to be euphemistic. So, it’s not like other this work like this work that will contain more personal emotion. These are probably the main reasons why there is a prominent bias this work positive and negative predictions.
Moreover, the random forest machine learning algorithm provides the importance of different features defined by two sentiment analysis methods. The figure 7 show the different methods of random forest below.
|
Figure 7. Random Forest Feature Importance. |
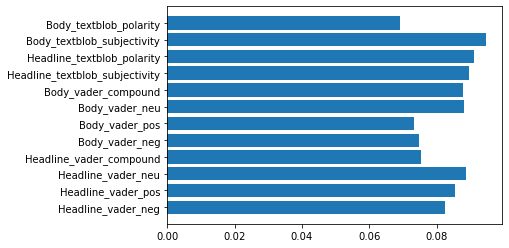
In the bar chart, the text blob headline subjectivity plays the most important role, follow this work by the text blob headline polarity, while other features have similar importance. Specifically, vader body positive and negative, vader headline compound and vader headline negative, these 4 features seem to have an exactly equal importance. Logically, different features are unlikely to perform the same proportion, especially when this work include a great capacity of information from The Guardian and New York Times. So, this work might have over pre-processed this work news and headlines. Besides, it can be seen that the text blob features have a more normal drift. So it might also be just caused by the difference this work 2 sentiment analysis methods. But after all, from this chart, this work can still see the distribution of 12 features from 2 sentiment analysis methods which gives a clear outline.
What could be improved: In the initial plan, this work plan to use Flair, a deep learning model for sentiment analysis to provide more features. This work, in practice, Flair runs too slow to analysis all the texts of this project. With proper GPU acceleration set up, this work might have more precise sentiment analysis features available. This work compared the model performance of predicting both daily performance of FTSE100 and day to day performance of FTSE100. The result is that when predicting day-to-day performance, the model is generally under performing. This is likely because day to day performance includes days from Friday to the next Monday (a three day difference). This work, this work are only using news on Sunday in this work prediction. By processing and sorting news data in more detail, this work may be able to further improve model performance when predicting day to day stock performance. This work compared the model performance of using z-score standardized sentiment features and the performance of using direct sentiment features. The result is that standardized sentiment features are performing worse. This is likely because first, not all sentiment features should be standardized. Second, z-score normalization may not be the ideal way of normalizing and standardizing sentiment data. The sentiment features from the news are not as precise as this work hoped. This is because news tends to use more nuanced language and the sentiment of which is not as easily extracted as this work or reedits. The precision will be drastically improved if this work could train a sentiment analysis model of this work own specifically for business news analysis. By adding more traditional stock performance indicators to this work feature list, this work might have a better performing model.
7. Conclusion
This work applies five machine learning models and a voting classifier that evaluates outcomes from the five machine learning algorithms to predict stock price.
It is not surprising that different machine learning algorithms yielded different results. But applying a voting classifier cannot institutionally increase the accuracy of the model. Also, a more balanced data set that contains a similar size of positive and negative value is proposed to help develop equal ability to predict stock volatility in both directions, which means the sample size needs to be even bigger. And when the accuracy gets lower, the headlines get shorter after per-processing. Therefore, potential ways to better arrange the data and news should be considered.
References
[1]. S. Barsa, "Classification of Hot News for Financial Forecast Using NLP Techniques," International Conference on Big Data, New Delhi, 2018.
[2]. S. Mehtab and J. Sen, "A Robust Predictive Model for Stock Price Prediction Using Deep Learning and Natural Language Processing," School of Computing and Analytics, Kolkata, 2019.
[3]. S. Mohan, S. Mullapudi, S. Sammeta, P. Vijayvergia and D. C. Anastasiu, "Stock Price Prediction Using News Sentiment Analysis," 2019 Fifth International Conference on Big Data Computing Service and Applications, New Delhi, 2019.
[4]. R. Akita, A. Yoshihara, T. Matsubara and K. Uehara, "Deep Learning for Stock Prediction Using Numerical and Textual Information," Kobe University, Seoul, 2019.
[5]. S. Kumar and S. Acharya, "Application of Machine Learning Algorithms in Stock Market Prediction: A Comparative Analysis," Indian Institute of Management, Indore, 2020.
[6]. I. Chatterjee, J. Gwan, Y. J. Kim, M. S. Lee and M. Cho, "An NLP and LSTM BasedStock Prediction and Recommender System for KOSDAQ and KOSPI," Intelligent Human Computer Interaction, 2021.
[7]. D. Shah, I. Haruma and F. Zulkernine, "Predicting the Effects of News Sentiments on the Stock Market," School of Computing, Queens University, Kingston, 2019.
[8]. x. Li, H. Xie, L. Chen, J. Wang and X. Deng, "News impact on stock price return via sentiment analysis," City University of Hong Kong, Hong Kong, 2014.
[9]. X. Wan, J. Yang, S. Marinov, J. P. Calliess, S. Zohren and X. Dong, "Sentiment correlation in financial news networks and associated market movements," Nature Portfolio, 2021.
[10]. I. Zheludev, R. Smith and T. Aste, "When Can Social Media Lead Financial Markets," Scientific Reports, 2014.
[11]. M. G. Sousa, K. Sakiyama, L. S. Rodrigues, P. H. Moraes, E. R. Fernandes and E. T. Matsubara, "BERT for Stock Market Sentiment Analysis," International Conference on Tools with Artificial Intelligence, New Delhi, 2019.
[12]. Y. Kim, S. R. Jeong and I. Ghani, "Text Opinion Mining to Analyze News for Stock Market Prediction," Kookmin University, Seoul, 2014.
Cite this article
Jin,C.;Liu,R.;Tang,B.;Cai,B. (2023). Predict FTSE100 Stock Movements Using Business News Sentiment and Machine Learning. Theoretical and Natural Science,2,50-55.
Data availability
The datasets used and/or analyzed during the current study will be available from the authors upon reasonable request.
Disclaimer/Publisher's Note
The statements, opinions and data contained in all publications are solely those of the individual author(s) and contributor(s) and not of EWA Publishing and/or the editor(s). EWA Publishing and/or the editor(s) disclaim responsibility for any injury to people or property resulting from any ideas, methods, instructions or products referred to in the content.
About volume
Volume title: Proceedings of the International Conference on Computing Innovation and Applied Physics (CONF-CIAP 2022)
© 2024 by the author(s). Licensee EWA Publishing, Oxford, UK. This article is an open access article distributed under the terms and
conditions of the Creative Commons Attribution (CC BY) license. Authors who
publish this series agree to the following terms:
1. Authors retain copyright and grant the series right of first publication with the work simultaneously licensed under a Creative Commons
Attribution License that allows others to share the work with an acknowledgment of the work's authorship and initial publication in this
series.
2. Authors are able to enter into separate, additional contractual arrangements for the non-exclusive distribution of the series's published
version of the work (e.g., post it to an institutional repository or publish it in a book), with an acknowledgment of its initial
publication in this series.
3. Authors are permitted and encouraged to post their work online (e.g., in institutional repositories or on their website) prior to and
during the submission process, as it can lead to productive exchanges, as well as earlier and greater citation of published work (See
Open access policy for details).
References
[1]. S. Barsa, "Classification of Hot News for Financial Forecast Using NLP Techniques," International Conference on Big Data, New Delhi, 2018.
[2]. S. Mehtab and J. Sen, "A Robust Predictive Model for Stock Price Prediction Using Deep Learning and Natural Language Processing," School of Computing and Analytics, Kolkata, 2019.
[3]. S. Mohan, S. Mullapudi, S. Sammeta, P. Vijayvergia and D. C. Anastasiu, "Stock Price Prediction Using News Sentiment Analysis," 2019 Fifth International Conference on Big Data Computing Service and Applications, New Delhi, 2019.
[4]. R. Akita, A. Yoshihara, T. Matsubara and K. Uehara, "Deep Learning for Stock Prediction Using Numerical and Textual Information," Kobe University, Seoul, 2019.
[5]. S. Kumar and S. Acharya, "Application of Machine Learning Algorithms in Stock Market Prediction: A Comparative Analysis," Indian Institute of Management, Indore, 2020.
[6]. I. Chatterjee, J. Gwan, Y. J. Kim, M. S. Lee and M. Cho, "An NLP and LSTM BasedStock Prediction and Recommender System for KOSDAQ and KOSPI," Intelligent Human Computer Interaction, 2021.
[7]. D. Shah, I. Haruma and F. Zulkernine, "Predicting the Effects of News Sentiments on the Stock Market," School of Computing, Queens University, Kingston, 2019.
[8]. x. Li, H. Xie, L. Chen, J. Wang and X. Deng, "News impact on stock price return via sentiment analysis," City University of Hong Kong, Hong Kong, 2014.
[9]. X. Wan, J. Yang, S. Marinov, J. P. Calliess, S. Zohren and X. Dong, "Sentiment correlation in financial news networks and associated market movements," Nature Portfolio, 2021.
[10]. I. Zheludev, R. Smith and T. Aste, "When Can Social Media Lead Financial Markets," Scientific Reports, 2014.
[11]. M. G. Sousa, K. Sakiyama, L. S. Rodrigues, P. H. Moraes, E. R. Fernandes and E. T. Matsubara, "BERT for Stock Market Sentiment Analysis," International Conference on Tools with Artificial Intelligence, New Delhi, 2019.
[12]. Y. Kim, S. R. Jeong and I. Ghani, "Text Opinion Mining to Analyze News for Stock Market Prediction," Kookmin University, Seoul, 2014.