


1.Introduction
1.1.Background of Cognitive Impairment and Dementia
The morphology and function of the brain are significantly altered by aging[1] (Figure 1). Memory loss and shifts in behavior are all cognitive deficiencies that are often accompanied by these age-related changes in the brain[1]. It is found that about 40% of elders aged 65 or above experience age-related memory impairment, and about 10% exhibit mild cognitive impairment (MCI), which is more severe memory loss[2]. Each year, 10-20% of individuals with MCI transition to dementia, which is defined as acquired progressive cognitive impairment severe enough to affect daily activities[3]. Dementia is strongly associated with brain aging and is one of the leading causes of disability, dependency, and mortality[3], with elders aged 65 or above being the most vulnerable[4]. It is estimated that 55 million individuals worldwide currently suffer from dementia[2].
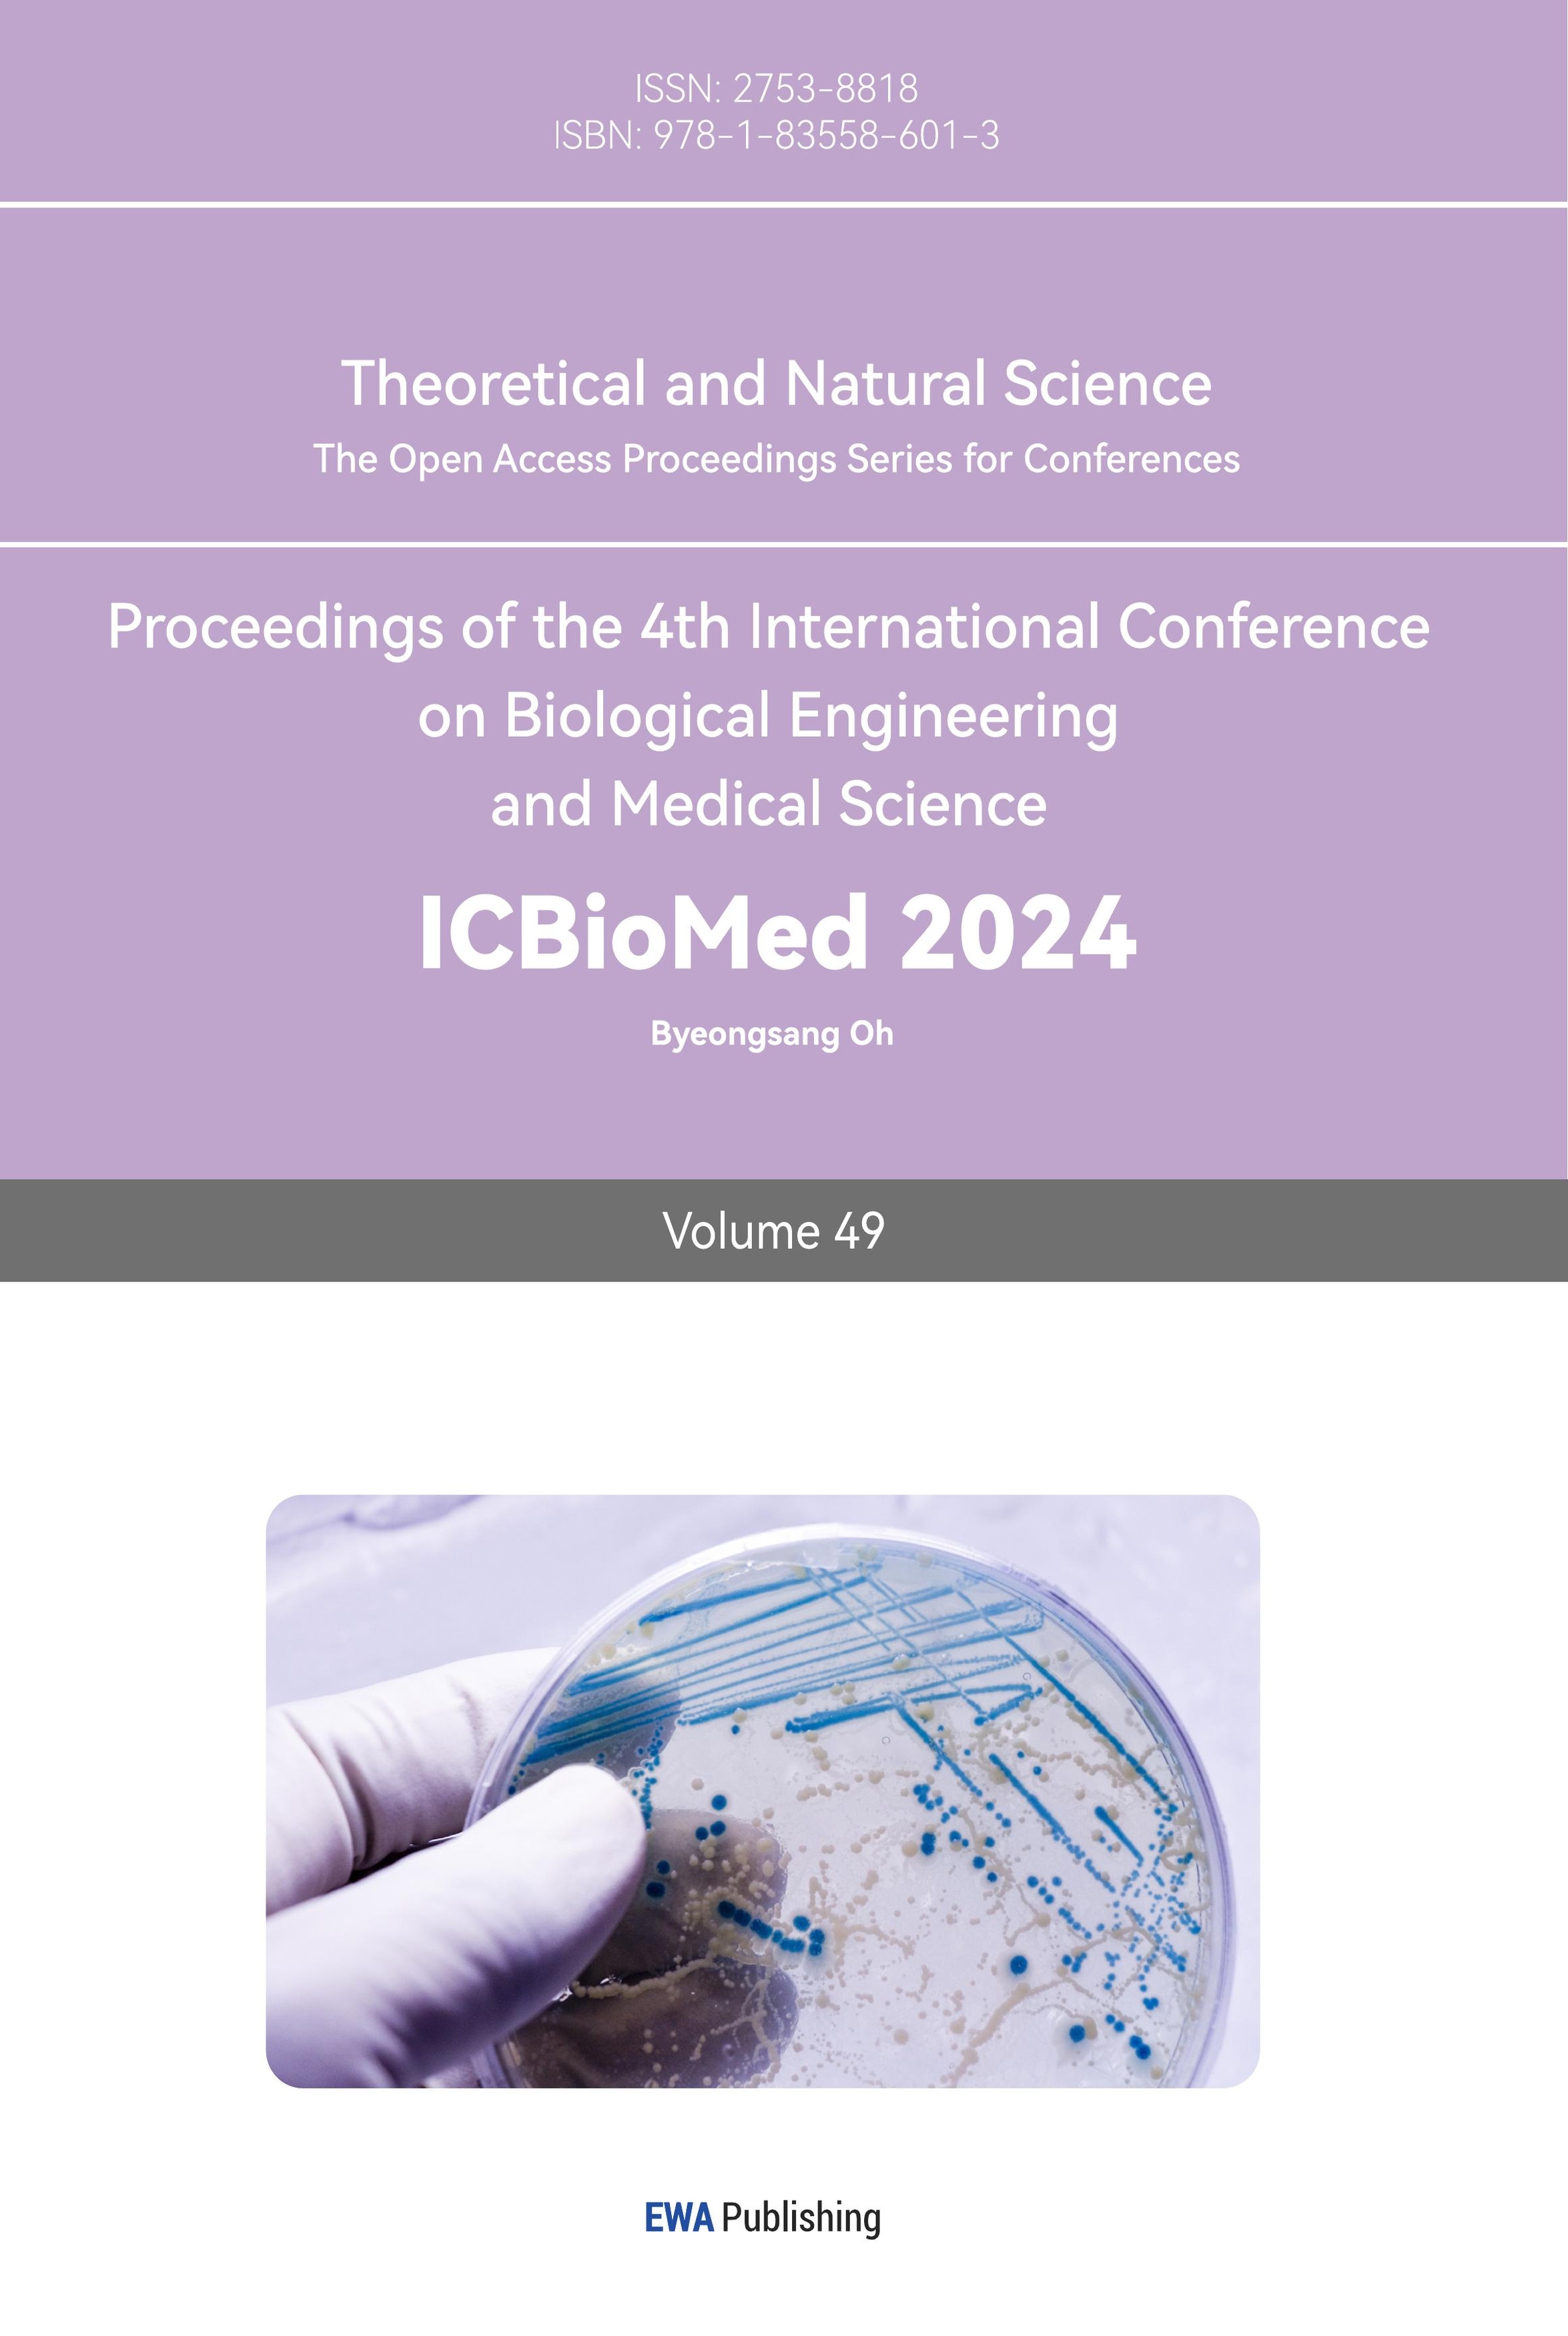
Among individuals with dementia, Alzheimer’s disease (AD) accounts for over two-thirds of cases in adults aged 65 and above[5]. The symptoms of AD progresses gradually. Early learning and memory problems, as well as subsequent impairments in complex attention, executive function, spatial function, language, and social behavior, are characteristics of typical AD cases[6]. The prevalence of AD increases over age (Figure 2), and the rising cases of elders diagnosed with AD continue to raise the burden on families and public health, with AD-related healthcare costs reaching nearly $500 billion annually[7]. By 2050, it is estimated that the cost of treating AD and dementia in the United States will pose an even heavier burden on the healthcare system, reaching a total of $1 trillion[8].

Figure 1. Hallmarks of age-related cerebral atrophy. Morphological changes include (1) ventricular enlargement, (2) cortical thinning, (3) gray and white matter volume loss, and (4) sulcal widening[1].
1.2.Current Treatment and Research of Age-Related Cognitive Impairment and Dementia
There is no effective cure for MCI or AD as of now. The most widely-used symptomatic treatment is acetyl-cholinesterase inhibitors (AChEIs), such as donepezil, galantamine, and rivastigmine, which prevent the breakdown of acetylcholine in the synapses. However, AChEIs should be administered with caution in individuals with heart conduction abnormalities due to the possibility of experiencing irregularly slow heart rates. On the other hand, anti-NMDA medications such as memantine have the potential to prevent glutamate-mediated neurotoxicity from developing as AD progresses with increased neuron death[6]. However, both AChEIs and anti-NMDA medications have not been found to alter the progression of the disease or the rate of memory and cognitive function deterioration[3] (Figure 3, line 3). Other therapies such as aducanumab and lecanemab directed Aβ amyloid plaques using anti-Aβ monoclonal antibodies[10]. Aducanumab is a recently approved, disease-modifying treatment for mild AD, but it has been controversial because its impact on AD-related symptoms remains unproven. Lecanemab is another recently approved, promising treatment, and clinical trials showed that it reduced the rate of memory and cognitive decline over 18 months while reducing brain amyloid markers[11]. However, lecanemab is only significantly effective in early AD cases.
|
|
|
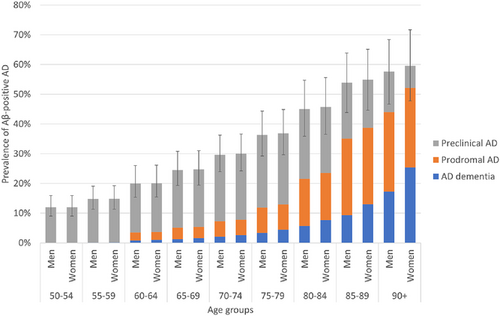
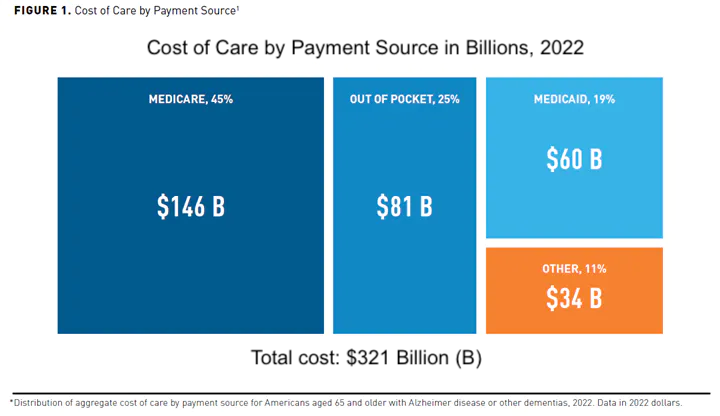
Figure 2. Age-specific prevalence of Aβ-positive AD (left) and economic burden (right). Data is estimated by age, sex, and stage, and whiskers represent uncertainty ranges[9]. The distribution of payment costs for AD and dementia for Americans aged 65 or above in 2022 (right)[8].
In addition to medication, physical therapy can mitigate both cognitive and motor impairments in individuals experiencing cognitive impairment and AD[12]. Specifically, it brings improvement in gait, balance, and cognition. Music stimulates the brain to provoke a response, and it is a non-invasive, accessible technique that could be frequently utilized. Studies that investigate the effect of musical stimuli on stroke recovery suggest that music could often activate the auditory and motor systems, which indicates its effectiveness in assisting with stroke rehabilitation[13]. Studies also suggest that memory traces built through music are more deeply established against neurodegenerative memory impairments such as AD[14]. Since music-associated memories are better preserved in AD[15], music therapy can be useful in helping individuals retrieve autobiographical memories and emotions associated with music[16]. It is also found that the caudal anterior cingulate cortex and the ventral pre-supplementary motor area (pre-SMA) are involved in musical memory and music-evoked emotions, and they are one of the last brain regions to experience impairment in AD. Since these regions remain for a longer time, it might explain why AD patients usually have well-preserved musical memory. Other studies used personalized musical training to investigate the effectiveness of favored music on brain functional connectivity[17]. With the use of functional magnetic resonance imaging, it was found that preferred musical stimuli activated the SMA, along with increasing functional connectivity.
Figure 3. Rate of memory decline under different conditions over time. (1) Slow memory decline in normal aging. (2) Rapid, earlier memory decline in AD. (3) Most current therapies that do not change the course of memory decline, only capable of enhancing cognition. (4) Reduced rate of memory decline as an anticipated effect of therapies[7]. Prepared by biorender.
Aside from musical stimuli, certain auditory frequencies were found to have an impact on the pathological markers of AD. Studies by Dr. Li-Huei Tsai and her research group found that 40 Hz stimulation could decrease the harmful Aß amyloid plaques and tau tangles in mice, which are hallmarks of AD[18]. 40 Hz stimulation also alters the state of microglia, which are brain cells involved in synapse loss while exacerbating tau pathology and harming neurons by releasing inflammatory factors[18,19].
Although music therapy does not directly target a pathological marker, it has certain advantages. In addition to its non-invasive characteristic, the low cost and high accessibility of music therapy have made it become increasingly accepted by individuals seeking to improve neurological conditions. It is also well-known that different types of music can trigger distinctive emotions and affect our emotional well-being. Therefore, music therapy could potentially be a highly powerful way to improve the moods of patients, especially individuals with MCI and AD whose impaired emotional processing has been linked to agitation, unsettledness, aggression, and other neuropsychiatric symptoms[20].
1.3.Rationale of this Study
While symptomatic treatments exist, we have yet to discover a treatment for MCI or AD that would slow the course of memory decline over the long term (Figure 3, line 4). Given this gap and the numerous advantages of music therapy for alleviating memory and cognitive impairment, I reason that music may offer us a unique, accessible, and non-invasive supplement to treating these disorders. Furthermore, music is complex and many factors affect its effectiveness. I seek to investigate whether the effectiveness of musical treatment is attributed to music preference or music genre. The objective of this study is to investigate the short and long-term impacts of musical treatment on verbal episodic and working memory and the effects of different music genres and preference levels.
2.Methods and Materials
2.1.Experiment Objectives
1.To investigate the impact of musical stimuli on verbal episodic and working memory, indicated by the ten-word test (TWT) and digit span (DS) test, and observe the effect of different music genres.
2.To utilize machine learning methodologies to explore a potential way of enhancing the efficiency of future treatment through predicting long-term outcomes from initial short-term results.
3.To examine the effect of musical stimuli on brain cortical electrical activity across distinct regions through the analysis of EEG data.
2.2.Experiment Procedure
This experiment was conducted in short-term one-week (Figure 4) and long-term three-week cycles (Figure 5). The music genre for each participant changes after the end of each cycle. Subjects listen to music at the same time of day in the same surrounding environment throughout the experiment. TWT and DS tests are conducted following music stimuli, and raw EEG data is collected before and after subjects listen to music, which is used to observe the impact of music on regional brain cortical activities (Figure 6).
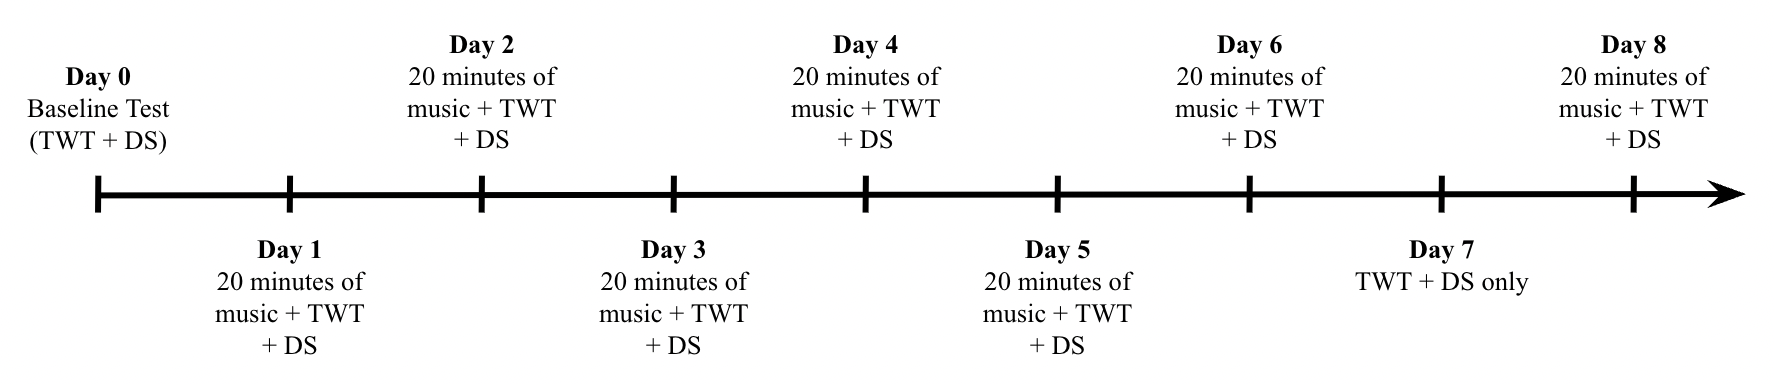
Figure 4. One-week cycle timeline. Day 0 is the baseline test, and participants listen to 20 minutes of music every day, followed by a TWT and DS test. The exception is day 7, during which participants do not listen to music, serving as a control day within the experimental trial.
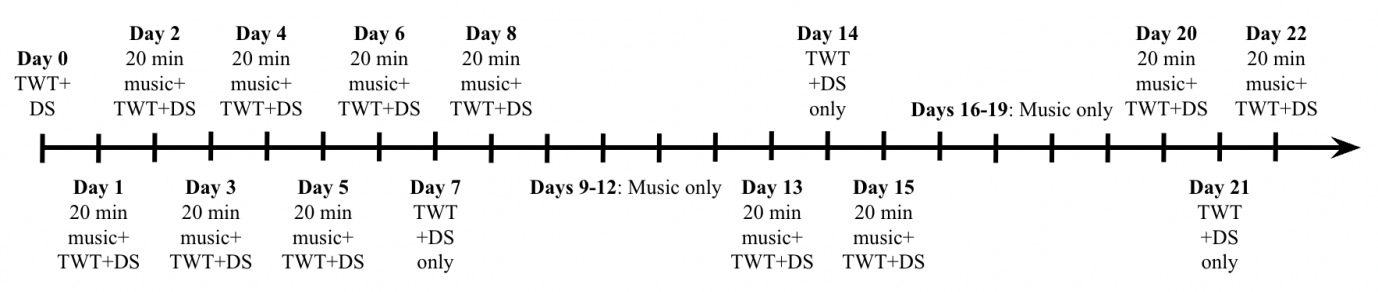
Figure 5. Three-week cycle timeline. Day 0 is the baseline test, and participants listen to 20 minutes of music every day, followed by a TWT and DS test for three weeks. The days during which participants receive no music treatment are days 7, 14, and 21.
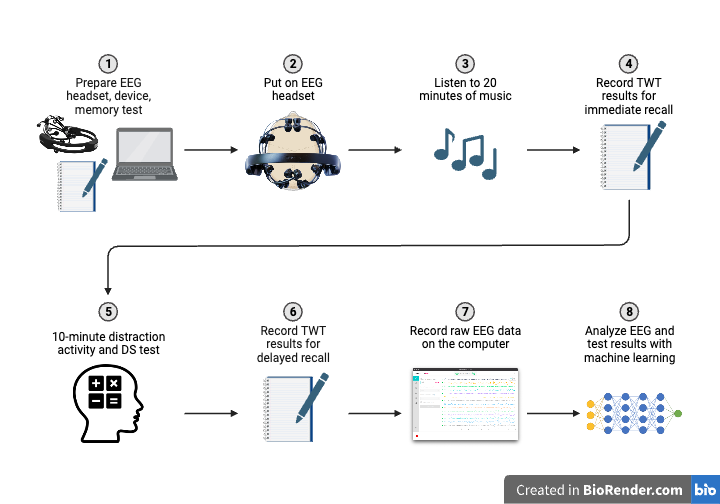
Figure 6. Experiment procedure. Participants listen to music with the EEG headset, followed by the TWT and DS tests. Test results and raw EEG data are then collected and analyzed alongside machine learning methods. Figure prepared by biorender.
2.2.1.Ten-Word Test. The TWT presents a higher level of difficulty relative to the five-word test (FWT), a rapid evaluation of verbal episodic memory[21,22]. The original FWT was an effective tool for the quick screening of AD, assessing the ability of subjects to recall a short list of words belonging to different semantic categories. These semantic categories – building, insect, drink, vehicle, and kitchen utensil – are strategically used to enhance the ability of the subject to apprehend and retrieve the given words.
Differing from the original FWT, the TWT encompasses several distinct features, including a weighting difference between spontaneous and cued recall[22], an attention interference duration of 10 minutes, and an expanded word list containing 10 items. A step-by-step procedure of the TWT is provided below:
•Show a list of 10 words, every 2 words belonging to a different semantic category, to the subject and confirm that they have understood all the words clearly.
•Ask the subject to repeat the 10 words immediately. For the words not recalled spontaneously, ask “What was the name of the…?”, providing the corresponding semantic category as a clue.
•Take note of the spontaneous recalls (2 points) and cued recalls (1 point).
•Show the unremembered words and ask the subject to provide them in response to the corresponding semantic category.
•Divert the attention of the subject for 10 minutes by asking about numerical calculations, and make sure that their attention is no longer focused on the words.
•Ask the subject to repeat the 10 words again, taking note of the delayed recall score. For the words not recalled spontaneously, ask “What was the name of the…?”, providing the corresponding semantic category as a clue.
•Take note of the spontaneous recalls (2 points) and cued recalls (1 point).
•Calculate the sum of the immediate recall and delayed recall scores as a total score out of 40.
2.2.2.Digit Span Test. In this study, the DS test is performed by verbally providing a series of numbers and asking the subject to repeat them both in the presented and inverse order[23,24]. This assesses the verbal working memory of participants[24] and the ability to recall numeric information. At the end of each test, the total number of recalled numbers is calculated. A step-by-step procedure for the DS test is provided below:
•Verbally present a list of 6 double-digits at a rate of 1 double-digit per second. Digits are chosen randomly and do not appear in regular ascending or descending order.
•Immediately ask the subject to recall the series in the presented order, then the inverse order.
•Record the score as the number of correct double-digits recalled in both orders out of 12.
2.2.3.Machine Learning. The random forest supervised machine learning algorithm comprises a collection of random decision trees that are less sensitive to changes in training data. Through the process of bootstrapping and aggregation, the trees are trained with different, randomly selected datasets and features to create diverse trees and decision nodes (Figure 7). Predictions in my experiment stem from the mean value from the results of multiple decision trees.
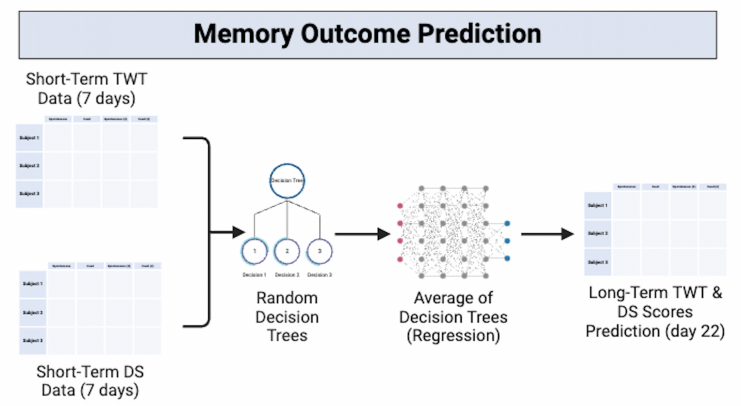
Figure 7. Memory outcome prediction model representation. I input initial 7-day datasets to obtain predicted day-22 TWT and DS scores. Figure prepared by biorender.
I employed the random forest machine learning algorithm with the goal of creating a model to potentially enhance the efficiency of future music treatment. Instead of undergoing a 3-week investigation to determine the long-term impacts of a certain genre of music on TWT and DS scores, I built a model capable of predicting long-term outcomes from the initial 7-day dataset (Figure 7). This approach enables the possibility of evaluating the effectiveness of a particular treatment genre in advance and reducing the time demands of trial-and-error processes.
2.2.4.EEG Data Collection. Subjects wear an EEG headset (Figure 8), and data on cortical electrical activity is collected before and after musical treatment. The data collected could potentially provide insights into the impact of music on brain activities. I first soak 16 sensor felts in saline solution, then squeeze out excess fluid and secure one sensor felt in each sensor. The EEG device is then connected to the computer using a USB cable, and I ensure the contact and EEG quality are optimal and the participant feels comfortable with the headset position before raw EEG data is collected.
To test the precision of the EEG, I conducted an additional experiment to distinguish between signals from muscle movement and cortical electrical signals. Wearing the EEG headset, participants first remained still, then moved their eyebrows, and finally thought about moving their eyebrows without moving them. Next, participants moved their arms and then thought about moving their arms without actual movement. By observing the EEG data while performing these actions, we could test the extent to which the EEG captures muscle movement and motor neurone electrical potential. Since raw EEG data are subject to influences from both cortical electrical signals and muscle movement, this additional EEG precision experiment can increase the accuracy of results by assisting with muscle movement artifact identification.
|
|
|
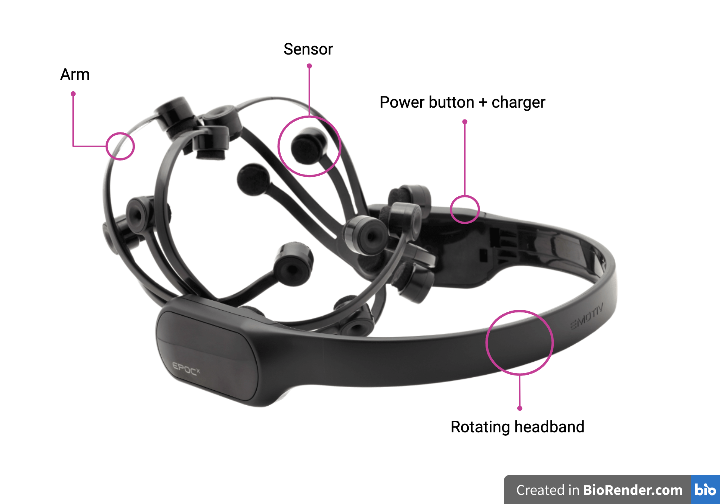
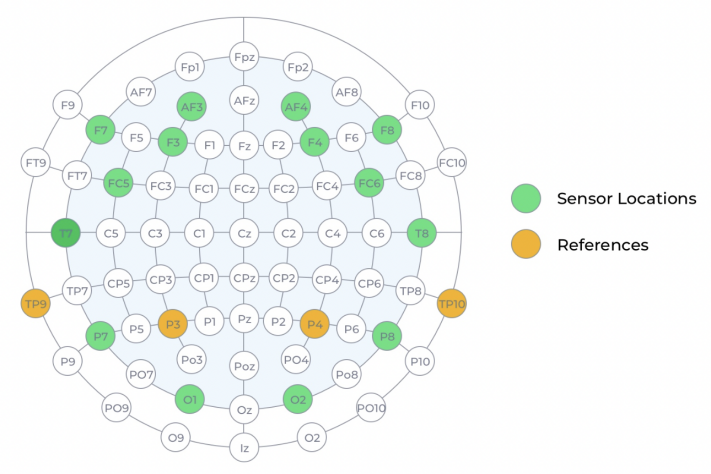
Figure 8. EEG headset (left) and sensor & reference locations (right). The different parts of the EEG headset are labeled. The 14 sensors and 2 references are in contact with the scalp, each collecting data from a different area of the scalp. The headband is rotatable to ensure a comfortable fit for each participant (left). Figure prepared by biorender. The locations of the 14 sensors are labeled in green, and the reference location options, which ensure the headset is in the correct position, are labeled in orange (right)[25].
2.3.Music Genre Classification
After initial research on scientific music classification, I made sure that all favored music pieces of participants fall under the following genres: classical, country, folk, jazz, blues, pop, disco, rock, and metal[26]. To ensure that subjects are familiar with the music genres, I provided them with excerpts from different music genres and asked them to associate one with each genre, and made modifications based on familiarity feedback. The negative control involves no musical or auditory stimuli and 40 Hz music is a potential positive control.
3.Results
3.1.Participant Preference Distribution of Music Genres
I recruited subjects from my local community and hometown, ranging from the age of 30 to 70. The first cycle involved 17 participants, and the second cycle involved 22 participants. After listening to excerpts from each music genre, most subjects had trouble distinguishing between jazz and blues, pop and disco, and rock and metal, while it is easier to distinguish between classical, country, and folk music. Therefore, I decided to include blues in jazz, disco in pop, and metal in rock. 40 Hz music is listed as a potential positive control. The music preference levels of participants are also recorded (Figure 9). Most subjects reported experiencing more positive emotions after listening to their preferred music and no clear emotional change after listening to unpreferred music. Some subjects reported experiencing fewer positive emotions after listening to unpreferred music, and others reported feeling no emotional change regardless of the music genre.
|
|
|

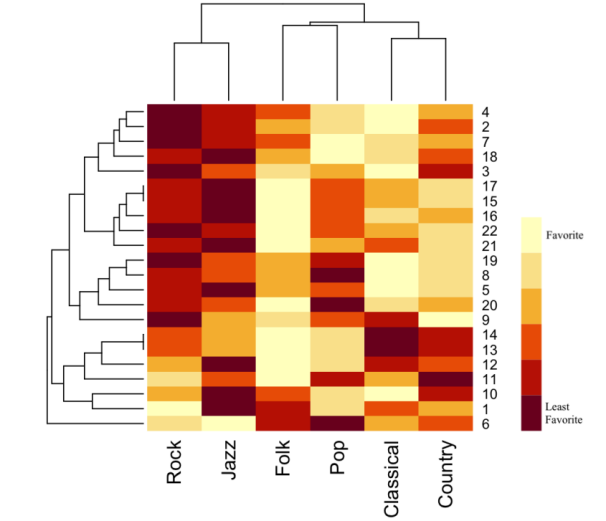
Figure 9. Classification of music (left) and heatmap showing distribution of music genre preference of subjects (right). 40 Hz music is the potential positive control. The lighter the color, the higher the preference for a certain genre of music.
3.2.TWT and DS Short-Term and Long-Term Results
TWT and DS results are presented separately and analyzed based on genre (section 3.2.1) and preference (section 3.2.2). Results are analyzed using score vs. time graphs showing individual changes, average score changes vs. time graphs showing changes relative to the baseline, and box plots comparing percentage changes across genres and preferences. The score vs. time graphs show results from the first cycle of 17 participants, while the average score changes vs. time graphs and box plots show results from both the first and second cycles, including 22 subjects in total. To facilitate the efficiency of future musical treatment evaluation, I employed the random forest machine learning algorithm (section 3.2.3) to create a model that predicts long-term (day 22) TWT and DS results based on short-term treatment data (first 7 days).
3.2.1.Short and Long-Term Changes of TWT and DS Scores Based on Genre. To visualize the changing TWT score trend of subjects who listened to different genres of music in both cycles, I analyzed the TWT scores over time relative to the baseline score (Figure 10). This is accomplished by subtracting the baseline score from the scores obtained on all other days of the cycle. Points above the x-axis indicates positive improvement from the baseline. Results suggest that subjects who listened to classical and folk music exhibited the most consistent averaged TWT scores at or over the baseline.
|
|
|
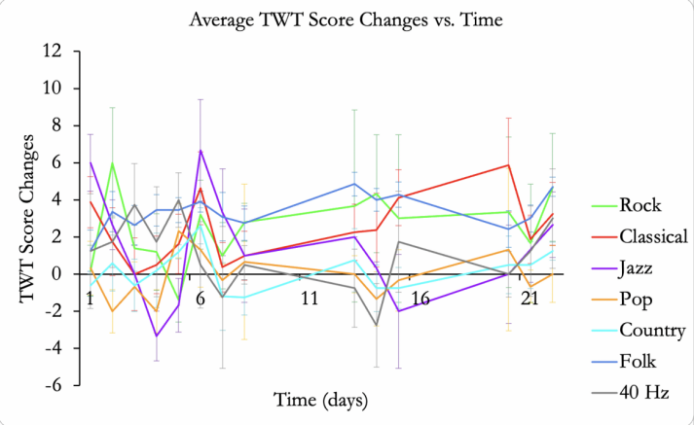
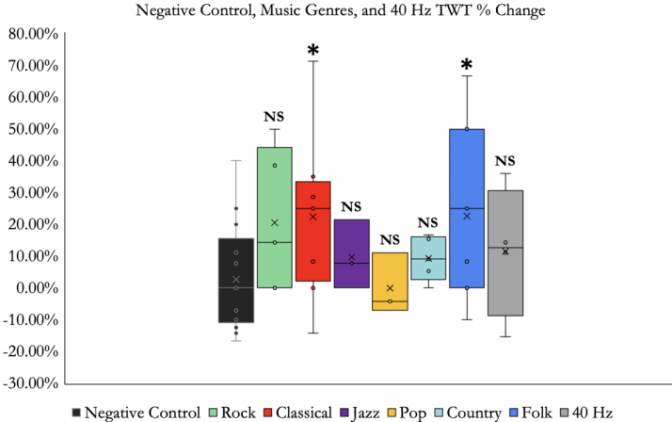
Figure 10. Average TWT score changes over time based on genre (left) and negative control, music genres, and 40 Hz percentage change of day 22 TWT score compared to baseline score (right). Left figure: error bars are calculated as standard error. The average TWT score changes are calculated by subtracting the baseline score from the scores obtained on all other days of the cycle. Points above the x-axis indicate scores above the baseline, and points below the x-axis indicate scores below the baseline. Right figure: *P < 0.05 by one-way analysis of variance (ANOVA). “NS” indicates “not significant.” The black crosses indicate the median percentage change.
I further quantified the percentage score increase (and decrease) for the negative control trial, all six genres of music, and 40 Hz music (Figure 10). This is accomplished by comparing the day-0 baseline score with the score obtained on the final day of the cycle. Classical music resulted in the highest average percentage improvement for the TWT, closely followed by folk music, and some participants who listened to classical music demonstrated the highest individual percentage improvements. There is no significant difference between score percentage changes for rock, jazz, pop, country, and 40 Hz music when compared with the negative control, according to their p-values. Despite the high variability in individual score changes, results suggest that classical and folk music are effective for improving TWT scores. To provide a more comprehensive view of the influence of music on memory abilities, I included a result analysis of the numerical DS test that assesses verbal working memory in conjunction with the TWT that assesses verbal episodic memory.
To visualize the changing DS score trend of subjects who listened to different genres of music in both cycles, I analyzed the changes in DS scores over time relative to the baseline score (Figure 11). The results show that subjects who listened to classical and folk music obtained DS scores consistently above the baseline score (indicated by the x-axis), suggesting the effectiveness of classical and folk music in improving verbal working memory.
|
|
|
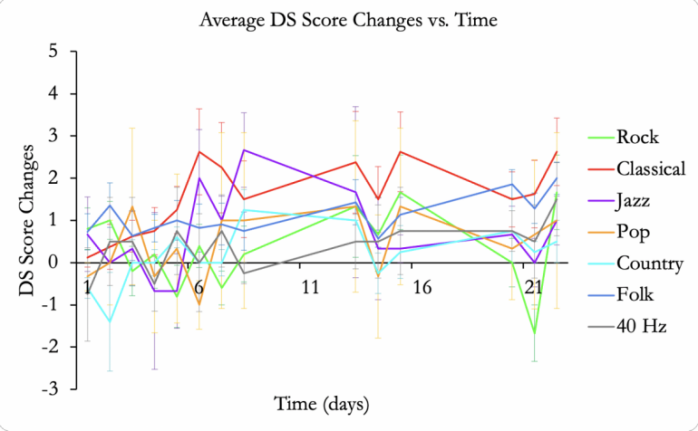
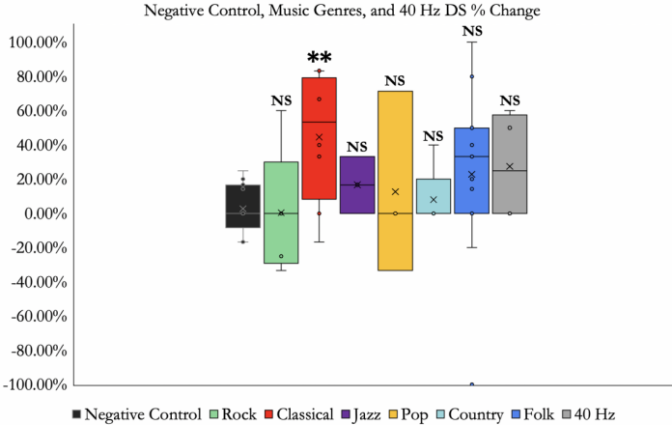
Figure 11. Average DS score changes over time based on genre (left) and negative control, music genres, and 40 Hz percentage change of day 22 DS score compared to baseline score (right). Left figure: error bars are calculated as standard error. The average DS score changes are calculated by subtracting the baseline score from the scores obtained on all other days of the cycle. Points above the x-axis indicate scores above the baseline, and points below the x-axis indicate scores below the baseline. Right figure: **P < 0.01 by one-way analysis of variance (ANOVA). “NS” indicates “not significant.” The black crosses indicate the median percentage change.
I further quantified the DS percentage increase (and decrease) for the negative control trial, all six genres of music, and 40 Hz music. Results show that classical music resulted in the highest average percentage improvement for the DS, while some subjects who listened to folk music demonstrated the highest individual percentage improvement (Figure 11). However, score changes resulting from rock, jazz, pop, country, folk, and 40 Hz music are not statistically significant, according to their p-values. Therefore, results only suggest the effectiveness of classical music in improving long-term DS scores. To summarize, results show that classical music is effective for enhancing both TWT and DS scores in the long term, and folk music is effective for enhancing TWT scores in the long term.
3.2.2.Short and Long-Term Changes of TWT and DS Scores Based on Preference. I first analyzed the TWT scores over time relative to the baseline score for different preference levels (Figure 12). Points above the x-axis indicates an improvement compared to the baseline. Preference level one indicates most favourite music and preference level six indicates least favourite music. Results suggest that treatment by the most favourite genre resulted in the highest and most consistent averaged TWT scores at or over the baseline.
I further quantified the TWT percentage score increase (and decrease) for the negative control trial, all six preference levels, and 40 Hz music (Figure 12). Preference level one treatment resulted in the highest and statistically significant improvements in TWT scores. There is no significant difference between the score percentage changes for preference levels two to six and 40 Hz when compared with the negative control, according to their p-values. Results suggest that the most preferred music by participants has the highest effectiveness for improving verbal episodic memory. A result analysis of the DS test that assess verbal working memory is also included to provide a more comprehensive view of the impact of music preference on memory retrieval.
|
|
|
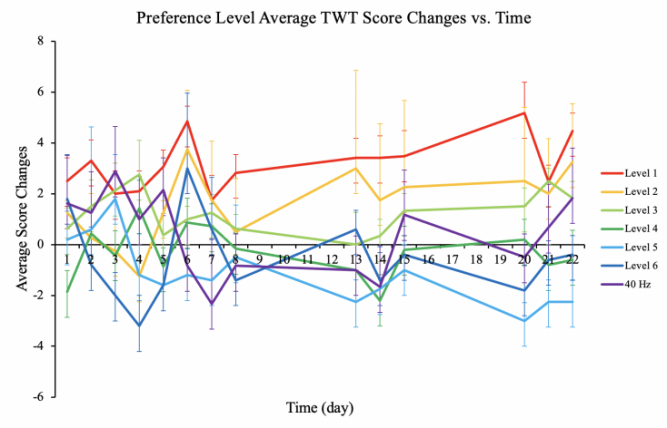
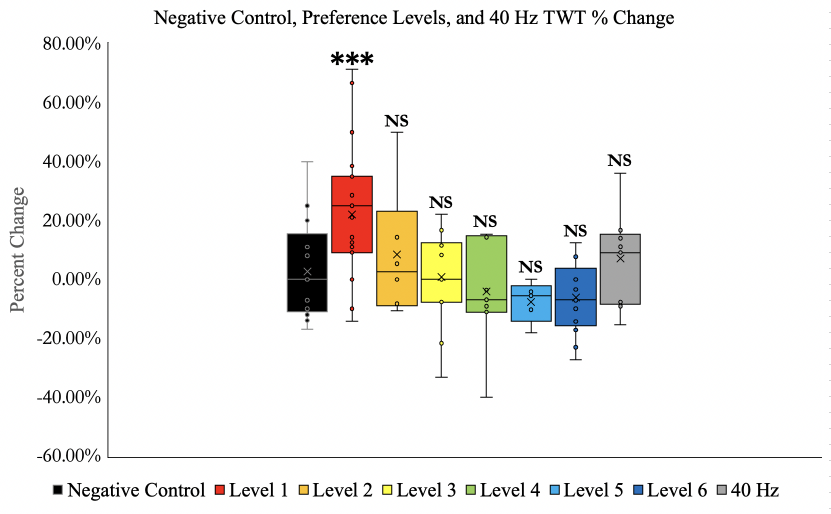
Figure 12. Average TWT score changes over time based on preference (left) and negative control, music preference levels, and 40 Hz percentage change of day 22 TWT score compared to baseline score (right). Left figure: error bars are calculated as standard error. The average TWT score changes are calculated by subtracting the baseline score from the scores obtained on all other days of the cycle. Points above the x-axis indicate scores above the baseline, and points below the x-axis indicate scores below the baseline. Preference level 1 indicates most favourite music and preference level 6 indicates least favourite music. Right figure: ***P < 0.001 by one-way analysis of variance (ANOVA). “NS” indicates “not significant.” The black crosses indicate the median percentage change.
DS scores over time are also compared with the baseline score for different preference levels (Figure 13). Preference level one indicates most favourite music and preference level six indicates least favourite music. Results similarly suggest that treatment by the most favourite genre resulted in the highest and most consistent averaged DS scores at or over the baseline (indicated by the x-axis).
I further quantified the DS percentage score increase (and decrease) for the negative control trial, all six preference levels, and 40 Hz music (Figure 13). Preference level one treatment resulted in the highest and statistically significant improvements in DS scores. Score changes for preference levels two-six and 40 Hz music are not statistically significant, according to their p-values. Results from the TWT and DS suggest that the most preferred music by participants has the highest effectiveness for both verbal episodic memory and verbal working memory improvement, suggesting that music preference is an important factor that influences the effectiveness of musical treatment.
|
|
|
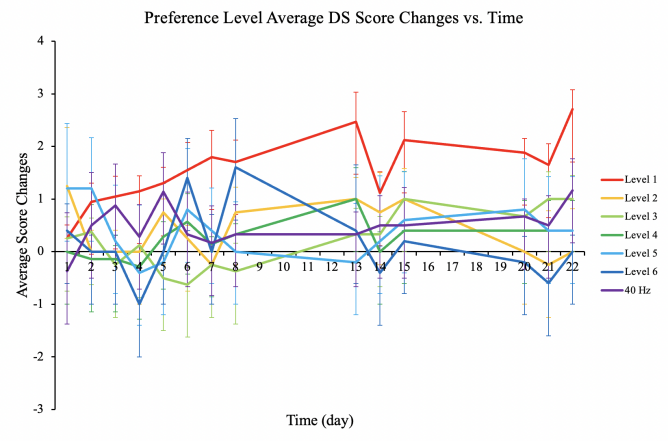
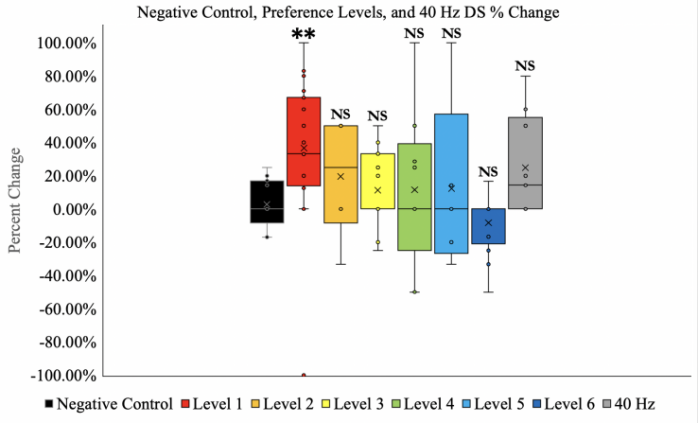
Figure 13. Average DS score changes over time based on preference (left) and negative control, music preference levels, and 40 Hz percentage change of day 22 DS score compared to baseline score (right). Left figure: error bars are calculated as standard error. The average DS score changes are calculated by subtracting the baseline score from the scores obtained on all other days of the cycle. Points above the x-axis indicate scores above the baseline, and points below the x-axis indicate scores below the baseline. Preference level 1 indicates most favourite music and preference level 6 indicates least favourite music. Right figure: **P < 0.01 by one-way analysis of variance (ANOVA). “NS” indicates “not significant.” The black crosses indicate the median percentage change.
3.2.3.Machine Learning Predictions of TWT and DS Outcomes. Normally, it would take 3 weeks to assess the impact of a certain musical treatment in the long term. However, I believe that there is potential to shorten the time-consuming process by creating a random forest machine learning model capable of predicting future long-term outcomes based on short-term outcomes. With this approach, it would become possible to discover the long-term influence of a certain musical treatment on the verbal episodic and working memory of individuals in advance and evaluate the effectiveness of the treatment with higher efficiency. Therefore, I created a machine learning model with the objective of using initial short-term data from the first 7 days to predict long-term TWT and DS outcomes on day 22. To better view the accuracy of the model, I summarized the baseline score, predicted long-term score, real long-term score, percentage change, and the difference between predicted and real scores for the TWT in the first cycle.
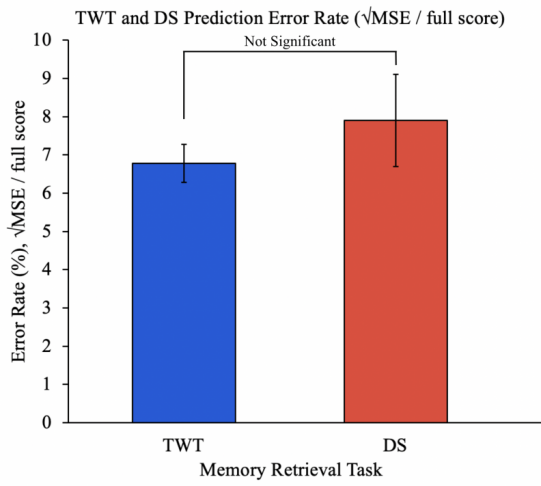
Figure 14. TWT and DS prediction percentage error rate based on mean square error (MSE). There is no significant difference between the percentage error rate for the TWT and DS. Error bars are calculated as standard error. The difference between prediction error rates for the TWT and DS is not significant.
The MSE was calculated for TWT and DS outcome predictions, and the square root of the MSE value is the average difference between predicted and real outcomes. The differences are converted into percentage error rates, which shows less than 10 percent for both the TWT and DS (Figure 14). Since there is overlap between the error bars, there is no significant difference between prediction error rates for the TWT and DS.
3.3.EEG Data Collected Before and After Music Therapy
EEG data were collected for subjects to find the potential relationship between TWT and DS score changes with corresponding brain wave changes as well as what the brain waves might imply. I observed that participants who listened to classical music exhibited the largest difference between EEG data before and after musical treatment (Figure 15). Specifically, there is a reduction in EEG amplitude after listening to classical music. Similarly, the same cohort of subjects who listened to classical music saw large average increases in their TWT and DS scores, which may suggest a potential correlation between the decrease in EEG amplitude and the amplification of TWT and DS scores. On the other hand, I observed that participants who listened to country music exhibited minimal differences between EEG data before and after musical treatment, and similarly, country music did not result in a statistically significant improvement in either the TWT or the DS. It is worth noting that there is high individual variability and the results only compare data collected for the same individual at different times.
A general trend observed in EEG data before and after musical treatment was that channels around the frontal cortex (AF3, AF4, F7, F8, F3, F4, FC5, FC6) often exhibited notable amplitude differences. This suggests that the frontal cortex region may have experienced the largest effect from music. However, we cannot solely use classical music data to conclude that the effectiveness of music is related to a decrease in amplitude; rather, it is possible that both an increase or decrease in amplitude could suggest influences on memory. Therefore, more data from different individuals in each genre is needed to view a clearer potential correlation between TWT and DS score changes and brain wave changes. Since classical music resulted in the largest EEG amplitude difference before and after treatment, I calculated the cumulative sum of amplitudes to further visualize the difference (Figure 15).
|
|
|
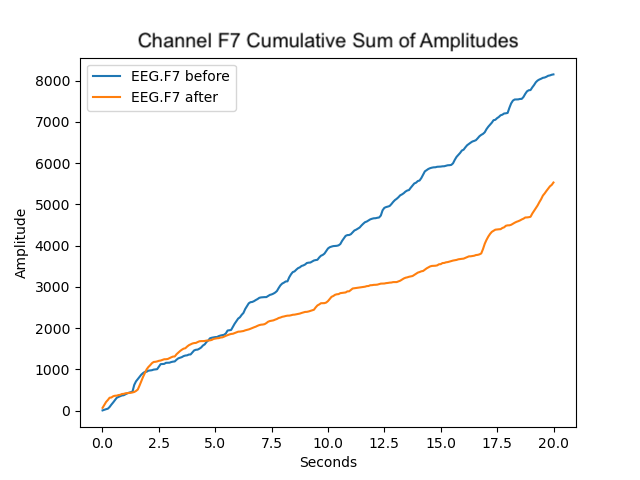
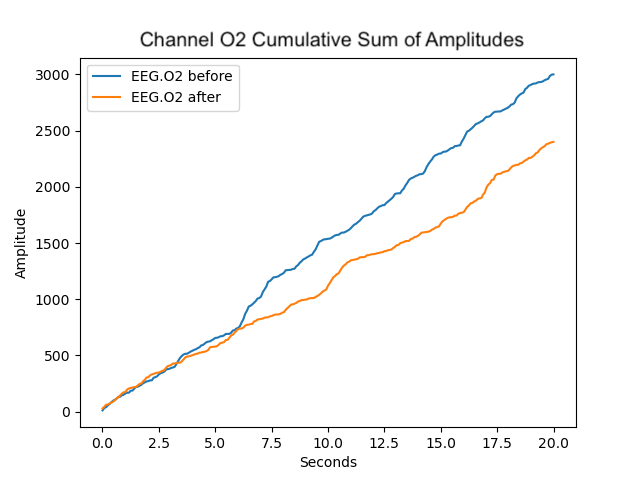
Figure 15. EEG amplitude data (left) and cumulative sum of amplitudes over time by sensor (right), before and after classical music treatment. After 20 minutes of classical music treatment, the amplitude of all sensors decreased. Channel F7 (frontal cortex) exhibited the largest decrease and channel O2 (occipital cortex) exhibited the smallest decrease in amplitude.
All channels experienced a decrease in amplitude, although different channels displayed varying degrees of amplitude reduction (Figure 15). Notably, channel F7 exhibited the most substantial reduction in amplitude subsequent to classical musical treatment in comparison to its state before treatment, whereas channel O2 showed the most modest amplitude decrease. The results suggest that 20 minutes of classical music treatment may be associated with a decrease in the intensity of the cortical electrical signals of the brain. However, we have not yet arrived at a definite conclusion. We acknowledge the limitations of this experiment, and it is possible that there may not be a direct association between EEG alterations and memory test performance.
|
|
|
|
|
|
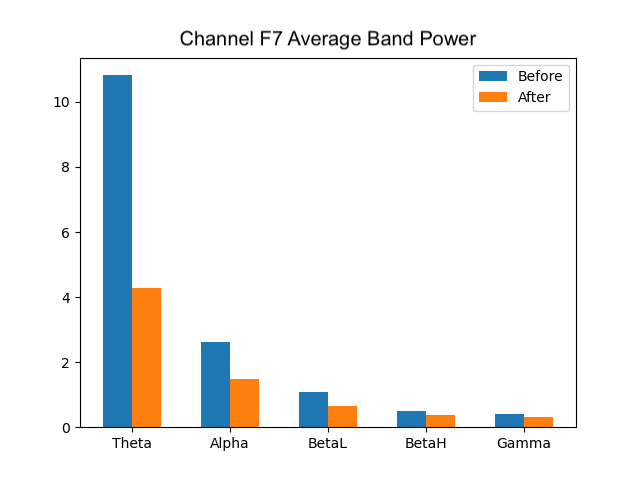
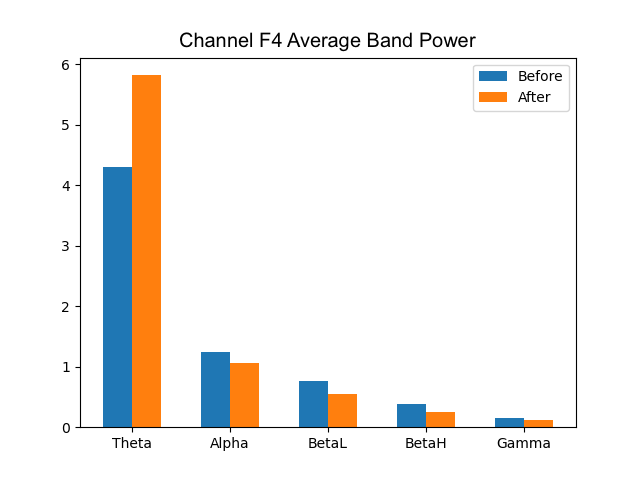
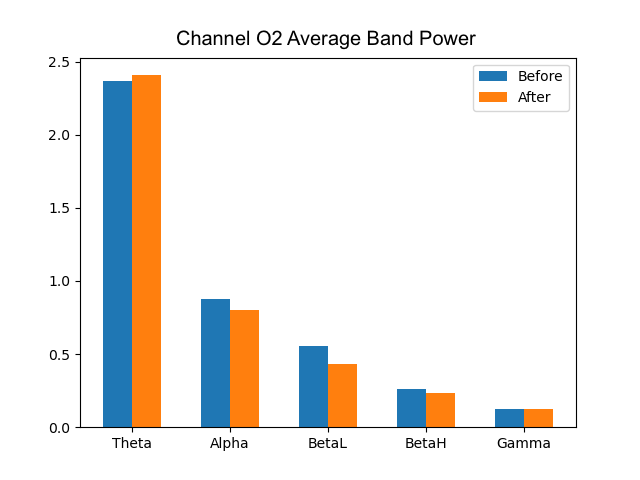
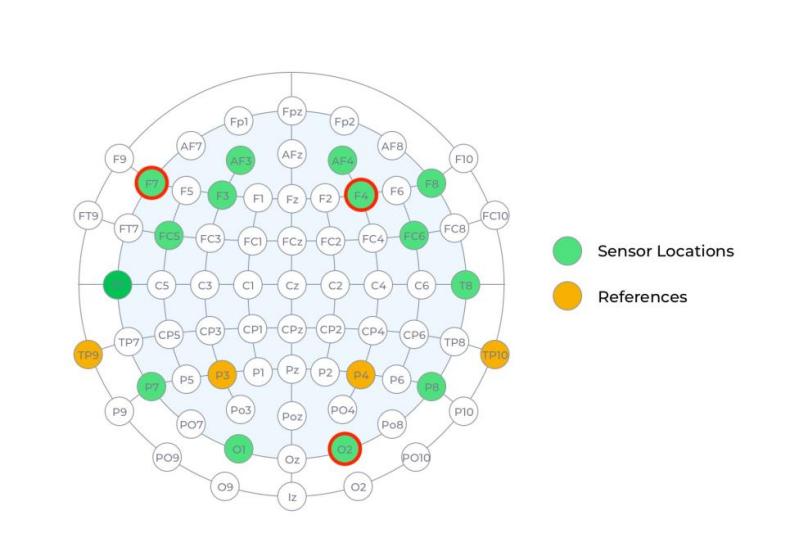
Figure 16. Average frequency band power of channels F7, F4, and O2 (θ, α, low β, high β, γ). After treatment, channel F7 showed lower theta (θ) waves, channel F4 showed higher θ waves, and channel O2 displayed the least change. All three channels showed lower alpha (α), beta (β), and gamma (γ) band powers after treatment.
I further analyzed the changes in wave frequency band powers prior to and following music therapy, which may be informative of the mental state of the subject. Theta (θ) waves have been associated with the state of being deeply relaxed and inwardly focused; alpha (α) waves indicate relaxation; low beta (β) waves signify increases in focus and attention; high beta waves are often associated with stress and anxiety; and gamma (γ) waves indicate intensive thought and concentration[27]. I calculated the average band power for θ, α, low and high β, and γ waves prior to and following classical music treatment (Figure 16). A decrease in θ band powers across 6/14 channels suggests an increase in inward focus; conversely, an increase in θ band powers across 8/14 channels suggests an increase in states of relaxation[6]. A decline in α, β, and γ waves in nearly all channels may indicate higher engagement, wakefulness, and less intensive cognitive activity[6]. A comprehensive investigation is required to establish conclusive connections between EEG band power fluctuations and memory performance.
4.Discussion
4.1.Effects of Music Genre & Preference
Results suggest that most preferred music can most effectively improve one’s memory. In terms of genre, classical and folk music seemed to be the most beneficial. In addition, EEG channels in the frontal cortex showed the most impacts in amplitude and frequency and the occipital cortex experienced the least impacts, suggesting that music may play a larger role in frontal cortex behaviours. The differences may be connected to the varying roles of the brain regions, as the frontal cortex is largely involved in cognitive functions. Therefore, music therapy of different genres and preferences could lead to differential regional stimulation and cognitive effort.
4.2.Methodological Variables and Limitations
In this study, data from the negative control group was collected without musical or auditory stimulation to control methodological variables and imitate the most realistic daily surrounding environment of participants. One alternative was to include auditory stimulation such as white noise, a sound that contains all audible frequencies. However, studies suggest that white noise can enhance learning and performance in auditory working memory tasks due to stochastic resonance[28]. Next, subjects also listened to instrumental music (without lyrics) to exclude the possible distractions or harms to TWT and DS performance[29]. Although participants do not listen to music while completing the TWT and DS, it is important to make sure that we avoid possible continued interference with cognitive tasks. Additionally, some participants may have used certain memory methods to assist them in the TWT, such as associating every word with an image, presenting the likelihood of overestimating their true memory ability. To improve result reliability, I informed all participants to complete the TWT and DS without using memory methods, but they could have developed subconscious ways of remembering after a few days of testing or acquired familiarity with the semantic category cues over time.
4.3.EEG Precision

'Figure 17. Raw EEG data without facial movement (left), wanting to move (middle), and with facial movement (right).
I conducted an additional EEG precision experiment (section 2.2.4) because I observed that the EEG detects muscle movement, especially from the eyebrows. To rule out the possibility that the EEG detected only facial or body movement, I collected data under three different circumstances: not moving, thinking about moving the eyebrows and arms, and moving the eyebrows and arms. Results showed that the headset is capable of capturing cortical electrical activity without actual muscle movement, but the amplitude change is small (Figure 17).
5.Conclusion
When music genre and preference are compared, I found that music preference is a relatively more important factor that influences the effectiveness of music treatment for verbal episodic and working memory. Based on preference, preference level one (most favourite music) treatment resulted in the highest TWT and DS score improvements. Based on genre, classical music stimuli yielded enhancements in long-term TWT and DS scores, while folk music effectively improved long-term TWT scores. For participants aged 65 and above, folk music treatment resulted in TWT score improvements ranging from 25% to 66.7% and DS score improvements ranging from 20% to 50%. Based on EEG observations of amplitude and frequency band changes, music potentially has a modulatory effect on the EEG. In addition, it is important to maintain consistent music therapy. I created a random forest machine learning model that exhibited effectiveness in predicting long-term TWT and DS outcomes based on short-term data, potentially enhancing the efficiency of future treatment evaluation. The discoveries about the effectiveness of different music genres on verbal episodic and working memory could provide valuable insights for future music treatment and prevention of MCI and AD.
Acknowledgments
I would like to thank my parents, participants, and friends for their help and support throughout the project. I am also very thankful for my piano teacher, who cultivated my passion for music and introduced me to the connection between music and neuroscience.
References
[1]. Blinkouskaya Y, Caçoilo A, Gollamudi T, Jalalian S, Weickenmeier J. Brain aging mechanisms with mechanical manifestations. Mechanisms of ageing and development. 2021;200:111575.
[2]. Small GW. What we need to know about age related memory loss. Bmj. 2002;324(7352):1502-5.
[3]. Lane CA, Hardy J, Schott JM. Alzheimer's disease. European journal of neurology. 2018;25(1):59-70.
[4]. Jorm AF, Jolley D. The incidence of dementia: a meta-analysis. Neurology. 1998;51(3):728-33.
[5]. Nayak CS, Anilkumar AC. EEG Normal Waveforms. StatPearls. Treasure Island, FL: StatPearls Publishing; 2020.
[6]. Long JM, Holtzman DM. Alzheimer disease: an update on pathobiology and treatment strategies. Cell. 2019;179(2):312-39.
[7]. Weller J, Budson A. Current understanding of Alzheimer’s disease diagnosis and treatment. F1000Research. 2018;7.
[8]. Skaria AP. The economic and societal burden of Alzheimer disease: managed care considerations. The American Journal of Managed Care. 2022;28(10 Suppl):S188-S96.
[9]. Gustavsson A, Norton N, Fast T, Frölich L, Georges J, Holzapfel D, et al. Global estimates on the number of persons across the Alzheimer's disease continuum. Alzheimer's & Dementia. 2023;19(2):658-70.
[10]. Shi M, Chu F, Zhu F, Zhu J. Impact of anti-amyloid-β monoclonal antibodies on the pathology and clinical profile of Alzheimer’s disease: a focus on aducanumab and lecanemab. Frontiers in aging neuroscience. 2022;14:870517.
[11]. Van Dyck CH, Swanson CJ, Aisen P, Bateman RJ, Chen C, Gee M, et al. Lecanemab in early Alzheimer’s disease. New England Journal of Medicine. 2023;388(1):9-21.
[12]. Longhurst J, Phan J, Chen E, Jackson S, Landers MR. Physical therapy for gait, balance, and cognition in individuals with cognitive impairment: a retrospective analysis. Rehabilitation research and practice. 2020;2020.
[13]. Zatorre RJ, Chen JL, Penhune VB. When the brain plays music: auditory–motor interactions in music perception and production. Nature reviews neuroscience. 2007;8(7):547-58.
[14]. Trimble M, Hesdorffer D. Music and the brain: the neuroscience of music and musical appreciation. BJPsych international. 2017;14(2):28-31.
[15]. Vanstone AD, Cuddy LL. Musical memory in Alzheimer disease. Aging, Neuropsychology, and Cognition. 2009;17(1):108-28.
[16]. Matziorinis AM, Koelsch S. The promise of music therapy for Alzheimer's disease: A review. Annals of the New York Academy of Sciences. 2022;1516(1):11-7.
[17]. King J, Jones K, Goldberg E, Rollins M, MacNamee K, Moffit C, et al. Increased functional connectivity after listening to favored music in adults with Alzheimer dementia. The journal of prevention of Alzheimer's disease. 2019;6:56-62.
[18]. Iaccarino HF, Singer AC, Martorell AJ, Rudenko A, Gao F, Gillingham TZ, et al. Gamma frequency entrainment attenuates amyloid load and modifies microglia. Nature. 2016;540(7632):230-5.
[19]. Martorell AJ, Paulson AL, Suk H-J, Abdurrob F, Drummond GT, Guan W, et al. Multi-sensory gamma stimulation ameliorates Alzheimer’s-associated pathology and improves cognition. Cell. 2019;177(2):256-71. e22.
[20]. Cárdenas J, Blanca MJ, Carvajal F, Rubio S, Pedraza C. Emotional processing in healthy ageing, mild cognitive impairment, and Alzheimer’s disease. International Journal of Environmental Research and Public Health. 2021;18(5):2770.
[21]. Dubois B, Touchon J, Portet F, Ousset P, Vellas B, Michel B. " The 5 words": a simple and sensitive test for the diagnosis of Alzheimer's disease. Presse Médicale (Paris, France: 1983). 2002;31(36):1696-9.
[22]. Mormont E, Jamart J, Robaye L. Validity of the five-word test for the evaluation of verbal episodic memory and dementia in a memory clinic setting. Journal of Geriatric Psychiatry and Neurology. 2012;25(2):78-84.
[23]. Langeluddecke PM, Lucas SK. Wechsler Adult Intelligence Scale–Third Edition findings in relation to severity of brain injury in litigants. The Clinical Neuropsychologist. 2003;17(2):273-84.
[24]. Jahanshahi M, Saleem T, Ho AK, Fuller R, Dirnberger G. A preliminary investigation of the running digit span as a test of working memory. Behavioural neurology. 2008;20:17-25.
[25]. EMOTIV. EPOC X User Manual2023 August 18, 2023.
[26]. Tzanetakis G, Cook P. Musical genre classification of audio signals. IEEE Transactions on speech and audio processing. 2002;10(5):293-302.
[27]. Abhang PA, Gawali BW, Mehrotra SC. Technological Basics of EEG Recording and Operation of Apparatus: Academic Press; 2016.
[28]. Othman E, Yusoff AN, Mohamad M, et al. Low intensity white noise improves performance in auditory working memory task: An fMRI study. Heliyon. 2019;5(9):e02444
[29]. Souza AS, Barbosa LCL. Should we turn off the music? Music with lyrics interferes with cognitive tasks. Journal of cognition. 2023;6(1).
Cite this article
Zhai,X.(. (2024). Intervention of age-related memory impairment by integrative musical stimuli. Theoretical and Natural Science,49,198-213.
Data availability
The datasets used and/or analyzed during the current study will be available from the authors upon reasonable request.
Disclaimer/Publisher's Note
The statements, opinions and data contained in all publications are solely those of the individual author(s) and contributor(s) and not of EWA Publishing and/or the editor(s). EWA Publishing and/or the editor(s) disclaim responsibility for any injury to people or property resulting from any ideas, methods, instructions or products referred to in the content.
About volume
Volume title: Proceedings of the 4th International Conference on Biological Engineering and Medical Science
© 2024 by the author(s). Licensee EWA Publishing, Oxford, UK. This article is an open access article distributed under the terms and
conditions of the Creative Commons Attribution (CC BY) license. Authors who
publish this series agree to the following terms:
1. Authors retain copyright and grant the series right of first publication with the work simultaneously licensed under a Creative Commons
Attribution License that allows others to share the work with an acknowledgment of the work's authorship and initial publication in this
series.
2. Authors are able to enter into separate, additional contractual arrangements for the non-exclusive distribution of the series's published
version of the work (e.g., post it to an institutional repository or publish it in a book), with an acknowledgment of its initial
publication in this series.
3. Authors are permitted and encouraged to post their work online (e.g., in institutional repositories or on their website) prior to and
during the submission process, as it can lead to productive exchanges, as well as earlier and greater citation of published work (See
Open access policy for details).
References
[1]. Blinkouskaya Y, Caçoilo A, Gollamudi T, Jalalian S, Weickenmeier J. Brain aging mechanisms with mechanical manifestations. Mechanisms of ageing and development. 2021;200:111575.
[2]. Small GW. What we need to know about age related memory loss. Bmj. 2002;324(7352):1502-5.
[3]. Lane CA, Hardy J, Schott JM. Alzheimer's disease. European journal of neurology. 2018;25(1):59-70.
[4]. Jorm AF, Jolley D. The incidence of dementia: a meta-analysis. Neurology. 1998;51(3):728-33.
[5]. Nayak CS, Anilkumar AC. EEG Normal Waveforms. StatPearls. Treasure Island, FL: StatPearls Publishing; 2020.
[6]. Long JM, Holtzman DM. Alzheimer disease: an update on pathobiology and treatment strategies. Cell. 2019;179(2):312-39.
[7]. Weller J, Budson A. Current understanding of Alzheimer’s disease diagnosis and treatment. F1000Research. 2018;7.
[8]. Skaria AP. The economic and societal burden of Alzheimer disease: managed care considerations. The American Journal of Managed Care. 2022;28(10 Suppl):S188-S96.
[9]. Gustavsson A, Norton N, Fast T, Frölich L, Georges J, Holzapfel D, et al. Global estimates on the number of persons across the Alzheimer's disease continuum. Alzheimer's & Dementia. 2023;19(2):658-70.
[10]. Shi M, Chu F, Zhu F, Zhu J. Impact of anti-amyloid-β monoclonal antibodies on the pathology and clinical profile of Alzheimer’s disease: a focus on aducanumab and lecanemab. Frontiers in aging neuroscience. 2022;14:870517.
[11]. Van Dyck CH, Swanson CJ, Aisen P, Bateman RJ, Chen C, Gee M, et al. Lecanemab in early Alzheimer’s disease. New England Journal of Medicine. 2023;388(1):9-21.
[12]. Longhurst J, Phan J, Chen E, Jackson S, Landers MR. Physical therapy for gait, balance, and cognition in individuals with cognitive impairment: a retrospective analysis. Rehabilitation research and practice. 2020;2020.
[13]. Zatorre RJ, Chen JL, Penhune VB. When the brain plays music: auditory–motor interactions in music perception and production. Nature reviews neuroscience. 2007;8(7):547-58.
[14]. Trimble M, Hesdorffer D. Music and the brain: the neuroscience of music and musical appreciation. BJPsych international. 2017;14(2):28-31.
[15]. Vanstone AD, Cuddy LL. Musical memory in Alzheimer disease. Aging, Neuropsychology, and Cognition. 2009;17(1):108-28.
[16]. Matziorinis AM, Koelsch S. The promise of music therapy for Alzheimer's disease: A review. Annals of the New York Academy of Sciences. 2022;1516(1):11-7.
[17]. King J, Jones K, Goldberg E, Rollins M, MacNamee K, Moffit C, et al. Increased functional connectivity after listening to favored music in adults with Alzheimer dementia. The journal of prevention of Alzheimer's disease. 2019;6:56-62.
[18]. Iaccarino HF, Singer AC, Martorell AJ, Rudenko A, Gao F, Gillingham TZ, et al. Gamma frequency entrainment attenuates amyloid load and modifies microglia. Nature. 2016;540(7632):230-5.
[19]. Martorell AJ, Paulson AL, Suk H-J, Abdurrob F, Drummond GT, Guan W, et al. Multi-sensory gamma stimulation ameliorates Alzheimer’s-associated pathology and improves cognition. Cell. 2019;177(2):256-71. e22.
[20]. Cárdenas J, Blanca MJ, Carvajal F, Rubio S, Pedraza C. Emotional processing in healthy ageing, mild cognitive impairment, and Alzheimer’s disease. International Journal of Environmental Research and Public Health. 2021;18(5):2770.
[21]. Dubois B, Touchon J, Portet F, Ousset P, Vellas B, Michel B. " The 5 words": a simple and sensitive test for the diagnosis of Alzheimer's disease. Presse Médicale (Paris, France: 1983). 2002;31(36):1696-9.
[22]. Mormont E, Jamart J, Robaye L. Validity of the five-word test for the evaluation of verbal episodic memory and dementia in a memory clinic setting. Journal of Geriatric Psychiatry and Neurology. 2012;25(2):78-84.
[23]. Langeluddecke PM, Lucas SK. Wechsler Adult Intelligence Scale–Third Edition findings in relation to severity of brain injury in litigants. The Clinical Neuropsychologist. 2003;17(2):273-84.
[24]. Jahanshahi M, Saleem T, Ho AK, Fuller R, Dirnberger G. A preliminary investigation of the running digit span as a test of working memory. Behavioural neurology. 2008;20:17-25.
[25]. EMOTIV. EPOC X User Manual2023 August 18, 2023.
[26]. Tzanetakis G, Cook P. Musical genre classification of audio signals. IEEE Transactions on speech and audio processing. 2002;10(5):293-302.
[27]. Abhang PA, Gawali BW, Mehrotra SC. Technological Basics of EEG Recording and Operation of Apparatus: Academic Press; 2016.
[28]. Othman E, Yusoff AN, Mohamad M, et al. Low intensity white noise improves performance in auditory working memory task: An fMRI study. Heliyon. 2019;5(9):e02444
[29]. Souza AS, Barbosa LCL. Should we turn off the music? Music with lyrics interferes with cognitive tasks. Journal of cognition. 2023;6(1).