


1. Introduction
Alzheimer’s Disease (AD) is a progressive neurodegenerative disorder characterized by cognitive decline and memory loss. Early diagnosis is crucial for initiating interventions that can slow disease progression and improve the quality of life for patients. Traditional diagnostic methods, such as neuroimaging and cognitive assessments, are often employed when significant brain damage has already occurred. Therefore, there is a growing need for non-invasive, cost-effective diagnostic tools capable of detecting AD at its earliest stages. Electroencephalography (EEG) is an emerging tool in this regard, offering real-time insights into the brain’s electrical activity. EEG captures neuronal oscillations that reflect the underlying neural processes, which are disrupted in early AD. Studies have shown that patients with early AD exhibit specific changes in EEG signal characteristics, such as reduced alpha power and increased theta power. These alterations are associated with cognitive decline and can be quantitatively measured to aid in early diagnosis. In addition to EEG signal analysis, brain network analysis provides a deeper understanding of the functional connectivity disruptions that occur in early AD. Techniques such as coherence and phase synchronization methods can assess the strength and directionality of interactions between different brain regions. These analyses reveal significant disruptions in networks crucial for memory and cognitive functions, offering potential biomarkers for early AD detection. Moreover, quantitative EEG (qEEG) techniques, including power spectral density (PSD) analysis, fractal dimension, and entropy, allow for a detailed examination of EEG signal alterations. Integrating these features into machine learning algorithms can enhance the predictive accuracy of early AD diagnosis. This paper also explores mathematical models of brain networks, such as the Kuramoto model, which simulate neuronal interactions and phase synchronization. These models provide insights into the mechanisms underlying functional connectivity changes and predict the progression of network alterations in early AD [1]. When combined with empirical EEG data, these models can generate predictive maps of network alterations, guiding the development of therapeutic strategies. Finally, we discuss the benefits of integrating EEG with other diagnostic tools, such as MRI and PET, to create a multimodal diagnostic approach. This comprehensive framework offers a robust method for early AD diagnosis and monitoring, improving the overall effectiveness of diagnostic and therapeutic strategies.
2. EEG and Early Alzheimer’s Disease
2.1. EEG Signal Characteristics in Early AD
EEG signals are reflective of the underlying neuronal activity in the brain. In early AD, changes in EEG signal characteristics, such as amplitude and frequency, can indicate disrupted neural processes. Studies have shown that patients with early AD exhibit decreased alpha power and increased theta power, which are associated with cognitive decline. These alterations in EEG patterns can be quantitatively measured and analyzed to identify early AD, offering a non-invasive and cost-effective diagnostic tool. Specifically, the reduction in alpha oscillations, which are critical for cognitive tasks such as attention and memory, suggests a breakdown in cortical communication and synchronization. Theta power increase, on the other hand, is often correlated with compensatory mechanisms or the recruitment of additional cognitive resources, indicating early neural attempts to counteract the deficits caused by AD [2].
2.2. Functional Connectivity Analysis
Functional connectivity refers to the statistical dependencies between spatially separated brain regions. In early AD, the disruption of functional connectivity is evident in EEG recordings. By applying coherence and phase synchronization methods, researchers can assess the strength and directionality of interactions between different brain areas. This analysis reveals reduced connectivity in the default mode network (DMN) and other critical regions involved in memory and cognitive functions, providing crucial biomarkers for early AD detection. Coherence measures the correlation between EEG signals at different electrodes, reflecting the degree of synchronization between brain regions. Phase synchronization, on the other hand, examines the temporal alignment of oscillatory phases, providing insights into the timing of neuronal interactions. Reduced coherence and phase synchronization in the DMN, which includes regions such as the medial prefrontal cortex and posterior cingulate cortex, indicate a breakdown in the network responsible for self-referential and memory-related processes [3]. These findings suggest that early AD disrupts the functional integration of brain networks, impairing cognitive function. Table 1 shows the results of a multimodal diagnostic approach for early Alzheimer’s disease (AD). The table includes 5 subjects with various metrics such as age, MMSE score, EEG alpha and theta power, MRI hippocampal volume, PET amyloid plaques, CSF Aβ-42 level, CSF tau level, and diagnosis [4].
Table 1. Multimodal Diagnostic Data For Early AD
Subject ID | Age | MMSE Score | EEG Alpha Power | EEG Theta Power | MRI Hippocampal Volume | PET Amyloid Plaques | CSF Aβ 42 Level | CSF Tau Level | Diagnosis | S001 | 66 | 19 | 7.02 | 6.07 | 2.85 | 2.78 | 344.65 | 241.95 | Mild Cognitive Impairment | S002 | 79 | 13 | 5.32 | 3.17 | 2.53 | 1.29 | 323.03 | 494.96 | Early AD | S003 | 88 | 23 | 6.27 | 6.98 | 4.03 | 2.03 | 350.87 | 272.91 | Mild Cognitive Impairment | S004 | 74 | 25 | 6.23 | 4.88 | 4.11 | 1.47 | 364.84 | 425.59 | Healthy | S005 | 70 | 24 | 8.48 | 4.12 | 3.19 | 2.16 | 324.34 | 536.28 | Early AD |
2.3. Quantitative EEG Analysis
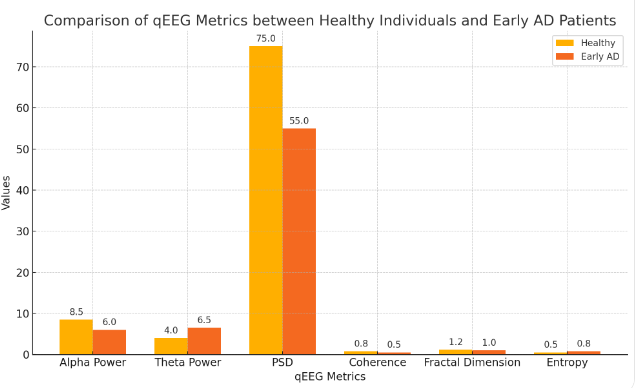
Quantitative EEG (qEEG) analysis involves the application of mathematical and statistical techniques to extract meaningful information from raw EEG data. Techniques such as power spectral density (PSD) and coherence analysis enable the quantification of EEG signal alterations in early AD. By comparing qEEG metrics between healthy individuals and those with early AD, significant differences can be identified, aiding in the development of diagnostic criteria and enhancing the accuracy of early AD detection. PSD analysis provides a measure of the power distribution across different frequency bands, revealing the characteristic shifts in EEG activity associated with early AD. Coherence analysis, as mentioned earlier, quantifies the degree of functional connectivity between brain regions [5]. Additional qEEG metrics, such as fractal dimension and entropy, can provide insights into the complexity and regularity of EEG signals, further distinguishing early AD patients from healthy controls. The integration of these qEEG features into machine learning algorithms can enhance the predictive accuracy of early AD diagnosis, offering a robust and objective diagnostic tool. Figure 1 compares various qEEG metrics between healthy individuals and early AD patients.
 Q
Q
Figure 1. Comparison of qEEG Metrics between Healthy Individuals and Early AD Patients
3. Brain Network Dynamics
3.1. Network Topology in Early AD
The brain functions as a complex network with interconnected regions that facilitate information processing and cognitive functions. In early AD, changes in network topology, such as decreased global efficiency and increased local clustering, are observed. Graph theory-based approaches allow for the quantification of these topological changes, providing a comprehensive understanding of how AD affects brain network dynamics. These metrics can serve as potential biomarkers for early diagnosis, offering insights into the underlying neural mechanisms of AD. Global efficiency reflects the overall integration of the brain network, with decreased values indicating a loss of long-range connectivity crucial for efficient information transfer. Local clustering, on the other hand, measures the degree of local interconnectedness, with increased values suggesting a shift towards more localized processing [6]. These topological changes are indicative of a reorganization of brain networks in response to early AD, with a tendency towards reduced global integration and increased local segregation. The application of graph theory metrics, such as node degree, betweenness centrality, and clustering coefficient, provides a detailed characterization of these network alterations, facilitating early AD diagnosis [7].
3.2. Small-World Network Properties
The brain’s small-world network properties, characterized by a balance between local specialization and global integration, are disrupted in early AD. This disruption leads to impaired information processing and cognitive decline. By analyzing small-world parameters such as clustering coefficient and characteristic path length, researchers can detect deviations from normal brain network organization in early AD patients. These findings support the use of brain network analysis as a diagnostic tool for early AD, highlighting the importance of maintaining small-world network integrity for cognitive health [8]. The clustering coefficient measures the extent of local interconnectedness, while the characteristic path length represents the average shortest path between nodes, reflecting the efficiency of information transfer across the network. In early AD, a reduction in small-world properties indicates a shift towards more random network organization, impairing the brain’s ability to efficiently process and integrate information. These alterations can be quantified using network models and simulations, providing insights into the neural basis of cognitive deficits in early AD [9].
3.3. Mathematical Models of Brain Networks
Mathematical models play a crucial role in understanding the complex dynamics of brain networks in early AD. Models such as the Ising model and Kuramoto model simulate neuronal interactions and phase synchronization, providing insights into the mechanisms underlying functional connectivity changes. The Kuramoto model describes the phase dynamics of a set of coupled oscillators:
\( \frac{d{θ_{i}}}{dt}={ω_{i}}+\sum _{j=1}^{N}{K_{ij}}sin{({θ_{j}}-{θ_{i}})}\ \ \ (1) \)
Here 𝜃𝑖 is the phase of the 𝑖i-th oscillator, 𝜔𝑖 is the natural frequency of the 𝑖-th oscillator, 𝐾𝑖𝑗 is the coupling strength between oscillators 𝑖 and 𝑗, 𝑁 is the total number of oscillators.
This equation describes how the phase 𝜃𝑖 of each oscillator 𝑖 evolves over time, influenced by its own natural frequency 𝜔𝑖 and the sum of the coupling effects from all other oscillators 𝑗.
By fitting these models to empirical EEG data, researchers can predict the progression of network alterations in early AD, facilitating early diagnosis and monitoring of disease progression. These models also offer a framework for developing targeted interventions to restore normal brain network function in AD patients [10]. The Ising model, for instance, can simulate the effects of neuronal coupling and external perturbations on network synchronization, revealing how changes in connectivity patterns emerge in early AD. The Kuramoto model, on the other hand, can simulate the phase synchronization dynamics of oscillatory networks, providing insights into the temporal coordination of neuronal activity. By integrating these models with EEG data, researchers can generate predictive maps of network alterations, guiding the development of therapeutic strategies aimed at restoring normal network function.
4. Clinical Implications
4.1. Early Detection and Intervention
The ability to detect early AD through EEG and brain network analysis has significant clinical implications. Early diagnosis enables timely intervention, which can slow disease progression and improve patient quality of life. Non-invasive and cost-effective, EEG-based diagnostics can be easily implemented in clinical settings, providing a practical solution for early AD detection. This approach also allows for regular monitoring of disease progression, enabling personalized treatment plans and better management of AD [11]. The development of standardized EEG protocols and diagnostic criteria, based on the quantitative analyses discussed earlier, can facilitate the widespread adoption of EEG-based diagnostics in clinical practice. Additionally, the integration of EEG data with other clinical assessments, such as cognitive tests and neuroimaging, can enhance the accuracy and reliability of early AD diagnosis.
4.2. Neurofeedback Training and Personalized Medicine
Neurofeedback training, guided by real-time EEG data, holds significant promise for advancing personalized medicine in Alzheimer’s Disease (AD). By identifying unique patterns of functional connectivity disruption in individual patients, these techniques enable clinicians to customize interventions that cater to the specific neural deficits of each patient. This personalized approach not only enhances the efficacy of treatments but also minimizes the risk of adverse effects, thereby improving overall patient outcomes. EEG-based diagnostics can identify which brain networks are most affected in an individual, allowing for targeted therapeutic interventions. Patients exhibiting pronounced disruptions in critical networks, such as the Default Mode Network (DMN), can benefit from specific strategies aimed at restoring connectivity in these areas. Techniques such as neurofeedback, which involves training patients to modify their brain activity patterns, and brain stimulation methods like transcranial magnetic stimulation (TMS) or transcranial direct current stimulation (tDCS), can be tailored based on EEG findings to optimize neural function and cognitive performance. Neurofeedback training, guided by real-time EEG data, can help patients enhance their brain’s functional connectivity by providing them with feedback on their brain activity. This method has the potential to reinforce positive neural patterns and suppress maladaptive ones, leading to improvements in cognitive function and a slowdown in disease progression. Similarly, brain stimulation techniques can be precisely targeted to the disrupted networks identified by EEG analysis, ensuring that the intervention is both effective and efficient. Furthermore, EEG-based diagnostics can aid in the selection of pharmacological treatments. By understanding the specific neural circuitry affected in a patient, clinicians can choose medications that target the underlying pathophysiological mechanisms, thereby improving the therapeutic outcomes. This approach is particularly beneficial in AD, where the heterogeneity of the disease can result in varied responses to treatment [12]. In addition to guiding treatment selection, personalized EEG analysis can monitor treatment efficacy over time. Regular EEG assessments can track changes in brain connectivity patterns, allowing clinicians to adjust interventions as needed to maintain or enhance their effectiveness. This dynamic, responsive approach ensures that patients receive the most appropriate and effective care throughout the course of their disease.
4.3. Integration with Other Diagnostic Tools
Integrating EEG and brain network analysis with other diagnostic tools, such as neuroimaging and biomarker assays, can enhance the accuracy of early AD diagnosis. Multimodal approaches provide a comprehensive assessment of brain health, capturing different aspects of AD pathology. Combining EEG with structural and functional imaging techniques, such as MRI and PET, allows for the correlation of functional connectivity changes with structural abnormalities and metabolic deficits. This integrative approach offers a robust framework for early AD diagnosis and monitoring, improving the overall effectiveness of diagnostic and therapeutic strategies. For example, the use of amyloid PET imaging to detect amyloid plaques, combined with EEG-based functional connectivity analysis, can provide a more complete picture of AD pathology, facilitating earlier and more accurate diagnosis [13]. The development of multimodal diagnostic platforms, incorporating EEG, neuroimaging, and biomarker data, represents a promising avenue for advancing early AD detection and treatment.
5. Conclusion
This study underscores the potential of EEG and brain network analysis in the early diagnosis of Alzheimer’s Disease. By identifying characteristic changes in EEG signals and disruptions in functional connectivity, these methods offer valuable biomarkers for early detection. Quantitative EEG techniques and mathematical models further enhance diagnostic accuracy and provide insights into the underlying neural mechanisms. Integrating EEG with other diagnostic tools, such as neuroimaging and biomarker assays, creates a comprehensive approach that improves early diagnosis and informs personalized treatment strategies. This integrative framework, coupled with neurofeedback training, represents a significant advancement in AD research and clinical practice, promising better outcomes for patients through earlier intervention and tailored therapeutic approaches.
References
[1]. Trejo-Lopez, Jorge A., Anthony T. Yachnis, and Stefan Prokop. “Neuropathology of Alzheimer’s disease.” Neurotherapeutics 19.1 (2023): 173-185.
[2]. Askenazi, Manor, et al. “Compilation of reported protein changes in the brain in Alzheimer’s disease.” Nature Communications 14.1 (2023): 4466.
[3]. Hansson, Oskar, et al. “Blood biomarkers for Alzheimer’s disease in clinical practice and trials.” Nature Aging 3.5 (2023): 506-519.
[4]. Andrews, Shea J., et al. “The complex genetic architecture of Alzheimer’s disease: novel insights and future directions.” EBioMedicine 90 (2023).
[5]. Gao, Xiaohui, et al. “A novel robust Student’s t-based Granger causality for EEG based brain network analysis.” Biomedical Signal Processing and Control 80 (2023): 104321.
[6]. Asadi, Borhan, et al. “Brain analysis with a complex network approach in stroke patients based on electroencephalography: a systematic review and meta-analysis.” Healthcare. Vol. 11. No. 5. MDPI, 2023.
[7]. Chiarion, Giovanni, et al. “Connectivity analysis in EEG data: a tutorial review of the state of the art and emerging trends.” Bioengineering 10.3 (2023): 372.
[8]. Bahrami, Mohsen, et al. “Brain network analysis: A review on multivariate analytical methods.” Brain connectivity 13.2 (2023): 64-79.
[9]. Blanco, Rosmary, Cemal Koba, and Alessandro Crimi. “Investigating the interaction between EEG and fNIRS: a multimodal network analysis of brain connectivity.” bioRxiv (2023): 2023-11.
[10]. Ekhlasi, Ali, Ali Motie Nasrabadi, and Mohammadreza Mohammadi. “Analysis of EEG brain connectivity of children with ADHD using graph theory and directional information transfer.” Biomedical Engineering/Biomedizinische Technik 68.2 (2023): 133-146.
[11]. Kurkin, Semen, et al. “Features of the resting-state functional brain network of children with autism spectrum disorder: EEG source-level analysis.” The European Physical Journal Special Topics 232.5 (2023): 683-693.
[12]. Nuamah, Joseph, and Jimmy Uba. “Graph analysis of functional brain networks under varying working memory load: An EEG-based minimum spanning tree approach.” Cognitive Systems Research 86 (2024): 101238.
Cite this article
Wang,D. (2024). EEG and brain network analysis in the early diagnosis of Alzheimer's disease. Theoretical and Natural Science,58,60-65.
Data availability
The datasets used and/or analyzed during the current study will be available from the authors upon reasonable request.
Disclaimer/Publisher's Note
The statements, opinions and data contained in all publications are solely those of the individual author(s) and contributor(s) and not of EWA Publishing and/or the editor(s). EWA Publishing and/or the editor(s) disclaim responsibility for any injury to people or property resulting from any ideas, methods, instructions or products referred to in the content.
About volume
Volume title: Proceedings of the 4th International Conference on Biological Engineering and Medical Science
© 2024 by the author(s). Licensee EWA Publishing, Oxford, UK. This article is an open access article distributed under the terms and
conditions of the Creative Commons Attribution (CC BY) license. Authors who
publish this series agree to the following terms:
1. Authors retain copyright and grant the series right of first publication with the work simultaneously licensed under a Creative Commons
Attribution License that allows others to share the work with an acknowledgment of the work's authorship and initial publication in this
series.
2. Authors are able to enter into separate, additional contractual arrangements for the non-exclusive distribution of the series's published
version of the work (e.g., post it to an institutional repository or publish it in a book), with an acknowledgment of its initial
publication in this series.
3. Authors are permitted and encouraged to post their work online (e.g., in institutional repositories or on their website) prior to and
during the submission process, as it can lead to productive exchanges, as well as earlier and greater citation of published work (See
Open access policy for details).
References
[1]. Trejo-Lopez, Jorge A., Anthony T. Yachnis, and Stefan Prokop. “Neuropathology of Alzheimer’s disease.” Neurotherapeutics 19.1 (2023): 173-185.
[2]. Askenazi, Manor, et al. “Compilation of reported protein changes in the brain in Alzheimer’s disease.” Nature Communications 14.1 (2023): 4466.
[3]. Hansson, Oskar, et al. “Blood biomarkers for Alzheimer’s disease in clinical practice and trials.” Nature Aging 3.5 (2023): 506-519.
[4]. Andrews, Shea J., et al. “The complex genetic architecture of Alzheimer’s disease: novel insights and future directions.” EBioMedicine 90 (2023).
[5]. Gao, Xiaohui, et al. “A novel robust Student’s t-based Granger causality for EEG based brain network analysis.” Biomedical Signal Processing and Control 80 (2023): 104321.
[6]. Asadi, Borhan, et al. “Brain analysis with a complex network approach in stroke patients based on electroencephalography: a systematic review and meta-analysis.” Healthcare. Vol. 11. No. 5. MDPI, 2023.
[7]. Chiarion, Giovanni, et al. “Connectivity analysis in EEG data: a tutorial review of the state of the art and emerging trends.” Bioengineering 10.3 (2023): 372.
[8]. Bahrami, Mohsen, et al. “Brain network analysis: A review on multivariate analytical methods.” Brain connectivity 13.2 (2023): 64-79.
[9]. Blanco, Rosmary, Cemal Koba, and Alessandro Crimi. “Investigating the interaction between EEG and fNIRS: a multimodal network analysis of brain connectivity.” bioRxiv (2023): 2023-11.
[10]. Ekhlasi, Ali, Ali Motie Nasrabadi, and Mohammadreza Mohammadi. “Analysis of EEG brain connectivity of children with ADHD using graph theory and directional information transfer.” Biomedical Engineering/Biomedizinische Technik 68.2 (2023): 133-146.
[11]. Kurkin, Semen, et al. “Features of the resting-state functional brain network of children with autism spectrum disorder: EEG source-level analysis.” The European Physical Journal Special Topics 232.5 (2023): 683-693.
[12]. Nuamah, Joseph, and Jimmy Uba. “Graph analysis of functional brain networks under varying working memory load: An EEG-based minimum spanning tree approach.” Cognitive Systems Research 86 (2024): 101238.