


1. Introduction
The Red dwarf is a star that makes up the largest population of stars within the galaxy, inherently small, dim, and colder [1]. They can be difficult to detect thanks to their ability to hide in the shadows, far too dim and small in mass to be seen with the naked eye from Earth. Their limited radiance helps to extend their lifetimes, which are far greater than that of the sun. Red dwarfs include the smallest of the stars, weighing between 7.5% and 50% of the sun's mass and around 10 percent of the luminosity[2]. Their reduced size means they burn at a lower temperature, reaching only 6,380 degrees Fahrenheit (3,500 degrees Celsius). The sun, by comparison, has a temperature of 9,900 degrees Fahrenheit or around 5500 degrees Celsius [3]. The low temperatures of red dwarfs mean they are far, far dimmer than stars like the sun [4]. We intend to utilize the change of the flux of the red dwarf (also called the Transit Phenomenon) to discover if there is an exoplanet within a given red dwarf entity. However, as previously mentioned, the inherent property of the red dwarf star is too dim to be detected with ease or directly through a telescope, let alone finding a planet around it, thanks not only to its dimness but also the smaller size of the red dwarf and constant stellar flares.
Although the goal of detecting new exoplanets around Red Dwarfs is highly challenging to achieve, our group still set a plan to find out the exo-planet through the transit phenomenon; we expected to find out about 3 to 5 exo-planets through available Tess data. We intend to find new exo-planetary discoveries through coding to show the relative flux pattern of the red dwarf and various codes and programs to analyze the data pattern to find out the existence of any exo-planet around a red dwarf.
2. Methodology
In this research, we checked 400 lines of data from the Winter Table. At the same time, we only print the graph of the data, which has an exposure time of 1800s and generated by TESS SPOC.
In the process of finding transits around a red dwarf, our team employs the following methods:
2.1. Basic graphing codes
This method is employed in every first step of checking data; if there is a decisive down curve in the flux versus time graph, it will be a transit. However, cases like that are sporadic.
2.2. Lomb-Scargle periodogram [5]
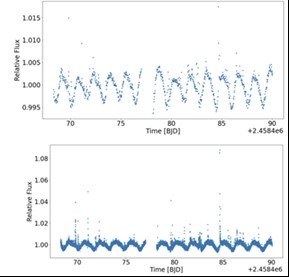
This method is used when the initial graph of flux versus time has no clear sign of transit, and the star has a rotational signal that disturbs our discovery(figure 1). Under this circumstance, we will use the Lomb-Scargle periodogram to remove the rotational signal. Figure 1 shows the sample we select in this paradigm.
| |
Figure 1. GJ234. | |
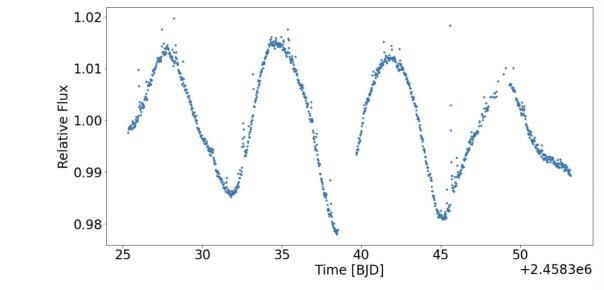
In figure 2, the light curve of the star is printed.
Step 1: Print the light curve of the star.
| |
Figure 2. GJ865. | |
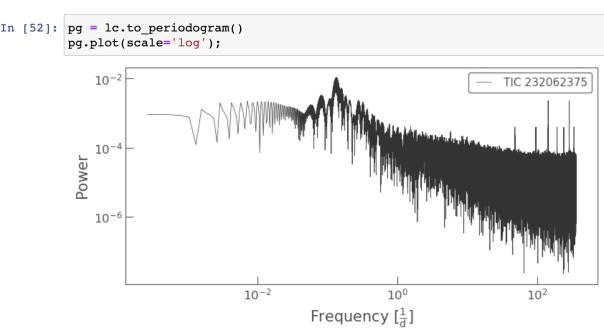
Then in figure 3, the frequency domain is shown.
Step 2: Converting it to the frequency domain.
| |
Figure 3. Trequency domain. | |
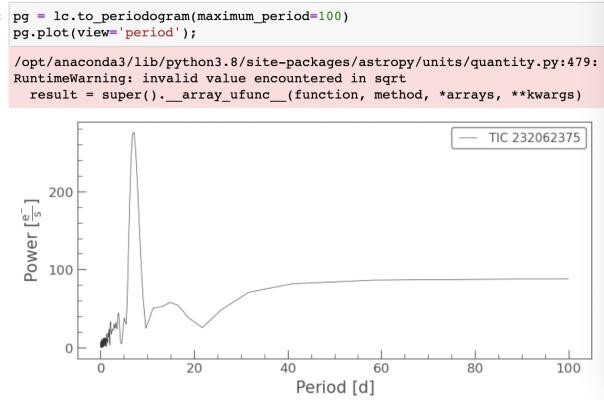
Step 3: Truncating the periodogram to maximum period of 100(since the period of the star is smaller than100, and this can be inferred from lightcurve above).
| |
Figure 4. Maximum period of this sample. | |
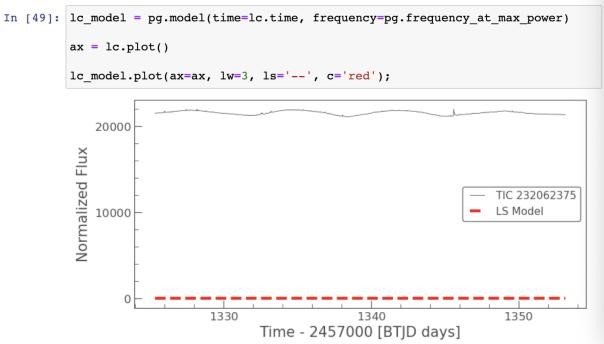
Step 4:
Lc Model.
| |
Figure 5. Lc model. | |
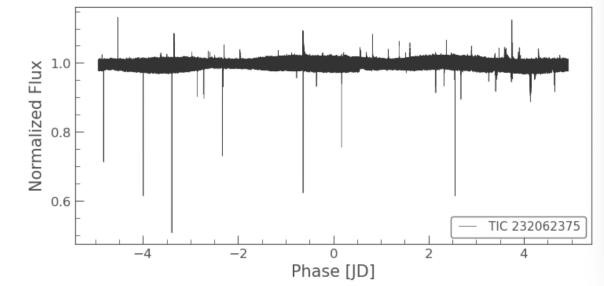
Step 5: Get binned and unbinned lines.
If there’s a down curve, it will be a transit.
|
Figure 6. Final graph. |
In figure 4,5,6, the exact procedure of this methods are clear and the final result is shown in figure 6.
2.3. BLS algorithm[6]
This method will generate a BLS power graph; it will likely be a transit if it shows a periodical pattern.
Figure 7 show the patterns of BLS method and its procedure.
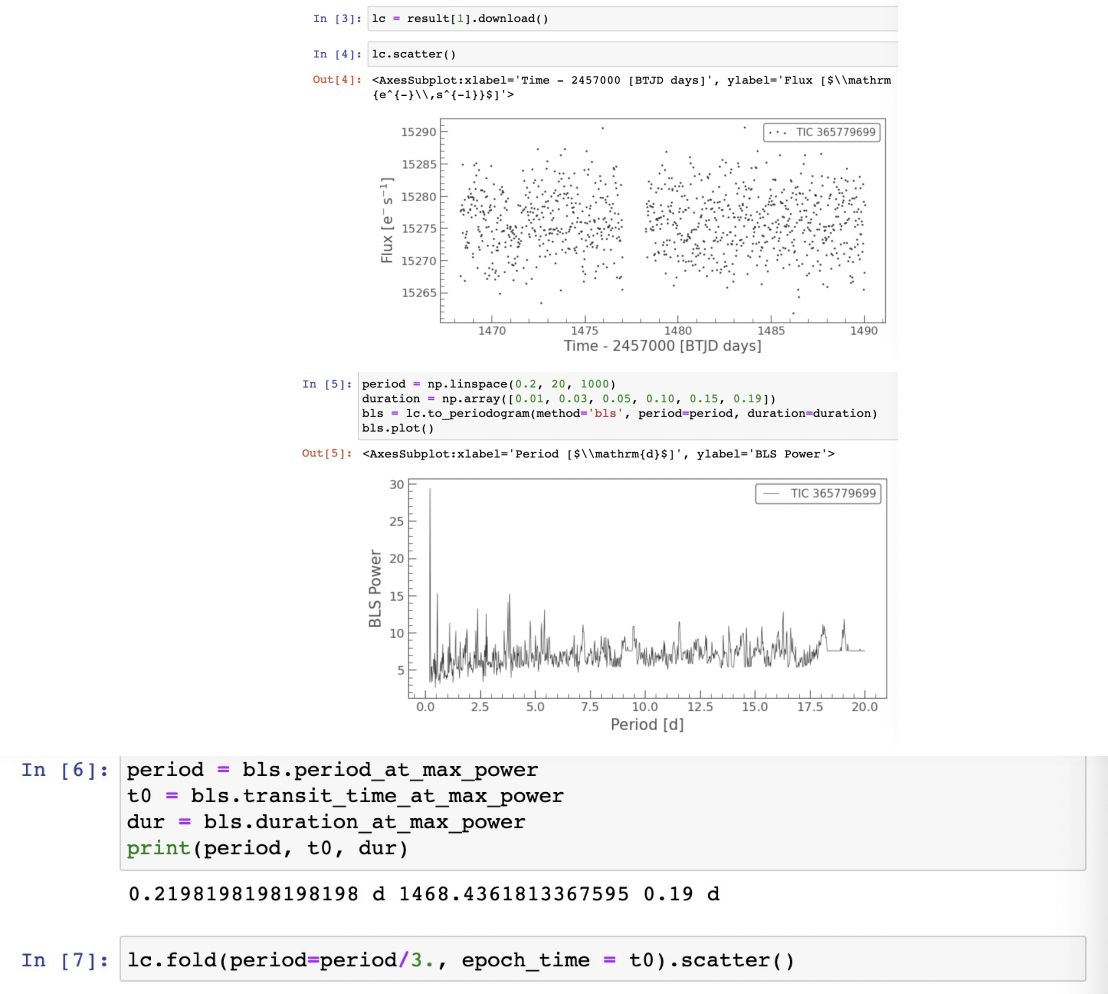
Figure 7. Bls method sample.
3. Result analysis and Instrumental noises
3.1. Types of cases
As stated before, this group's primary research goal is to find any transiting planets orbiting around the planet red dwarf with masses of 0.1 M/Me 0.3 within 15 parsecs. In the universe, the red dwarf is a planet that is darker than the other planets, so it is relatively more challenging to get a positive transit result, not to mention a smaller size[1]. In all the methods mentioned above, we mainly used flux versus time graph to analyze the data and, if needed, zoom in for some parts of the graph for the possibility of a potentially positive result to get the most accurate result. Based on the 400 data from TESS for which the researchers had analyzed, there are mainly four types of graphs that have an outcome as a result.
The first type is the standard graph; it is a group of data packed together with no periodical changes and trends. Take GJ 445 as an example (as shown in figure 8); they both represent data with no periodical changes or patterns.
| |
Figure 8. Type 1 of the patterns. | |
This "packing" of fluxes can be found in the graph's lower or upper parts, which does not represent significant changes. In the graph, there are striking figures that are higher or below the normal flux distributions. The researchers have attributed these strikes to the irregular flares of the planet itself. Flares lead to an occasional increase in temperature, causing an increase in sensitivity of the detector. In addition, more types of flares will be discussed in later parts of the paper.
The second type is sin graph as shown in figure 9, for which the flux distribution in the graph is an approximate adjustment to the sinusoidal mathematical trend with few minimal variations. An example to look at in this case is the star GJ 234, which is shown below.
| |
Figure 9. Type 2 of the patterns. | |
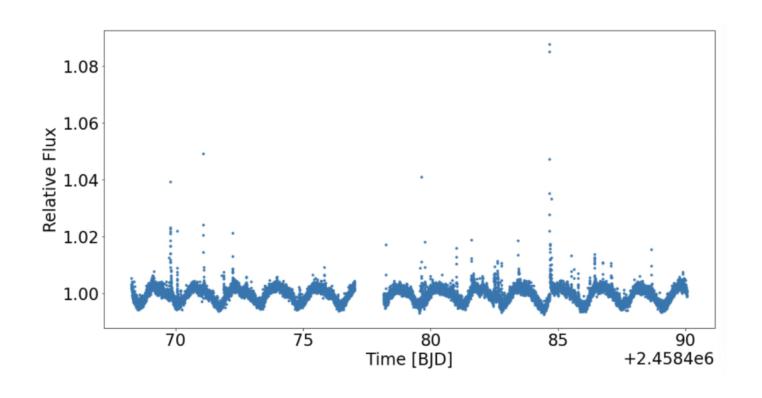
Through the Team’s analysis of the graph, the periodical trends of fluxes are very significant and easily observed. Due to research, this phenomenon is caused by the rotation of the planet. Many of the other periodical patterns of the graph are caused by the rotation of the planet.
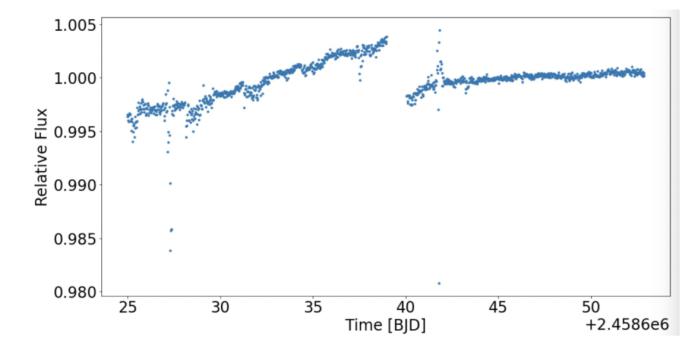
The third type of graph is the "increasing graph." These graphs do not have an apparent trend or pattern; they are effectively variations from sinusoidal or linear graphs; they are increasing in specific ranges. An example is displayed below. As shown, specific amounts of spikes are present as well due to the planet's stellar flares.
In figure 10, There is a noticeable shift and fault in this graph, making it not as continuous as it should be. This issue is due to certain instrumental flaws and errors or electronic noises elaborated in the latter paper.
| |
Figure 10. Type 3 of possible patterns. | |
The fourth type of graph is errors, which will show up in the lightkurve notebook during data analysis like the figure 11 below.
| |
Figure 11. Result sample. | |

The result might originate from the possibility that TESS has not yet detected any data of this planet in the universe. The planet might be too recent for the detectors to collect data, so this group has no data to analyze. The possibility that the error will pop out is approximately one in five, an appropriately small proportion. However, it still potentially may significantly influence the result given the rarity of exoplanets orbiting around a red dwarf star within 15 parsecs that has not yet been discovered.
3.2. Instrumental noises
As mentioned above, certain types of odd signs in the graph are caused mainly by instrumental noises.
As mentioned previously, various types of flares are present in the graphs. When flares occur on planets in the universe, they emit cosmic rays, hitting the detector and increasing its sensitivity, thus creating these spikes in the graph. From the data mentioned above, the sudden spikes are all considered as flares; they have to appear singularly in a certain amount of range and with an unusually high number of fluxes.
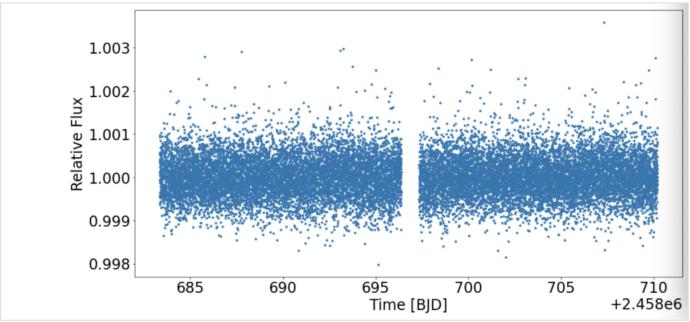
Second, in most of the graphs analyzed, there are one or two breaks present; in other words, the fluxes are not always continuous in one to two short time ranges. These "time gaps" shown in figure 12 and 13 are caused by the detector spacecraft. The detector rotates around planets to detect data and fluxes. It has to restart another detecting cycle after every amount of time, so as shown below, there is always a time gap within the graph after every sector[7].
| |
Figure 12. One type of noises. | |
| |
Figure 13. Gap appears in the graphs. | |
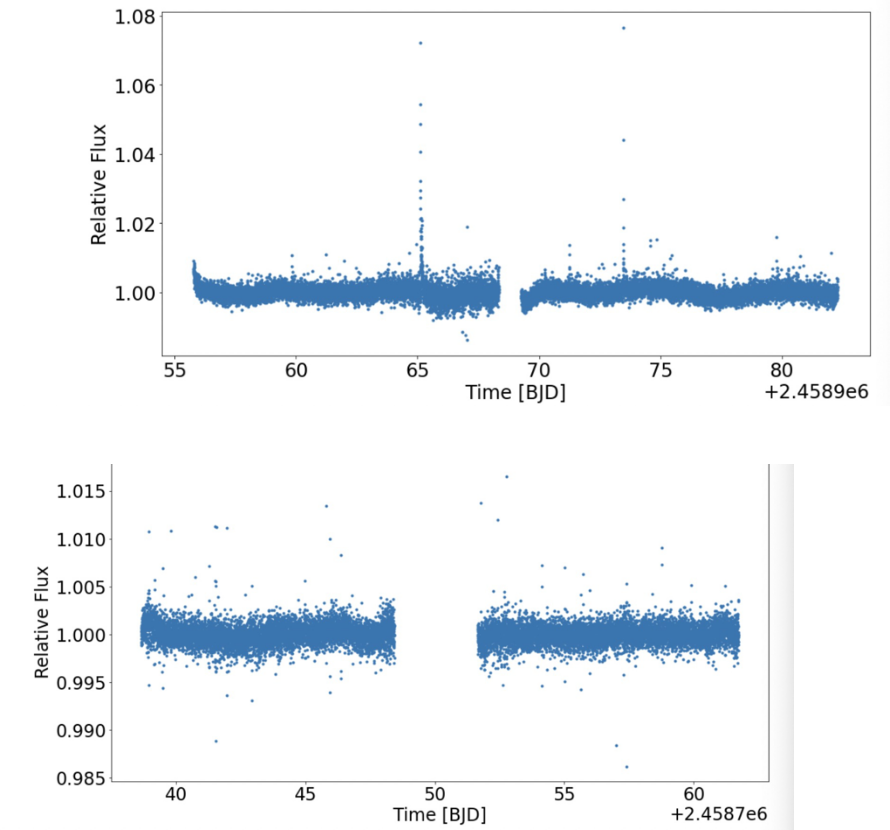

Due to this situation, some graphs even display a fault, which disturbs the trend overall. For example, figure 12 from above is supposed to be a continuously increasing trend. However, after the sudden break of one sector, it suddenly dropped for a certain amount because the detector needed restarting, breaking the data apart.
The third significant instrumental noise is manifested as gaps in the graphs. Take the following as an example, graph as an example.
| |
Figure 14. Possible circumstances of noise in data mapping. | |
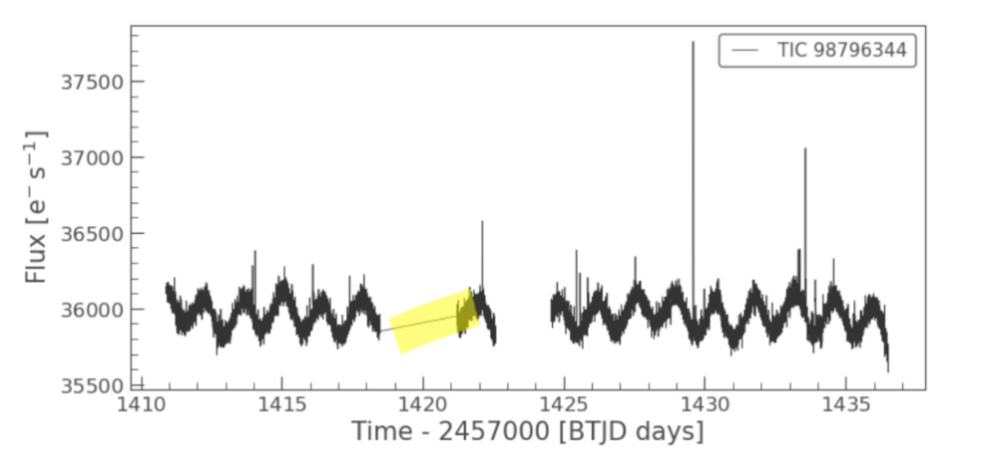
The highlighted part in the middle region of figure 14 is an example of gaps. It appeared because there is no thermal transient but still has temperature changes, so there are still graphs present but do not show the trend as the rest of the graph does. In short, it is caused by the loss of fine pointing.
3.3. Transit result
Finally, the main goal is to check whether there are transits in a graph to show the possible existence of exoplanets around the red dwarf. A transit is an unusual dip in the flux graph, a sudden decrease in the amount of flux. A successfully found transit is shown down below in figure 15.
| |
Figure 15. GJ1061. | |
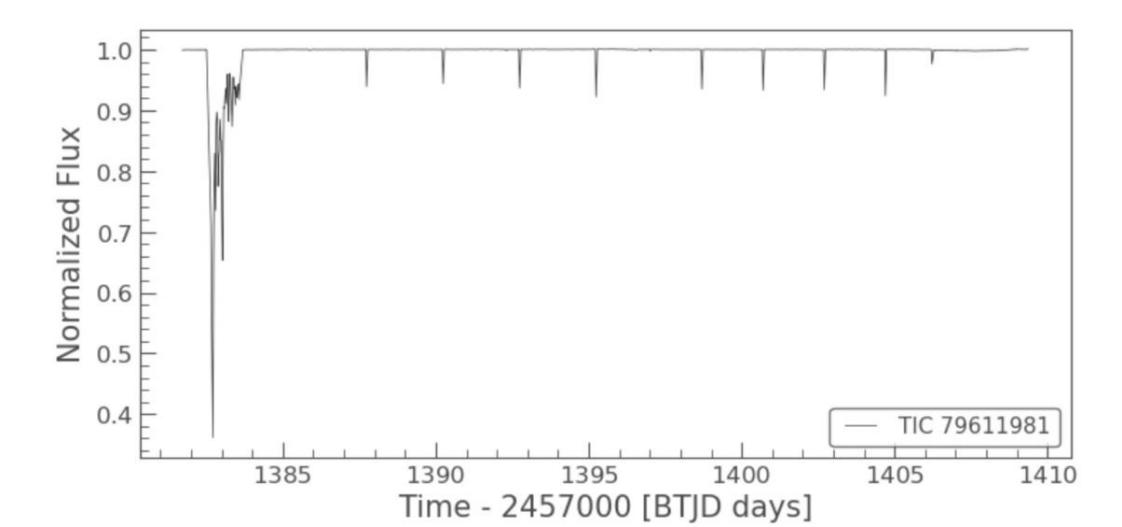
Although we failed in the original quest of finding formerly undiscovered exoplanets orbiting a red dwarf within 15 parsecs of the Tess telescope, we have nonetheless been able to confirm the existence of formerly known exoplanets of GJ411 and GJ1061, and through the usage of the Doppler shift method as well as cross-referencing the data on Nasa Exoplanet Archives[8], we manage to securely confirm the transit of that two exoplanets within their respective red dwarf star system.
4. Conclusion
This investigation into transiting exoplanets around red dwarfs, alongside red dwarfs' properties with Masses 0.1 M/Me 0.3 within 15 Parsecs [9] has not produced a significant yield of transiting exoplanets. Time constraints concerning the data and human resources, alongside the unavailability of the data within multiple systems, not to mention the potential human error of missing or misidentifying Minuit exoplanetary transits within an extremely faint system or one obscured or misidentified with a prolonged solar fare, all have contributed to the hurdles that the investigation has faced.
Due to time limitations, the team has not used the doppler to confirm the transit of every exoplanet within the Nasa Exoplanet Archive (within the range of 15 parsecs for red dwarfs' with Masses 0.1 M/Me 0.3, though, in the future, more data may be utilized to identify under what circumstances the transit pattern to allow us to more rapidly transition into the usage of the doppler method of astronomical detection.
Despite those difficulties, we have managed to investigate many properties of the red dwarf and confirm the transits of a couple of exoplanets around red dwarfs; among them are GJ 411 and GJ 1061, which the team was able to double-check through the Doppler shift method [10], confirming their transits, as well as the correlation of the two methods, alongside correlation to the Nasa Exoplanet Archive.
Throughout this investigation, the nature of the various red dwarfs often shown a significant number of solar flares within the observed interval; hence it is potentially desirable to calculate the periods of the solar flares in order to both understand the rate of solar flares as well as the proper timing needed to avoid a large solar flare potentially clouding a smaller exoplanet in transit, as result of the smaller size of the red dwarf relative to other stellar entities ensuring smaller exoplanet bodies nearby making detection even more challenging to achieve.
Throughout this investigation, the nature of the various red dwarfs often shown a significant number of solar flares within the observed interval; hence it is potentially desirable to calculate the periods of the solar flares in order to both understand the rate of solar flares as well as the proper timing needed to avoid a large solar flare potentially clouding a smaller exoplanet in transit, as result of the smaller size of the red dwarf relative to other stellar entities ensuring smaller exoplanet bodies nearby making detection even more challenging to achieve.
Though solar flares have significantly hindered the research process, given the sheer commonality of the flares within red dwarfs in comparison to other stellar entities, it does bring forth the question regarding the relationship between the existence of an exoplanet within the orbits of a red dwarf with the intensity of solar flares; until recent studies into the HD 189733 in Route, Matthew [11] showing no such relations within this system, astronomers had long assumed the existence of planetary influence upon solar flare intensity and occurrence; however, as no relationship was detected within Route's study questioning the foundation of this thesis, yet as Route had stellar study object much more significant than red dwarves hence being more resistant to the effect of a planet it could not be seen as genuinely decisive, and given the smaller size of the red dwarf, in comparison to other stars, the chance of magnetic effect of the planet may be felt at a greater level and easier to detect, potentially answering this debate.
The transit of exoplanets around a red dwarf is challenging to detect due to the faint and relatively minor nature of the red dwarfs, which in many cases are smaller than that of Jupiter, however thorough understanding of various properties of the red dwarf major hurdles within the discovery of exoplanets may be solved, allowing us to find exoplanet with much greater ease into the future as well as the enhancement of the understanding of the nature of flares, as well as potentially serving as a model for the study of other larger stellar entities under which relationship might be harder to measure.
Acknowledgement
Thanks to Catherine for chiefly studying and examining various sources of literature and being the contributor of the methodology section, including selecting the various codes utilized within this research, the process of cross-referencing through the Doppler Method, and assisting everyone within the cyber front.
Thanks to Bridget for being the Team's primary analyzer of the data helping greatly to explain the various graphs, not to mention analyzing the graphs themselves, and potential disturbance to the data and coming up with, especially her extra search into the TESS mission's mechanical function, allowing us to explain the potential pitfalls of our research further.
Thanks to Thomas Wu for being the Team's primary writer regarding the development of the thesis, introduction, goals, and abstract proportion of this paper.
Thanks to Rong Tao Wu for writing the Team's conclusion, potential issues faced, the theoretical utility of the Team's discovery, and the Bibliography alongside the contribution, not to
mention his editing of the entire piece, setting the strategic layout, and helping coordinate the research.
Furthermore, every team member checked around 100 lines of data, engaged in various troubleshooting, examined various literature, contributed to each other's ideas, and planned the research alongside the paper; it would have been impossible with even one member missing.
A special Thanks to Professor Joshua N. Winn and Tuo Chen Gong for kindly providing guidance and mentorship during this investigation and research process and providing the necessary background knowledge into red dwarfs and transit for the research to occur.
And to all the giants whose shoulders we stand on since the time of Pythagoras and Beyond.
References
[1]. EDGEWORTH, K. (2021). Red Dwarf Stars. Retrieved 19 November 2021, from Extrasolar Planets. Lasp.colorado.edu. (2021). Retrieved 19 November 2021, from https://lasp.colorado.edu/outerplanets/exoplanets.php.
[2]. ShieldSquare Captcha. Iopscience.iop.org. (2021). Retrieved 19 November 2021, from https://iopscience.iop.org/article/10.1086/309951.
[3]. Sun Fact Sheet. Nssdc.gsfc.nasa.gov. (2021). Retrieved 19 November 2021, from https://nssdc.gsfc.nasa.gov/planetary/factsheet/sunfact.html.
[4]. Earth's sun: Facts about the sun's age, size and history. Space.com. (2021). Retrieved 19 November 2021, from https://www.space.com/58-the-sun-formation-facts-and-characteristics.html.
[5]. VanderPlas, J. T. (2018). Understanding the Lomb–Scargle Periodogram. The Astrophysical Journal Supplement Series, 236(1). https://doi.org/10.3847/1538-4365/aab766.
[6]. Kovács, G., Zucker, S., & Mazeh, T. (2002). A box-fitting algorithm in the search for periodic transits. Astronomy & Astrophysics, 391(1), 369-377. https://doi.org/10.1051/0004-6361:20020802.
[7]. Barclay, T. (2021). TESS. TESS. Retrieved 18 November 2021, from https://heasarc.gsfc.nasa.gov/docs/tess/.
[8]. NASA Exoplanet Archive. Exoplanetarchive.ipac.caltech.edu. (2021). Retrieved 18 November 2021, from https://exoplanetarchive.ipac.caltech.edu.
[9]. Winters, J., Charbonneau, D., Henry, T., Irwin, J., Jao, W., Riedel, A., & Slatten, K. (2021). The Volume-complete Sample of M Dwarfs with masses 0.1 ≤ M/M ⊙ ≤ 0.3 within 15 Parsecs. The Astronomical Journal, 161(2), 63. https://doi.org/10.3847/1538-3881/abcc74.
[10]. ECG Abnormalities Detection Using Doppler Shift Method. Ieeexplore.ieee.org. (2021). Retrieved 19 November 2021, from https://ieeexplore.ieee.org/document/6783503.
[11]. Route, M. (2021). The Rise of ROME. I. A Multiwavelength Analysis of the Star–Planet Interaction in the HD 189733 System. Retrieved 18 November 2021.
Cite this article
Ying,H.;Wu,R.;Li,H.;Wu,G. (2023). Searching Transits Around Red Dwarfs. Theoretical and Natural Science,2,81-91.
Data availability
The datasets used and/or analyzed during the current study will be available from the authors upon reasonable request.
Disclaimer/Publisher's Note
The statements, opinions and data contained in all publications are solely those of the individual author(s) and contributor(s) and not of EWA Publishing and/or the editor(s). EWA Publishing and/or the editor(s) disclaim responsibility for any injury to people or property resulting from any ideas, methods, instructions or products referred to in the content.
About volume
Volume title: Proceedings of the International Conference on Computing Innovation and Applied Physics (CONF-CIAP 2022)
© 2024 by the author(s). Licensee EWA Publishing, Oxford, UK. This article is an open access article distributed under the terms and
conditions of the Creative Commons Attribution (CC BY) license. Authors who
publish this series agree to the following terms:
1. Authors retain copyright and grant the series right of first publication with the work simultaneously licensed under a Creative Commons
Attribution License that allows others to share the work with an acknowledgment of the work's authorship and initial publication in this
series.
2. Authors are able to enter into separate, additional contractual arrangements for the non-exclusive distribution of the series's published
version of the work (e.g., post it to an institutional repository or publish it in a book), with an acknowledgment of its initial
publication in this series.
3. Authors are permitted and encouraged to post their work online (e.g., in institutional repositories or on their website) prior to and
during the submission process, as it can lead to productive exchanges, as well as earlier and greater citation of published work (See
Open access policy for details).
References
[1]. EDGEWORTH, K. (2021). Red Dwarf Stars. Retrieved 19 November 2021, from Extrasolar Planets. Lasp.colorado.edu. (2021). Retrieved 19 November 2021, from https://lasp.colorado.edu/outerplanets/exoplanets.php.
[2]. ShieldSquare Captcha. Iopscience.iop.org. (2021). Retrieved 19 November 2021, from https://iopscience.iop.org/article/10.1086/309951.
[3]. Sun Fact Sheet. Nssdc.gsfc.nasa.gov. (2021). Retrieved 19 November 2021, from https://nssdc.gsfc.nasa.gov/planetary/factsheet/sunfact.html.
[4]. Earth's sun: Facts about the sun's age, size and history. Space.com. (2021). Retrieved 19 November 2021, from https://www.space.com/58-the-sun-formation-facts-and-characteristics.html.
[5]. VanderPlas, J. T. (2018). Understanding the Lomb–Scargle Periodogram. The Astrophysical Journal Supplement Series, 236(1). https://doi.org/10.3847/1538-4365/aab766.
[6]. Kovács, G., Zucker, S., & Mazeh, T. (2002). A box-fitting algorithm in the search for periodic transits. Astronomy & Astrophysics, 391(1), 369-377. https://doi.org/10.1051/0004-6361:20020802.
[7]. Barclay, T. (2021). TESS. TESS. Retrieved 18 November 2021, from https://heasarc.gsfc.nasa.gov/docs/tess/.
[8]. NASA Exoplanet Archive. Exoplanetarchive.ipac.caltech.edu. (2021). Retrieved 18 November 2021, from https://exoplanetarchive.ipac.caltech.edu.
[9]. Winters, J., Charbonneau, D., Henry, T., Irwin, J., Jao, W., Riedel, A., & Slatten, K. (2021). The Volume-complete Sample of M Dwarfs with masses 0.1 ≤ M/M ⊙ ≤ 0.3 within 15 Parsecs. The Astronomical Journal, 161(2), 63. https://doi.org/10.3847/1538-3881/abcc74.
[10]. ECG Abnormalities Detection Using Doppler Shift Method. Ieeexplore.ieee.org. (2021). Retrieved 19 November 2021, from https://ieeexplore.ieee.org/document/6783503.
[11]. Route, M. (2021). The Rise of ROME. I. A Multiwavelength Analysis of the Star–Planet Interaction in the HD 189733 System. Retrieved 18 November 2021.