


1. Introduction
1.1. Background on the Scientific Problem
The SARS-CoV-2 virus, causing the COVID-19 pandemic, has greatly affected global health, economies, and daily life since it appeared in late 2019. Being an extremely transmissible and pathogenic virus, SARS-CoV-2 has resulted in public health problems of unprecedented proportions worldwide. Moreover, in regards to facilitating its prevention, its ability to mutate thus leading to new variants on the other hand further complicates efforts aimed at halting its spread. The virus’s genetic material suffers such mutations altering its qualities like being able to be transmitted again and again or changing virulence or even the potentiality for immune escape.
Understanding where SARS-CoV-2 variants are circulating is important for several reasons. One reason is that different variants might have various levels of transmissibility thereby leading to more transmission and outbreaks. In addition, some may cause more severe illness or higher death rates therefore impacting the capacity of healthcare systems to manage and treat COVID-19 cases. Besides this mutant changes can affect immunological evasion by the viruses either from previous infections or vaccinations, hence necessitating vigilance over any alterations that could affect vaccine effectiveness.
There have been several key justifications for monitoring these strains’ dissemination through the population. This is because dissimilar kinds have varying chances for spreading thus making it easier for them to multiply faster as well as expand themselves wider through several networks than others do. Furthermore, specific examples like how severe disease can become or what number of deaths tallies could go up might alter capacity within medical facilities on managing patients suffering from coronavirus sicknesses while making genetically modified organisms stronger so as to cross those barriers posed by immunity after getting vaccinated against a similar infection before.
There has been extensive collaboration across countries with regard to sequencing and tracking SARS-CoV-2 variants globally. For instance, initiatives such as GISAID (Global Initiative on Sharing All Influenza Data) have been essential for sharing such information.
1.2. Importance of Analyzing Variants
There are several reasons why it is important to study the spread and prevalence of SARS-CoV-2 variants over time and space. This understanding will reveal which strains are spreading faster than others and where they have appeared. This data is necessary for predicting subsequent outbreaks as well as implementing targeted containment strategies. For example, if a highly transmissible variant was discovered in one place, the area could prioritize travel restrictions, expand testing, or launch vaccination campaigns to slow its propagation.
The public health policy implications are massive. Some variations that show increased transmission or resistance against neutralizing antibodies may necessitate changes in public health guidelines such as mandatory mask wearing, social distancing protocols and quarantine measures. Tracking variants also contextualizes vaccine development and distribution plans. Emerging types may require vaccines to be redesigned effectively while new varieties may need regular booster shots for immunity retention.
Additionally, pandemic management depends on variant analysis. By understanding the dynamics of variant spread, public health policies can be adapted to address current challenges, and vaccines can be optimized to provide broad and effective protection against the evolving virus.
2. Literature Review and Comparison
2.1. Study 1: Global Distribution of SARS-CoV-2 Variants
Tegally et al. (2021) conducted a comprehensive study of global distribution of SARS-CoV-2 variants based on analysis of genomics data, tracing the emergence and spread of such variants as Alpha, Beta, Gamma and Delta across different continental territories. Findings indicate that variant prevalence has distinct regional patterns owing to factors such as population density, health care delivery capacity and vaccine coverage (Tegally et al., 2021).
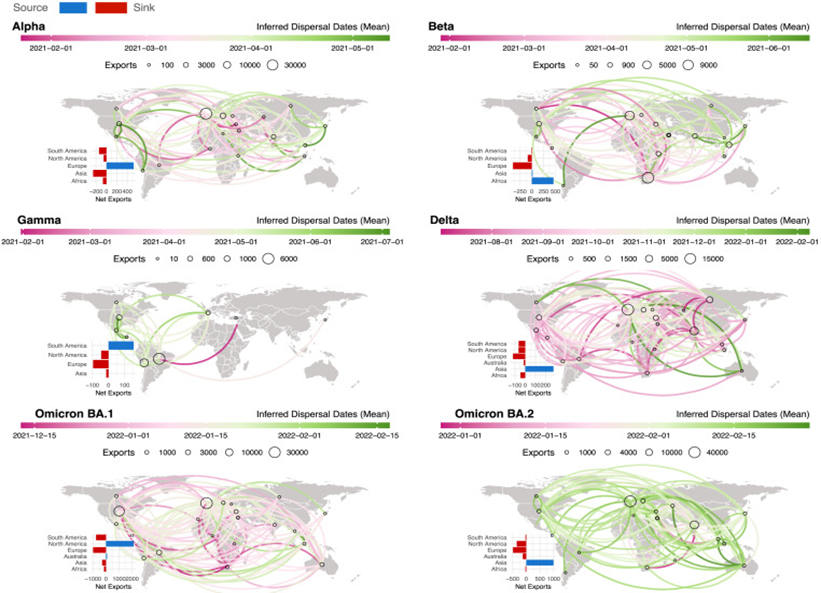
Figure 1. Spatiotemporal dispersal patterns of VOCs
Comparison with Methodology: our project takes an approach similar to Tegally’s et al. in analyzing geographical spread using a dataset that likely combines genetic sequences from different areas. While Tegally et al. employed extensive genomic sequencing data from various countries, our methodology focuses on mapping geographical spread by line plots and heat maps obtained from a specific dataset (covid-variants dataset from GISAID). This comparative study enables one to grasp how various methodologies offer insights into variant distribution patterns differently
Alignment and Differences in Results: Aligning with Tegally et al., our project identifies regional variations in variant prevalence over time. Both studies underscore the importance of regional surveillance and genomic sequencing in tracking the evolution of SARS-CoV-2 variants. However, differences may arise in specific variant distributions due to variations in sample size, sampling methods, and the timeframe of data collection. For instance, while Tegally et al). may provide a broader global perspective, your project’s dataset might offer more localized insights relevant to our specific study dataset.
2.2. Study 2: Temporal Trends in Variant Prevalence
Zhang et al. (2022) investigated the temporal trends regarding the prevalence of SARS-CoV-2 variants over time using a dataset that spanned several months. The investigators used statistical methods to examine changes in variant frequencies with time, as reflected in fluctuations in variant dominance and the occurrence of new variants due to public health interventions and vaccines (Zhang et al., 2022).
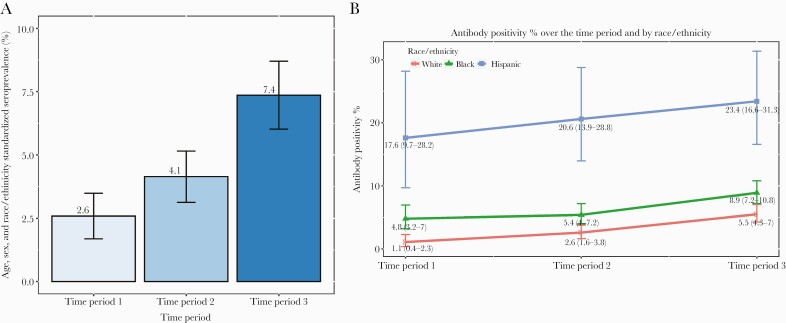
Figure 2. Severe acute respiratory syndrome coronavirus 2 (SARS-CoV-2) seropositivity rate
Comparison with Temporal Trends Visualizations: Line plots are utilized by your project for representing temporal trends within variant prevalence. Just like Zhang et al., these visualizations depict how variant frequencies vary across different points of time while emphasizing high and low points in terms of the number of total circulating variants. By doing this, you can easily determine whether your findings agree with general temporal trends reported in literature or not.
Novel Insights: While Zhang et al. focused on statistical trends, your project provides novel insights by integrating specific geographical and dataset-specific factors into the analysis. For example, your study might uncover unique local patterns in variant dynamics that are not fully captured in broader temporal analyses. This localized perspective enhances understanding of how regional factors influence variant spread and persistence over time.
2.3. Study 3: Impact of Variants on Transmission Dynamics
Recent studies have highlighted how SARS-CoV-2 variants impact transmission dynamics, influencing factors such as transmissibility, severity of illness, and immune evasion mechanisms (Smith et al., 2023). Variants like Delta and Omicron have demonstrated increased transmissibility compared to earlier strains, leading to rapid spread in various populations.
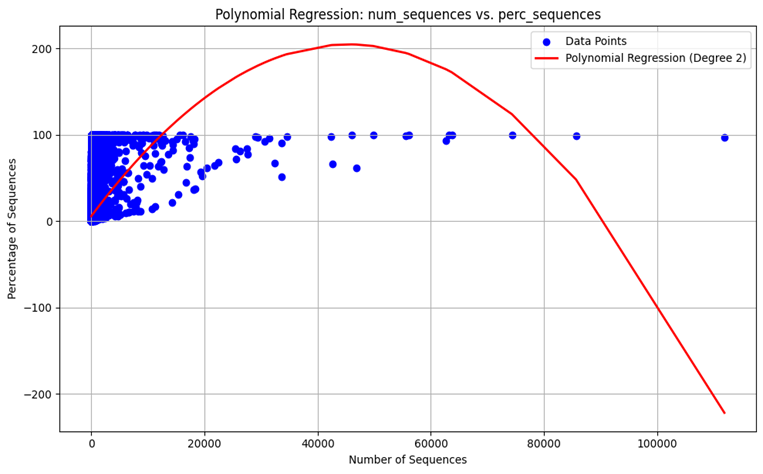
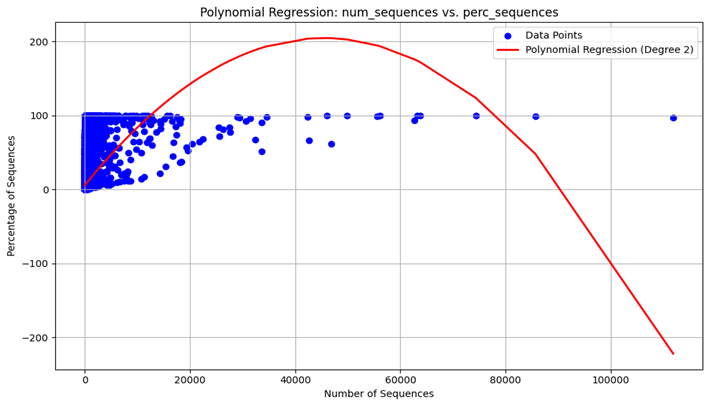
Contribution of Regression Analysis: our regression analysis on num_sequences and perc_sequences provides insights into how variant prevalence, represented by num_sequences, correlates with the percentage of sequences (perc_sequences). By quantifying these relationships, our analysis contributes to understanding how changes in variant prevalence may affect transmission dynamics. This statistical approach complements epidemiological studies by providing quantitative measures of variant impact over time and across different locations.
2.4. Study 4: Effectiveness of Vaccines Against Variants
There have been different degrees of efficiency in studies assessing how effective vaccines are against SARS-CoV-2 variants. A study done by Feng (2022), presented some vaccines to be less efficient against Delta and Beta variants, particularly when it comes to prevention of symptomatic infection and transmission (Baoqi Zeng, 2022). Thus, these findings emphasize the need for continuous monitoring as well as customization of vaccination approaches that will coincide with shifting variant patterns.
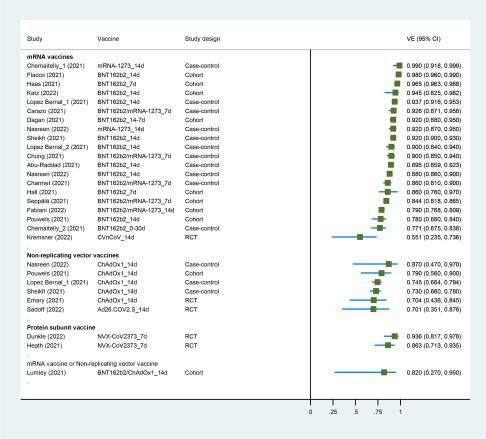
Figure 3. Forest plot showing VE of full vaccination against Alpha variant. Abbreviations: VE, vaccine effectiveness; CI, confidence interval; RCT, randomized controlled trial
Comparison with Variant Prevalence Findings: The results obtained from our data on prevalence of various strains of the virus v can be used for direct comparisons with vaccine efficacy research. Such a project also shows how specific strains become more prominent in certain periods and parts of the world thereby posing problems to vaccine response. Therefore, this comparison is important in discussing if there is a need for booster doses or strain specific vaccines.
2.5. Study 5: Phylogenetic Analysis of SARS-CoV-2 Variants
The evolutionary trails of SARS-CoV-2 variants can be traced by means of conducting phylogenetic analyses which have been very instrumental in showing the genetic relatedness and mutations over time (Yen-Ju Chen, et al., 2023). The genetic sequencing data is used to build evolutionary trees that show clusters and lineage diversification within viral populations.
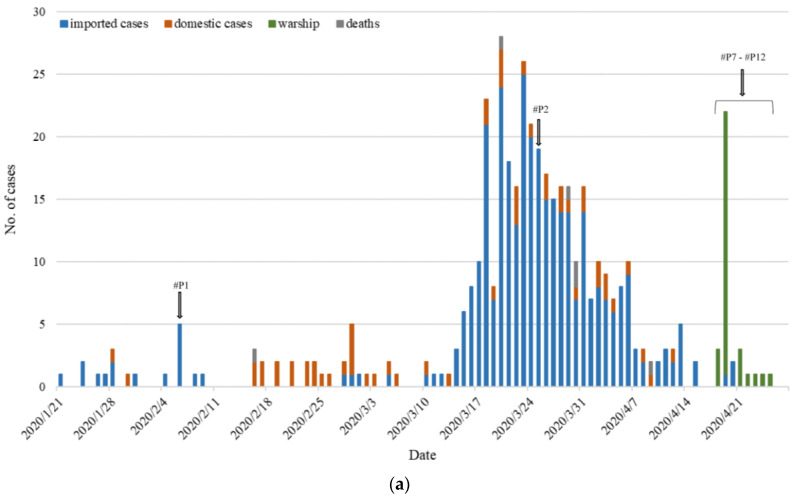
Figure 4. COVID-19 epidemic in Taiwan. (a) At the end of April 2020, 429 Taiwanese people were confirmed to have SARS-CoV-2 infection, and 6 deaths were due to COVID-19. Data sources are available from the Taiwan CDC
Differences and Alignments with EDA Methods: In terms of focus and methodology, data cleaning and exploratory data analysis (EDA) methods differ from phylogenetic approaches. However, we were focusing on numerical trends and visual representation of variant prevalence as well as distribution rather than genealogy or mutation tracking like phylogenetic analysis. Nonetheless, both are aimed at identifying patterns and processes within variant populations albeit through different analytical lenses. Combining insights from the two enriches understanding how observed epidemiological trends relate to genetic evolution
2.6. Study 6: Machine Learning in Predicting Variant Spread
There has been the use of machine learning methods to project the spread and progression of SARS-CoV-2 variants, which involve data-driven models in order to forecast transmission patterns and variant emergence (Retsef Lev, 2023). Such simulated and predicted variant dynamics are based on genomic sequences, epidemiological data and environmental factors.
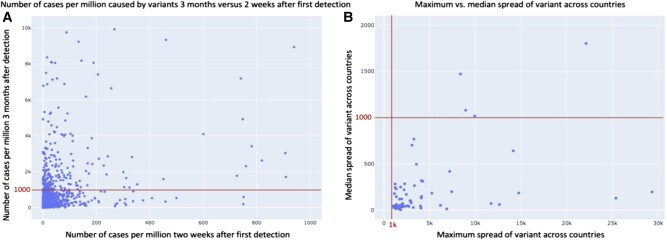
Figure 5. Distribution of infection cases per variant and country.A) Comparison of the number of cases 2 weeks after first detection to 3 months afterwards for all the variants and countries under study. B) Comparison of the maximum and median spread across countries after 3 months of variants that were infectious in at least one country.
Comparison with Linear and Polynomial Regression Models: In terms of complexity as well as predictive scope your application of linear and polynomial regression models differs significantly from machine learning predictive models. Regression models such as ours typically look at historical trends and correlations between variables (num_sequences and perc_sequences) whereas machine learning models often use wider datasets with predictive algorithms that guide predictions regarding future trends or outbreaks. In public health decision-making, examining accuracy and limitations of your regression models compared to machine learning predictions can provide insights into their appropriate short-term versus long-term forecasting concerns
3. Study Setup and Data Collection Methods
Specifically, the research proposed to investigate SARS-CoV-2 variants and their interaction with regard to mutations and transmissibility. The method used consisted of data gathering, data cleaning and preliminary data processing with a purpose to make the data suitable for analysis.
3.1. Data Collection
3.1.1. Source of Data
The first source of data used in this study was obtained from GISAID, an organization that offers open data on the viruses causing flu and the COVID-19 disease. The dataset considered as ‘Covid Variants Across World’ contains important data regarding location, date, name of the variant, number of sequences, the percentage of the sequences, and the total number of sequenced samples.
3.1.2. Dataset Description
The dataset is composed of records of various countries to show a chronology of the emergence of one variant or another. Key columns in the dataset include:
• location: Whether the data was collected at the community or at an individual level.
• date: Date on which record was made.
• variant: Vernacular name of the existing strain of the virus SARS-CoV-2.
• num_sequences: The number of specimens that have been sequenced with the variant present in it.
• perc_sequences: Proportion relating to the variant to the total sequences, that is the number of sequences occupied by the variant.
• num_sequences_total: The entire number of sequences for the mentioned date and place.
3.1.3. Additional Data
Another data set was explored; it had the information about SARS related coronaviruses with the fields being accession number, release date, species, genome length, genotype, geographical location, country, host and collection date. However, this dataset was not included in the final analysis as it did not seem to pertain to the goals of the primary study, which was key SARS-CoV-2 variants.
3.1.4. Data Preprocessing
Data preprocessing involved several steps to ensure the dataset was suitable for analysis: Loading the Dataset: In order to further simplify operating on the dataset, it was loaded into a pandas DataFrame.
Handling Missing Values: The problem of missing values in the analysis was solved to avoid distorting the results of the research. These gaps in the variables num_sequences and perc_sequences were replaced with 0 because gaps mean that the figures are zero or near-zero.
Data Type Conversion: The date column was also recorded so it takes the form of datetime to lend itself for time series analysis.
Data Cleaning: Generally, observations with missing values for the dependent and independent variables applied in regression were deleted.
3.2. Data Quality and Relevance
Ensuring data quality and relevance involved several considerations:
Consistency Checks: The data records were also cleaned for presence of duplication, improper data type and other anomalies that could distort the analysis of the data set.
Normalization: Data normalization was also done depending on the nature of the values that were included in the data sets especially for the purpose of carrying out a regression analysis.
Relevance to Study Objectives: It should be noted that, during the analysis, only necessary columns and records were preserved. Specifically, they were based on num_sequences and perc_sequences as the variables under study correspond directly to the objectives of the work, namely the prevalence of new variants and the effect on the indicators of public health.
Ethical Considerations: Due to the use of human genomic information, proper steps of ethical aspects were included in the data. It should also be noted that the dataset was used according to privacy and data sharing-policy of GISAID.
3.3. Summary of Preprocessing Steps
Loading and Initial Inspection: The data set was read in and became a familiar object in order to get a sense of the data as a data set.
Handling Missing Values: In the case of num_sequences and perc_sequences, which contained missing values, the missing data were replaced to 0.
Converting Date Format: As for the data of the date column, the data was coerced as datetime type.
Dropping Irrelevant Data: Out of these independent variables, if any row had missing value with respect to any of the key columns, the entire row was deleted for performing regression analysis.
4. Exploratory Data Analysis (EDA)
4.1. Analytical Approaches Used
The data analysis for this study involved several key steps: The different techniques that can be applied to solve the problem are Exploratory Data Analysis (EDA), regression analysis and model evaluation. Every phase was oriented to comprehend distribution of SARS-CoV-2 variants and to describe its relation to such parameters as num_sequences and perc_sequences.(MacLachlan NJ, Dubovi EJ, 2017)
4.2. Exploratory Data Analysis (EDA)
Initial Data Exploration: The first process was to import the data into Matlab and carry out some initial exploratory analysis to gather some preliminary insights of the dataset. This consisted of showing the first few rows and evaluating for missing values if any in the data frame. Handling Missing Values: Values for certain important variables (num_sequences, perc_sequences) were left blank, and by keeping consistency, these missing values were replaced with zeros to make the subsequent analyses complete.
Descriptive Statistics: Descriptive statistics were computed to describe the numerical characteristics and distribution of the data.
num_sequences perc_sequences num_sequences_total
count 26016.000000 26016.000000 41837.000000
mean 164.279482 10.401283 1887.644860
std 1783.791872 26.392380 7136.283848
min 0.000000 -0.010000 30.000000
25% 0.000000 0.000000 74.000000
50% 0.000000 0.000000 202.000000
75% 8.000000 1.750000 916.000000
max 111867.000000 100.000000 114942.000000
Figure 1. Descriptive Statistics: Descriptive statistics were computed to describe the numerical characteristics and distribution of the data.
Visualization:
Histogram was utilized to look for trends and patterns, and line plot together with scatter plot was used to potentially look for outliers in the data. For example, on the basis of temporal and spatial patterns, the changing trends of num_sequences and perc_sequences were displayed.
|
|
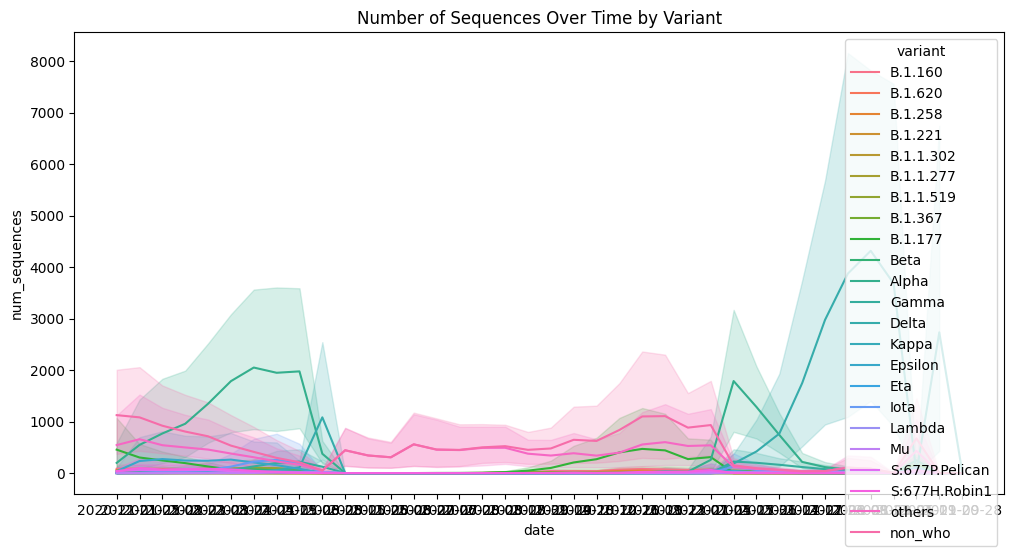
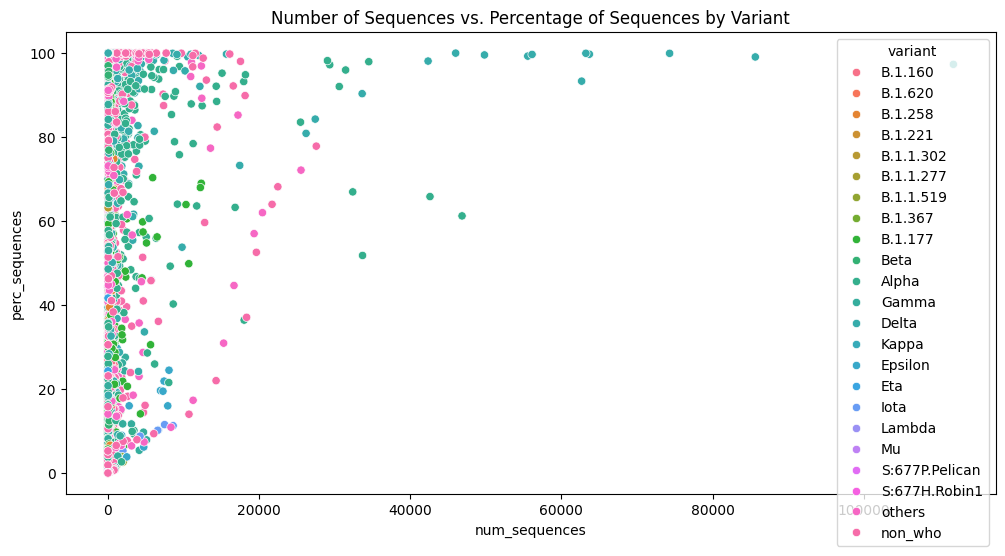
Figure 2. Number of sequences vs. Percentage of Sequences by Variant
Variant Distribution Over Time: Used line plots to depict temporal distribution of SARS-CoV-2 variants. The work addresses cycles in variant composition and distribution, which will help consider the dynamics of variant dominance. | Variant Distribution Across Locations: Explained the distribution of SARS-CoV-2 variants through different geographical areas with the help of a heat map. The visualization helps to study the distribution of variants within the regions, which contributes to understanding the distribution patterns at the international level. |
|
|
Percentage Distribution of Variants: Examined the proportion of SARS-CoV-2 variants out of the total sequences tested. Histograms of variant frequencies with density estimates help to determine the proportion of the variants in the dataset and therefore reveal their distribution. | Total Sequences Over Time: Compared the pattern of the total submitted sequences over time through a line graph. Thus, this analysis gives a general overview of the investigation of sequencing and data resources throughout the observation phase. |
|
|
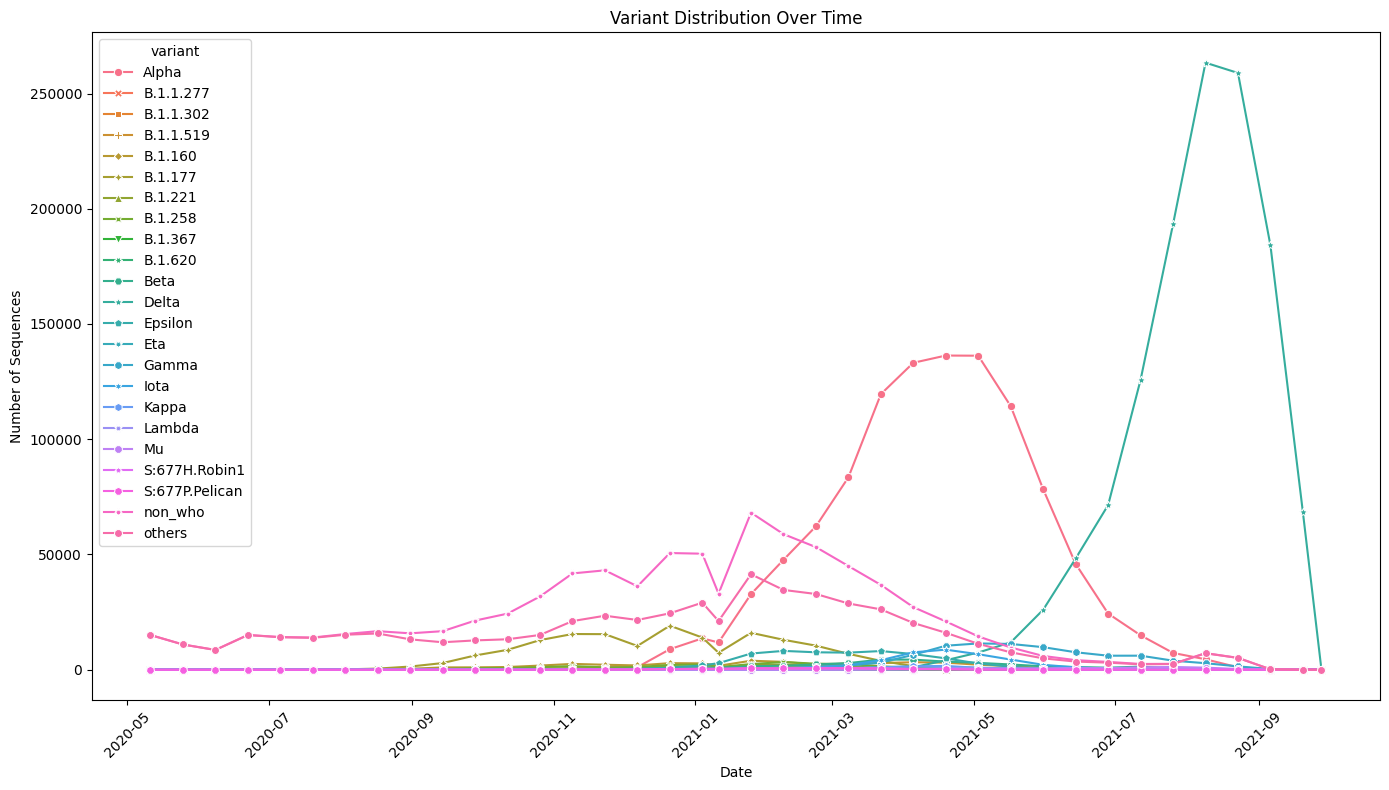
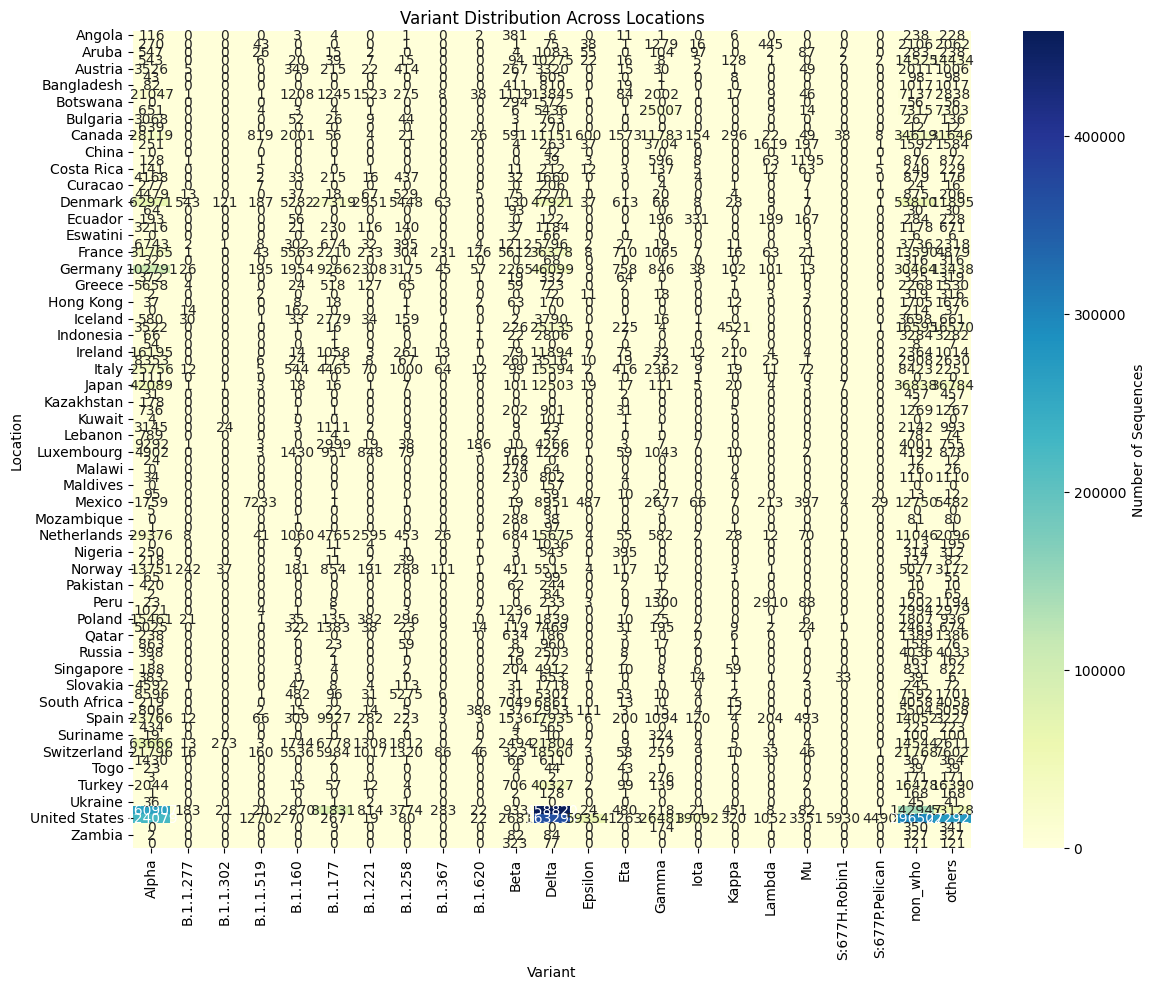
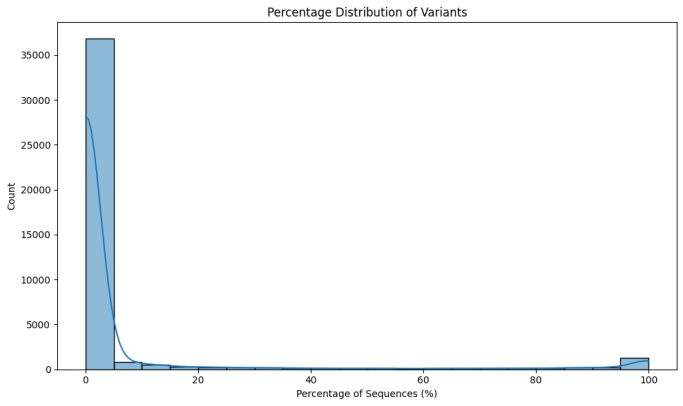
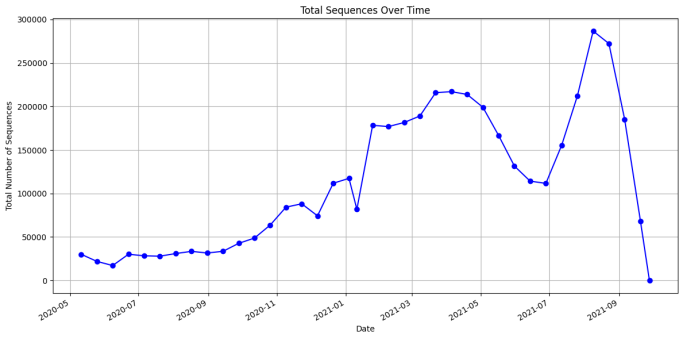
Figure 3. interpret Data Aggregation: Then grouped all the data by date to calculate the number of sequences that were recorded each date. Visualization: Drawn a line chart to represent how the totals of symbols change with time and look for trends or spikes.
Polynomial Regression: Due to the nature of the dynamic changes of the viral mutations and the effects they have, a polynomial regression model was also performed to also account for non-linearity.
Model Evaluation: To assess the efficiency of the linear performance as well as the polynomial one, parameters including MSE and R2 were used. The played metrics are useful in giving a measure of the accuracy and ability of the model to explain the chosen variables.
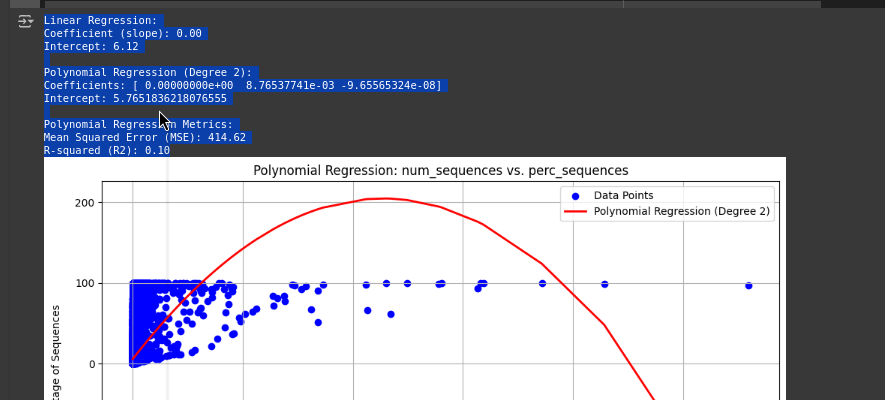
Figure 4. The model output
Rationale for Chosen Methods

References
[1]. Houriiyah Tegally, Eduan Wilkinson, 2021 Dispersal patterns and influence of air travel during the global expansion of SARS-CoV-2 variants of concern https://www.cell.com/cell/fulltext/S0092-8674(23)00641-4?dgcid=raven_jbs_aip_email
[2]. Joshua L Kennedy, Zhang et al. (2022)Temporal Variations in Seroprevalence of Severe Acute Respiratory Syndrome Coronavirus 2 Infections by Race and Ethnicity in Arkansas. https://www.ncbi.nlm.nih.gov/pmc/articles/PMC9045955/
[3]. Yen-Ju Chen, Kuo-Feng Hsu, ( 2023). A Comprehensive Phylogenetic Analysis of SARS-CoV-2: Utilizing a Novel and Convenient In-House RT-PCR Method for Characterization without Virus Culture and BSL-3 Facilities https://www.ncbi.nlm.nih.gov/pmc/articles/PMC10383548/
[4]. Retsef Levi, El Ghali Zerhouni, and Shoshy Altuvia (2023). Predicting the spread of SARS-CoV-2 variants: An artificial intelligence enabled early detection https://www.ncbi.nlm.nih.gov/pmc/articles/PMC10759796/
[5]. Baoqi Zeng, and Feng Sun (2022), , Effectiveness of COVID-19 vaccines against SARS-CoV-2 variants of concern: a systematic review and meta-analysis https://www.ncbi.nlm.nih.gov/pmc/articles/PMC9126103/
[6]. Su S, Wong G, Shi W, Liu J, Lai ACK, Zhou J, et al. Epidemiology, genetic recombination, and pathogenesis of coronaviruses. Trends Microbiol. 2016;24(6):490–502. Article CAS PubMed PubMed Central Google Scholar
[7]. Woo PCY, Lau SKP, Lam CSF, Lau CCY, Tsang AKL, Lau JHN, et al. Discovery of seven novel mammalian and avian coronaviruses in the genus deltacoronavirus supports bat coronaviruses as the gene source of alphacoronavirus and betacoronavirus and avian coronaviruses as the gene source of gammacoronavirus and deltacoronavirus. J Virol. 2012;86(7):3995–4008. Article CAS PubMed PubMed Central Google Scholar
[8]. Cui J, Li F, Shi Z-L. Origin and evolution of pathogenic coronaviruses. Nat Rev Microbiol. 2019;17(3):181–92. Article CAS PubMed Google Scholar
[9]. Lin C-M, Saif LJ, Marthaler D, Wang Q. Evolution, antigenicity and pathogenicity of global porcine epidemic diarrhea virus strains. Virus Res. 2016;226:20–39. Article CAS PubMed PubMed Central Google Scholar
[10]. Zhou P, Fan H, Lan T, Yang X-L, Shi W-F, Zhang W, et al. Fatal swine acute diarrhoea syndrome caused by an HKU2-related coronavirus of bat origin. Nature. 2018;556(7700):255–8. Article CAS PubMed PubMed Central Google Scholar
[11]. MacLachlan NJ, Dubovi EJ. Coronaviridae. In: Maclachlan NJ, Dubovi EJ, editors. Fenner’s veterinary virology. Elsevier; 2017. p. 435–61.
Cite this article
Zhang,J. (2024). Benchmarking Mutation Type of SARS-CoV-2's Different Variants and Their Relationship with Infectiousness. Theoretical and Natural Science,64,226-242.
Data availability
The datasets used and/or analyzed during the current study will be available from the authors upon reasonable request.
Disclaimer/Publisher's Note
The statements, opinions and data contained in all publications are solely those of the individual author(s) and contributor(s) and not of EWA Publishing and/or the editor(s). EWA Publishing and/or the editor(s) disclaim responsibility for any injury to people or property resulting from any ideas, methods, instructions or products referred to in the content.
About volume
Volume title: Proceedings of the 4th International Conference on Biological Engineering and Medical Science
© 2024 by the author(s). Licensee EWA Publishing, Oxford, UK. This article is an open access article distributed under the terms and
conditions of the Creative Commons Attribution (CC BY) license. Authors who
publish this series agree to the following terms:
1. Authors retain copyright and grant the series right of first publication with the work simultaneously licensed under a Creative Commons
Attribution License that allows others to share the work with an acknowledgment of the work's authorship and initial publication in this
series.
2. Authors are able to enter into separate, additional contractual arrangements for the non-exclusive distribution of the series's published
version of the work (e.g., post it to an institutional repository or publish it in a book), with an acknowledgment of its initial
publication in this series.
3. Authors are permitted and encouraged to post their work online (e.g., in institutional repositories or on their website) prior to and
during the submission process, as it can lead to productive exchanges, as well as earlier and greater citation of published work (See
Open access policy for details).
References
[1]. Houriiyah Tegally, Eduan Wilkinson, 2021 Dispersal patterns and influence of air travel during the global expansion of SARS-CoV-2 variants of concern https://www.cell.com/cell/fulltext/S0092-8674(23)00641-4?dgcid=raven_jbs_aip_email
[2]. Joshua L Kennedy, Zhang et al. (2022)Temporal Variations in Seroprevalence of Severe Acute Respiratory Syndrome Coronavirus 2 Infections by Race and Ethnicity in Arkansas. https://www.ncbi.nlm.nih.gov/pmc/articles/PMC9045955/
[3]. Yen-Ju Chen, Kuo-Feng Hsu, ( 2023). A Comprehensive Phylogenetic Analysis of SARS-CoV-2: Utilizing a Novel and Convenient In-House RT-PCR Method for Characterization without Virus Culture and BSL-3 Facilities https://www.ncbi.nlm.nih.gov/pmc/articles/PMC10383548/
[4]. Retsef Levi, El Ghali Zerhouni, and Shoshy Altuvia (2023). Predicting the spread of SARS-CoV-2 variants: An artificial intelligence enabled early detection https://www.ncbi.nlm.nih.gov/pmc/articles/PMC10759796/
[5]. Baoqi Zeng, and Feng Sun (2022), , Effectiveness of COVID-19 vaccines against SARS-CoV-2 variants of concern: a systematic review and meta-analysis https://www.ncbi.nlm.nih.gov/pmc/articles/PMC9126103/
[6]. Su S, Wong G, Shi W, Liu J, Lai ACK, Zhou J, et al. Epidemiology, genetic recombination, and pathogenesis of coronaviruses. Trends Microbiol. 2016;24(6):490–502. Article CAS PubMed PubMed Central Google Scholar
[7]. Woo PCY, Lau SKP, Lam CSF, Lau CCY, Tsang AKL, Lau JHN, et al. Discovery of seven novel mammalian and avian coronaviruses in the genus deltacoronavirus supports bat coronaviruses as the gene source of alphacoronavirus and betacoronavirus and avian coronaviruses as the gene source of gammacoronavirus and deltacoronavirus. J Virol. 2012;86(7):3995–4008. Article CAS PubMed PubMed Central Google Scholar
[8]. Cui J, Li F, Shi Z-L. Origin and evolution of pathogenic coronaviruses. Nat Rev Microbiol. 2019;17(3):181–92. Article CAS PubMed Google Scholar
[9]. Lin C-M, Saif LJ, Marthaler D, Wang Q. Evolution, antigenicity and pathogenicity of global porcine epidemic diarrhea virus strains. Virus Res. 2016;226:20–39. Article CAS PubMed PubMed Central Google Scholar
[10]. Zhou P, Fan H, Lan T, Yang X-L, Shi W-F, Zhang W, et al. Fatal swine acute diarrhoea syndrome caused by an HKU2-related coronavirus of bat origin. Nature. 2018;556(7700):255–8. Article CAS PubMed PubMed Central Google Scholar
[11]. MacLachlan NJ, Dubovi EJ. Coronaviridae. In: Maclachlan NJ, Dubovi EJ, editors. Fenner’s veterinary virology. Elsevier; 2017. p. 435–61.
Cookies are used by this site.
Copyright © 2024 EWA Publishing, its licensors, and contributors. All rights reserved, including text and data mining, AI training, and similar technologies.