


1. Introduction
1.1. Background and Brief Introduction
China has experienced extreme heat wave weather this year. On August 12th, China Meteorological Administration issued this year's first red alert for high temperature (Red alert criteria: in the past 48 hours, 4 or more provinces and regions have seen the highest temperature of 40°C or above continuously and it is expected to continue in the future). In Chinese extreme hot in 2013 and 2017, the national meteorological center just sent high temperature orange alert, as you can see the orange early warning is the highest level under normal circumstances. This time bring out of the closet “red alert”, which fully explain the high temperature has been the breakthrough in the intensity, scope and duration of three indicators. They are moving in the history of the most. From late July to now, the middle and lower reaches of the Yangtze River and southwest China have experienced a wide range of hot weather with strong degree. China have a sustainable development of the high temperature and meteorological drought, from the Sichuan Basin to the middle and lower reaches of the Yangtze River region has been heavier drought, seriously affected people's daily life at ordinary time. There is a surge in demand for air conditioning and a trouble in COVID-19 epidemic prevention work. Epidemic prevention workers wearing protective clothing are hard to resist heat wave and many outdoor grassroots workers suffer from heat stroke. There have been hundreds of overheating deaths in the country since July to mid-August.
On August 13th, Shanghai has kept 40 days of high temperatures above 35°C this year with the highest extreme temperature being 42°C. Since July this year, the average number of high temperature days above 35°C in Zhejiang province has been 31 days and the average number of high temperature days above 38°C in Zhejiang Province has been 16 days. It is the highest in the same period in history. Chongqing has experienced two rounds of high temperature weather, the average number of high temperature days in the city reached 30 days, which is the second most since 1951. The local usual temperature is up to 43°C~44°C and the highest temperature in some districts may exceed the historical extreme value. In spring and winter, the temperature gradually rose and the southern region generally stayed about 20°C or even 30°C. Water levels in the main stream of the Yangtze River, Dongting and Poyang lakes were the lowest on record for the same period, according to the reports on August 13th from China's Ministry of Water Resources. The drought has affected 9.67 million mu of arable land in Anhui, Jiangxi, Hubei, Hunan, Chongqing and Sichuan Province, which also affected water supplies for 830,000 people. The extreme high temperature in China since July is undoubtedly related to the abnormal subtropical high. It has interrupted the southwest monsoon and crushed almost all typhoons. From typhoon Ali (No. 4) to Mirey (No. 8) were all supported by extremely high ocean heat, but without exception, they all had difficulties in developing. They suffered a comprehensive defeat in the confrontation with subtropical high. Mirei, the newly generated No. 8 typhoon, made a difficult landfall in Japan, passing over Tokyo and ending with a squiggle. It posed no threat and certainly no relief to the high temperature in China. The regional heat wave is forecast to last longer than 62 days in 2013, making it the longest since 1961. Above all, the extreme high temperature in China has seriously destroyed the ecological environment and exerted a detrimental effect on our society severely.
The Sixth Assessment report of IPCC (United Nations Intergovernmental Panel on Climate Change) pointed out that under the background of global warming and greenhouse effect, many extreme weather and climate events had been observed since the middle of the 20th century, among which the frequent occurrence of high temperature and heat wave was a very significant feature. High temperature and heat wave events will become a new normal. It is expected the similar condition will occur more frequently in the future. The characteristic of long duration of high temperature may become more and more obvious.
Above all, we have a research on temperature change rules in some major cities (Shanghai, Guangzhou and Beijing) in China from 2015 to 2020. We collect and obverse several temperature data of Beijing, Shanghai and Guangzhou to see if there are upward trends in temperature. We attempt to understand how temperatures have changed over time in these cities in China and how these trends can help forecast future temperatures. Initially, the study can make people pay more attention to climate warming. Simultaneously, they can know the temperature basic change rules and ready to prevent the extreme high temperature weather in time. Besides, it may also play a crucial role in reducing the number of people suffering from heat stroke. Additionally, it reminds the national government to make relevant control policy of high temperature weather system and everyone to take action to protect our planet more actively.
1.2. Literature Review
Xue WU from weather bureau of XinYang wrote a paper about the effect of urbanization in the weather of four different city in China [1]. She used analysis of meteorological data, urban and suburban comparison method and correlation coefficient weight analysis to compare and summarize from groups of data between 1980 and 2009, including the annual average temperature, diurnal mean annual temperature, the highest temperature and the lowest temperature in each year. Urbanization has obvious warming effect on the city. In the decadal comparison, urbanization in the 1990s had the most significant effect on temperature.
Min WANG, Yuhua LIANG and Gang ZHI from Jilin Normal University wrote a paper about the annual average temperature of 9 different main drainage basin in China over the 15-year period after 2001, including southeastern rivers, the Haihe River, the Huaihe River, the Yellow River, continental river, the SongLiao river, the Yangtze River, the Pearl River and southwest rivers [2].
XiaoDi GAO, Zhihong JIANG and Jinhu YANG from Nanjing University of Information Science and Technology wrote a paper about the annual mean temperature in three different time period (1961-1990, 2021-2050 and 2071-2097) in the case of global warming [3]. They collected and summerized the main temperature change from 1961 to 1990 and they also estimated the temperature in the future.
Yangming JIANG, Weihong CUI, Qianlin DONG and Guangxiong PENG from Institute of Remote Sensing Applications, Chinese Academy of Science and China University of Mining and Technology wrote a paper by using MODIS data to reflect the temperature and its spatial distribution characteristics in China in the past 10 years are retrieved [4]. Basing on the meteorological data, the time series of winter temperature anomalies in urban, suburban, rural areas and around meteorological stations in China in the past 60 years are reconstructed.
Ke LIU, Yinlong XU, Shengcai TAO, Jie PAN and Honglong YANG Institute of Agricultural Environment and Sustainable Development, Chinese Academy of Agricultural Sciences; Key Laboratory of Agricultural Environment and Climate Change, Ministry of Agriculture; College of Atmospheric Sciences, Lanzhou University wrote a paper by using simulation effect of model unequal weight set, model equal weight set andmulti-model set on China temperature and forecast of China temperature change in the next 30 years [5].
Quansheng GE, Shunbing WANG and Jingyun ZHENG from Institute of Geographic Sciences and Resources Research, Chineese Academy of Science wrote a paper about the sequence reconstruction of temperature changes in China over the past 5000 years by using an ensemble method which was used to reconstruct the past air temperature series of China within past 5000 years [6].
Cuihua HAN, Zhixin HAO, Jingyun ZHENG from Institute of Geographic Sciences and Resources Research, Chinese Academy of Science wrote a paper about average temerature changes in China and characteristics of temperature change in difference regions of China between 1951 and 2010 [7]. They disscussed the characteristics of temperature changes in four periods of 1951-1980, 1961-1990, 1971-2000 and 1981-2010, which were divided into different regions as of annual winter and summer, 8 regions with different annual winter and summer temperature variations and 7 regions with different winter temperature variations. The seasonal and decadal differences of the results were discussed.
Jinsong WANG, Fahu CHEN, Qiang ZHANG, Liya JIN, Jing Li, Ming JIN and Jianhui CHEN from China meteorological administration, Lanzhou Institute of Arid Meteorology, Key Laboratory of Arid Climate Change and Disaster Reduction of Gansu Province, Key Open Laboratory of Arid Climate Change and Disaster Reduction of China Meteorological Administration, Sino-German Research Center for Arid Environment of Western China Key Laboratory of Environment and Ministry of Education in Lanzhoup wrote a paper about the temperature changes in different regions in Asia in recent 100 years, including arid area and semi-arid area of central Asia, by using an EOF interpolation method [8].
Mingli ZHANG, Zhaomei ZENG and Jinjun JI from Institute of Atmospheric Physics, Chinese Academy of Science wrote a paper about the characteristcs of regional climate in eastern Asia during the 100-year period [9].
Weihong QIAN and Bo LU from Department of Atmospheric Science, Peking University wrote a paper decomposing the trend of temperature change in different time periods and the multi-time scale periodic changes in the whole time domain, discussing the causes of temperature periodic changes [10]. It based on the newly reconstructed millennium global temperature series, solar radiation series and North Pacific SST index series in the last 400 years.
James Hansen, Makiko Sato, Reto Ruedy, Ken Lo, David W. Lea and Martin Medina-Elizade from National Aeronautics and Space Administration Goddard Institute for Space Studies, Columbia University Earth Institute and University of California wrote a paper about the temperature change all over the world [11].
Ye LI, Eric J. Johnson and Lisa Zaval from the Center for Decision Sciences and Psychology Department, Columbia University wrote an article about the temperature change everyday in the case of global warming [12].
M. James C. Crabbe from Luton Institute for Research in the Applied Natural Sciences wrote a paper about the climate change in case of global warming (analysis of coral reefs) by considering the modelling the effects of temperature [13].
2. Data Sorting and Analysis
2.1. Dataset and Materials
The data of the research are derived from CEIdata and Kaggle which are official website so that we can achieve reliable results and attain feasible graphs. The data embodies overall 6573 figures. All the data were gained through professional experiment procedures.
2.2. Data Processing and Method
The program for this research was written and afterwards displayed in the Microsoft Excel software as well as Anaconda Jupyter Notebook – Python programming software. In the latter program, it gives out the results: OLS Regressive Table, the scattering diagram including the linear fitting charts, the F-statistic, the R2 value (coefficient of determination) and so on. Besides, linear regression model is mainly used as a method to accomplish the research. Through these details which are analyzed and roughly shown in following figures, obtain some conclusions of the research can be gained obviously.
2.3. Data Recordings and Analysis
|

|
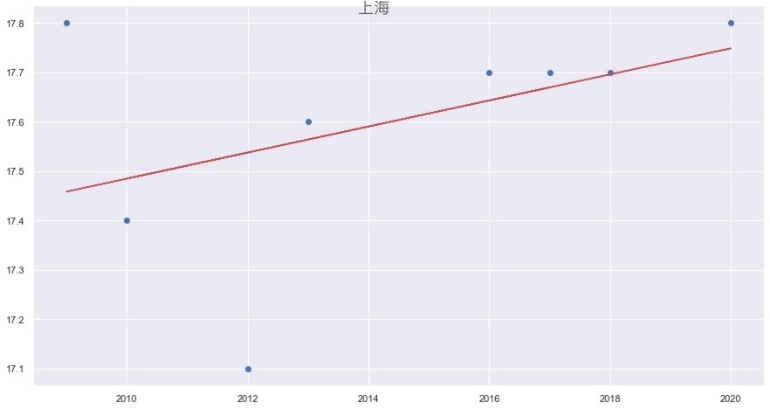
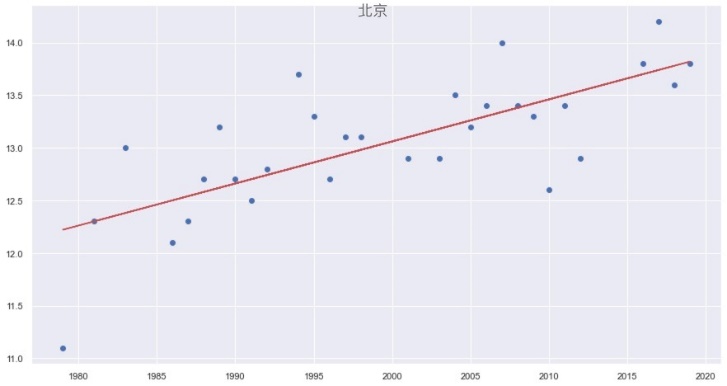
Figure 1, 2 & 3. Linear fittings of partial annual average temperature of Beijing, Shanghai and Guangzhou in China respectively. For the tendency of Beijing’s and Shanghai’s temperature, they both show positive correlation to years, while Guangzhou relatively witnesses a downward trend these years. |
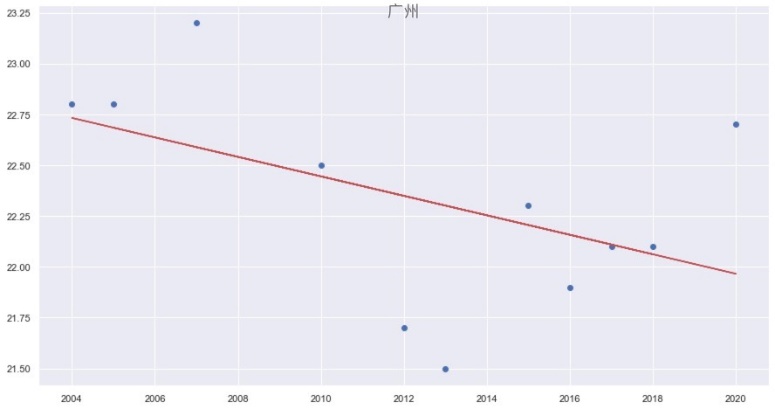
However, the three graphs do not completely prove the future conditions. They are just prospective predictions of these cities’ temperature strike for the next few years and can forecast surrounding districts’ probable temperature change trends as references. Maybe, in 2050 or 2100, Beijing’s temperature would decrease or Guangzhou’s temperature would increase.
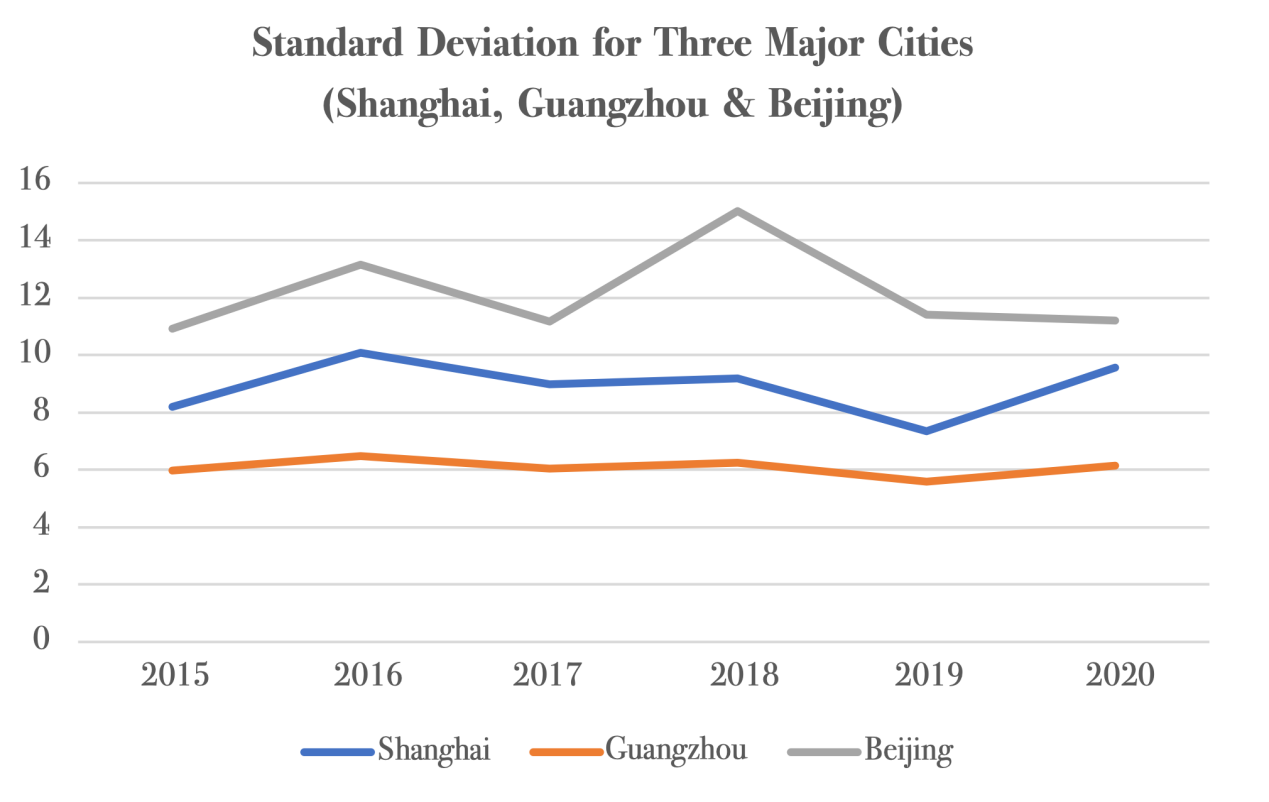
After attaining the diagram of temperature trends shown as Figure 1 ~ 3, we found the standard deviations of temperature, for Shanghai, Guangzhou and Beijing metropolises, shown in Figure 4.
Standard deviation, calculated as the arithmetic square root of what is called the variance and denoted as SD or σ (sigma), is a measure used to quantify the amount of dispersion degree of a set of data values.
According to the broken line chart, it is obvious for us to observe the standard deviation, or what is called SD. The SD of Guangzhou is the least, whereas the SD of Beijing is the highest. Besides, Shanghai stays at the middle. The higher the standard deviation, the higher dispersion degree will be; also, the temperature will become more unstable and its span may be larger. Take Guangzhou as an example, since the SD fluctuated between approximately 5 and 7, its dispersion degree is the lowest; and hence the temperature span narrows – in other words, the temperature difference in a year in Guangzhou is little. Likewise, the temperature difference in a year in Shanghai is in the middle and the difference in Beijing is the largest. It can be found that the temperature difference in a year in the northern cities is less than the southern cities.
|
Figure 4. The change of standard deviation of yearly average temperature in Shanghai, Guangzhou and Beijing through the 6-year period (2015-2020). |
|
Figure 5. The Python sample codes (from Jupyter Notebook) and the functions used to generate an OLS Regression Results table. |
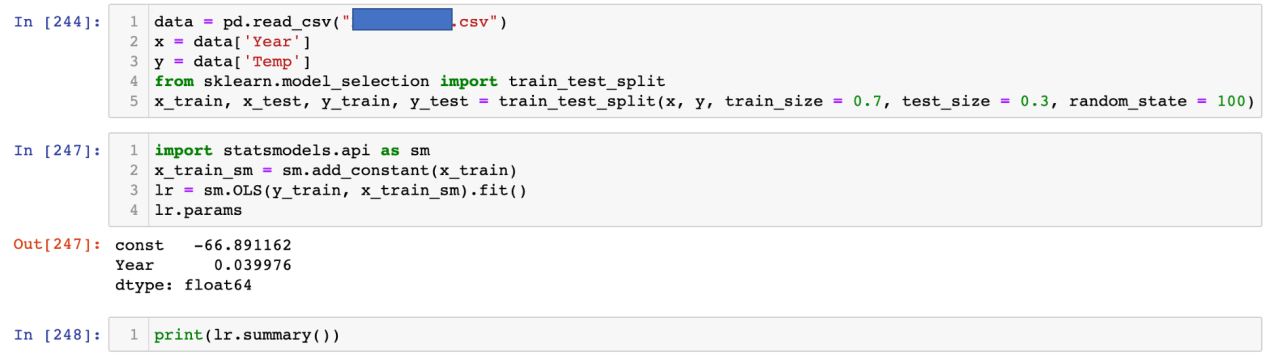
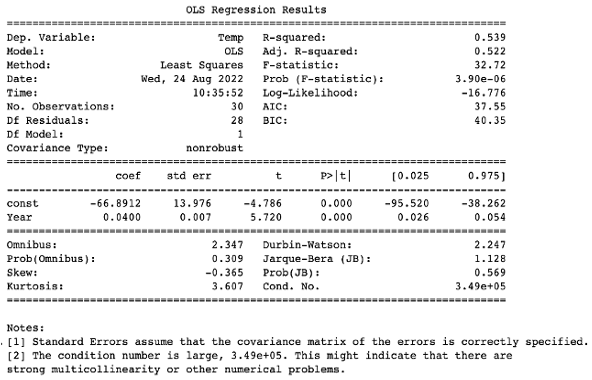
Getting the idea of the altering patterns, tables called the OLS Regression Results are reformed. By means of importing the *.csv file to the Anaconda Jupyter Notebook and utilizing caller function as shown in Figure 5, y is corresponded as dependent variable and x is called as independent variable, and use code known as lr.params to obtain a table sample, as shown in Figure 6.
According to Figure 5, one of the codes, lr.summary() is used to print out the tables. Between the second rectangular block and the third rectangular block, the quantities “const” and “Year” actually matches with the linear equation y = mx + c. In the equation. “const” matches with the y-intercept, ‘c’, and “Year” matches with the gradient, ‘m’. So through Figure 5, we can know the linear regression equation is y = 0.039976x - 66.89.We can recognize the line must be in an upward trend through the number 0.039976 influencing the independent variable due to the fact that it is more than 0.
|
Figure 6. The OLS table of Beijing’s yearly temperature on average, 2015-2020, generated by Python, showing the statistical details like R-squared (R2), number of observation, F-statistic and so forth. |
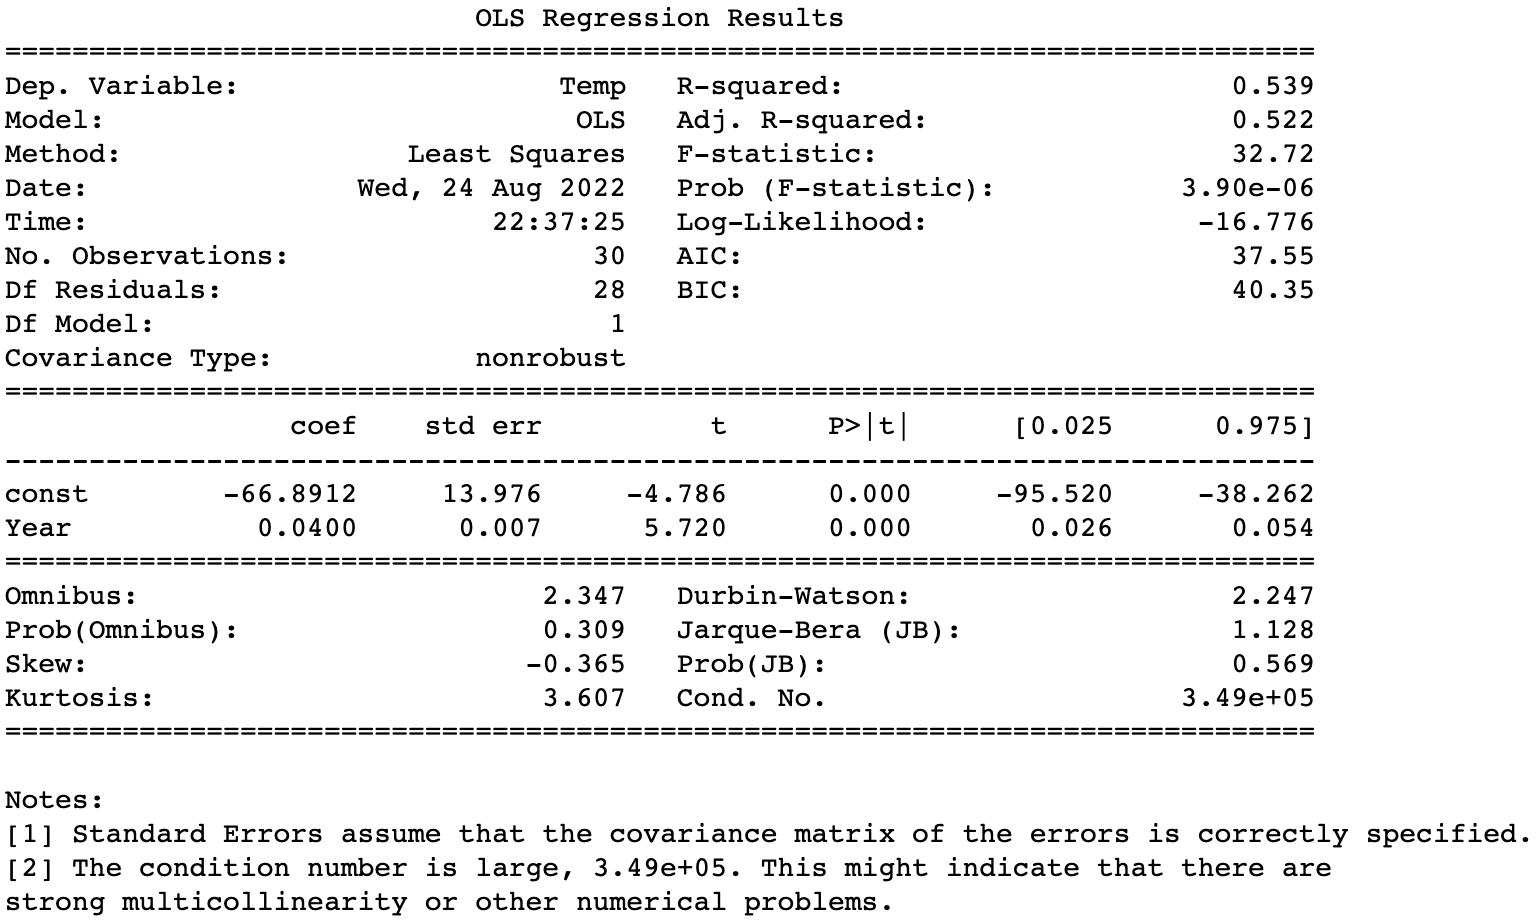
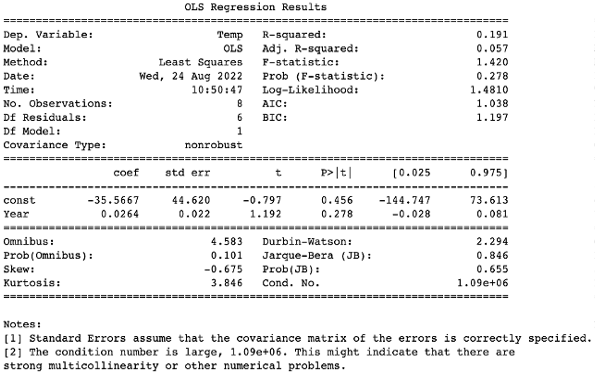
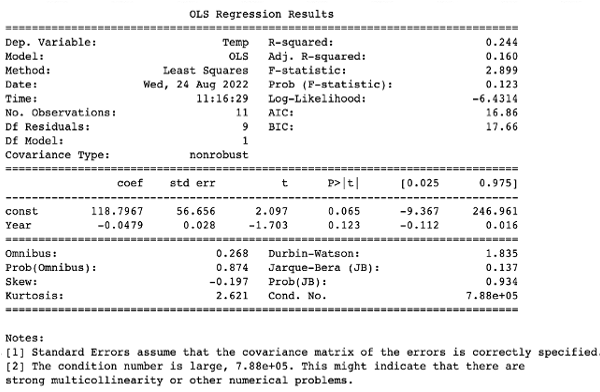
According to Figure 6, it shows the statistical results of the relationship between the dependent and independent variables. R-squared (R2, scientific name: coefficient of determination), defined as a statistical measure indicating the extent of variation in a dependent variable owing to an independent variable, is used to judge whether a group of data can fit linearly or not. If it is greater than 0.5 or very close to 1, then the data are proved to be suitable to fit; else if it is much less than 0.5 or pretty close to 0, then the dataset is unable to be fit linearly. Taking an instance of the average yearly temperature of three major cities, as shown in Figure 7 ~ 9, the data for them can used to achieve Linear Fitting, for the reason that their R-squared values are greater than 0.5. Additionally, in terms of the Prob(F-statistic), if it is very close to 0, then its model will be very appropriate – all the F-statistics fundamentally meet the condition.These data fully explain our model analyses are reasonable, feasible and scientific.
|
Figure 7, 8 & 9. Examples of OLS Regression Table generated by using yearly average temperature of Shanghai, Beijing and Guangzhou respectively, with all types of statistical outcomes, like R-squared, F-statistic, etc. |
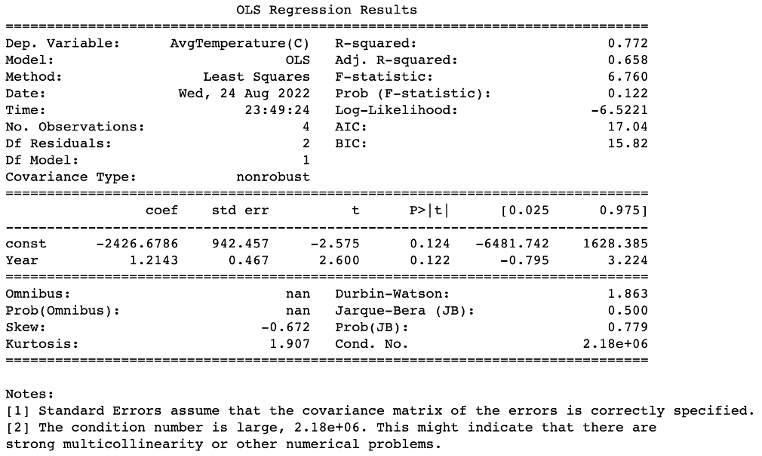
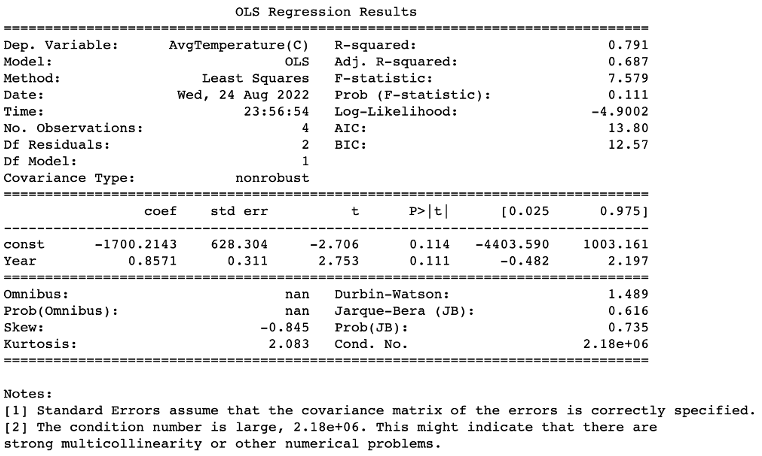
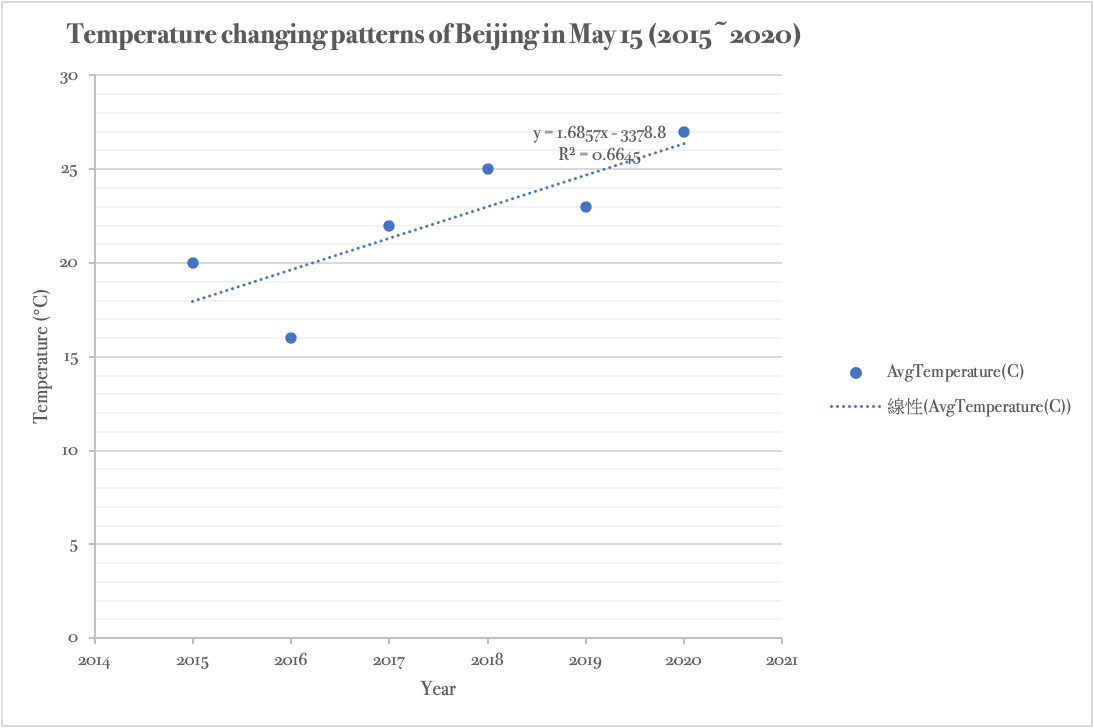
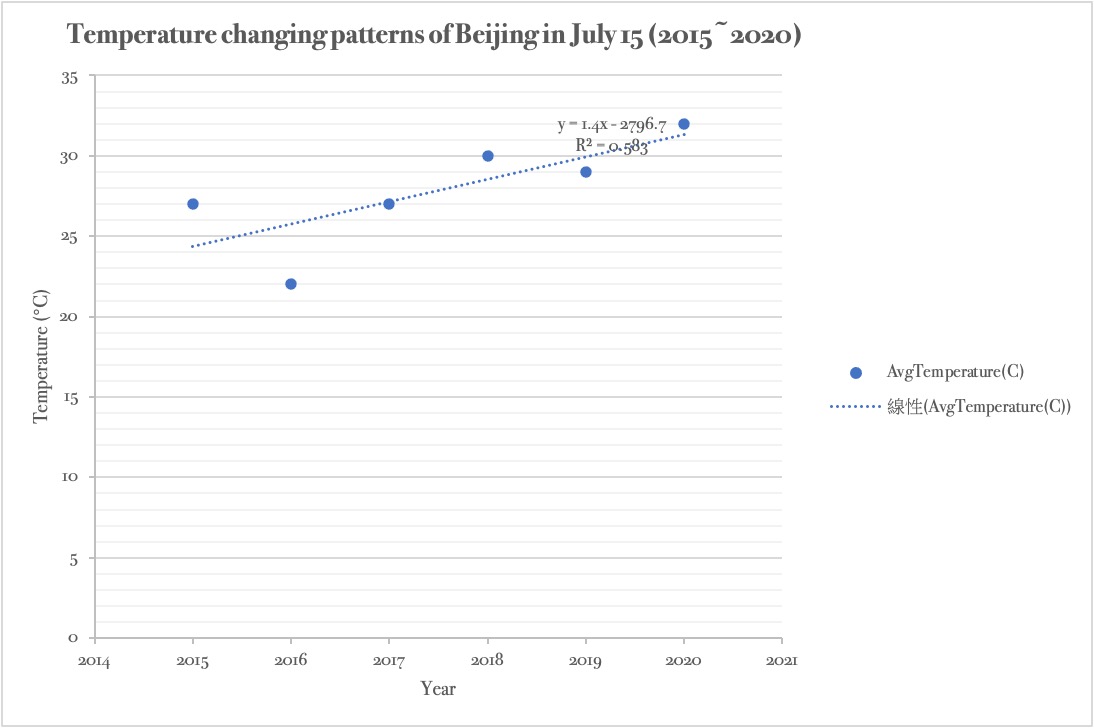
Since Beijing is the best city whose dataset can be used to achieve linear fitting, we analyzed some of the months with only the temperature of 15th day and make OLS tables and line charts. May and July from Beijing’s data from 2015 to 2020 are chosen because their qualities of linear fitting are relatively good(Standard deviations are more than 0.5), and the outcomes are witnessed in Figure 10, 11, 12 and 13.
|
Figure 10. Outcomes of OLS Regression Table generated through the data of May in Beijing (2015~2020). |
|
Figure 11. Outcomes of OLS Regression Table generated through the data of July in Beijing (2015~2020). |
|
Figure 12. The changing trend of Beijing’s temperature in May (2015~2020). |
|
Figure 13. The changing trend of Beijing’s temperature in July (2015~2020). |
3. Conclusion
According to these diagrams and linear equation, the gradient of Guangzhou’s annual temperature changing is less than 0, it shows a downward trend; and the gradients of Shanghai and Beijing are more than 0, the lines witness upward tendency. Therefore, in conclusion, Beijing and Shanghai’s temperatures are rising while Guangzhou’s temperature is falling gradually in recent years. Simultaneously, Beijing and Shanghai’s temperatures are extrapolated to grow in the next few years. However, Guangzhou’s temperature is projected to drop.
Nevertheless, our data of Guangzhou’s and Shanghai’s temperature are too few and incomplete to make more accurate conclusions. Briefly, they includes some subjective assumes which make the conclusions of Guangzhou’s and Shanghai’s temperature more unbelievable and unscientific. Moreover, the method and model used in the research are single and a little unreasonable. In the future research, more relevant data will be dug and related methods will be used like time-series approach as well as multiple curve regression. It is believed that the research would be much better.
References
[1]. GE Qiansheng, WANG Shunbing and ZHENG Jingyun 2006 Sequence reconstruction of temperature changes in China over the past 5000 years Progress in Natural Science 2006(06) p689-696 (in Chinese)
[2]. GAO XiaoDi, JIANG Zhihong and YANG Jinhu 2009 Future changes of air temperature division in China under global warming Journal of Meteorology and Environment 25(05) p1-6 (in Chinese)
[3]. HAN Cuihua, HAO Zhixin and ZHENG Jingyun 2013 Regionalization of temperature changes in China and characteristics of temperature in different regions during 1951-2010 Progress in Geography 32(6) p887-896. (in Chinese)
[4]. James H, Makiko S, Reto R, Ken L, David W L and Martin M E 2006 Global temperature change www.pnas.org/cgi/doi/10.1073/pnas.0606291103
[5]. JIANG Yangming, CUI Weihong, DONG Qianlin and PENG Guangxiong 2010 Study on the 60-year's temperature variation in China on multiple time scales Ecology and Environmental Science 19(09) p2017-2022. doi:10.16258/j.cnki.1674-5906.2010.09.001. (in Chinese)
[6]. LIU Ke, XU Yinlong, TAO Shengcai, PAN Jie and YANG Honglong 2011 Validation of Multi-Model Ensemble to Air Temperature of China and Projection of Air Temperature Change in China for the Next Three Decades Plateau Meteotology 30(02) p363-370. (in Chinese)
[7]. M. James C. Crabbe Climate change, global warming and coral reefs: Modelling the effects of temperature, Computational Biology and Chemistry Volume 32 Issue 5 p311-314, ISSN 1476-9271, https://doi.org/10.1016/j.compbiolchem.2008.04.001.
[8]. Qian Weihong and Lu Bo 2010 Periodic changes in global temperature over the millennia and their causes Chinese Science Bulletin 55(32) p3116-3121. (in Chinese)
[9]. WANG Jinsong, CHEN Fahu, ZHANG Qiang, JIN Liya, LI Jing, JIN Ming and CHEN Jianhui 2008 Temperature Variations in Arid and Semi-Arid Areas in Middle Part of Asia during the Last 100 Years Plateau Meteotology 2008(05) p1035-1045. (in Chinese)
[10]. WANG Min, LIANG Yuhua and Zhi Gang 2016 Research on temperature trend of nine River basins in China in recent 15 years Green Environment Protection Building Materials 2016(12) p230-231. doi:10.16767/j.cnki.10-1213/tu.2016.12.203. (in Chinese)
[11]. WU Xue 2019 Analysis of Urbanization on Temperature Change--Taking Beijing, Zhengzhou, Nanjing and Hangzhou as examples Meteorology Journal of Inner Mongolia 2019(03) p42-45.doi:10.14174/j.cnki.nmqx.2019.03.010. (in Chinese)
[12]. Ye Li, Eric J. Johnson and Lisa Zaval 2011 Local Warming: Daily Temperature Change Influences Belief in Global Warming Psychological science 22(4) p454-459, https://doi.org/10.1177/0956797611400913
[13]. ZHANG Mingli, ZENG Zhaomei and JI Jingjun 1996 Characters of Regional Temperature in East Asia During Global Warming Period Acta Geographica Sinica 1996(06) p518-526. (in Chinese)
Cite this article
Tang,J.;Zhang,S.;Zhao,M. (2023). Research on Temperature Changing Rules of Some Major Cities (Shanghai, Guangzhou and Beijing) in China from 2015 to 2020. Theoretical and Natural Science,5,144-155.
Data availability
The datasets used and/or analyzed during the current study will be available from the authors upon reasonable request.
Disclaimer/Publisher's Note
The statements, opinions and data contained in all publications are solely those of the individual author(s) and contributor(s) and not of EWA Publishing and/or the editor(s). EWA Publishing and/or the editor(s) disclaim responsibility for any injury to people or property resulting from any ideas, methods, instructions or products referred to in the content.
About volume
Volume title: Proceedings of the 2nd International Conference on Computing Innovation and Applied Physics (CONF-CIAP 2023)
© 2024 by the author(s). Licensee EWA Publishing, Oxford, UK. This article is an open access article distributed under the terms and
conditions of the Creative Commons Attribution (CC BY) license. Authors who
publish this series agree to the following terms:
1. Authors retain copyright and grant the series right of first publication with the work simultaneously licensed under a Creative Commons
Attribution License that allows others to share the work with an acknowledgment of the work's authorship and initial publication in this
series.
2. Authors are able to enter into separate, additional contractual arrangements for the non-exclusive distribution of the series's published
version of the work (e.g., post it to an institutional repository or publish it in a book), with an acknowledgment of its initial
publication in this series.
3. Authors are permitted and encouraged to post their work online (e.g., in institutional repositories or on their website) prior to and
during the submission process, as it can lead to productive exchanges, as well as earlier and greater citation of published work (See
Open access policy for details).
References
[1]. GE Qiansheng, WANG Shunbing and ZHENG Jingyun 2006 Sequence reconstruction of temperature changes in China over the past 5000 years Progress in Natural Science 2006(06) p689-696 (in Chinese)
[2]. GAO XiaoDi, JIANG Zhihong and YANG Jinhu 2009 Future changes of air temperature division in China under global warming Journal of Meteorology and Environment 25(05) p1-6 (in Chinese)
[3]. HAN Cuihua, HAO Zhixin and ZHENG Jingyun 2013 Regionalization of temperature changes in China and characteristics of temperature in different regions during 1951-2010 Progress in Geography 32(6) p887-896. (in Chinese)
[4]. James H, Makiko S, Reto R, Ken L, David W L and Martin M E 2006 Global temperature change www.pnas.org/cgi/doi/10.1073/pnas.0606291103
[5]. JIANG Yangming, CUI Weihong, DONG Qianlin and PENG Guangxiong 2010 Study on the 60-year's temperature variation in China on multiple time scales Ecology and Environmental Science 19(09) p2017-2022. doi:10.16258/j.cnki.1674-5906.2010.09.001. (in Chinese)
[6]. LIU Ke, XU Yinlong, TAO Shengcai, PAN Jie and YANG Honglong 2011 Validation of Multi-Model Ensemble to Air Temperature of China and Projection of Air Temperature Change in China for the Next Three Decades Plateau Meteotology 30(02) p363-370. (in Chinese)
[7]. M. James C. Crabbe Climate change, global warming and coral reefs: Modelling the effects of temperature, Computational Biology and Chemistry Volume 32 Issue 5 p311-314, ISSN 1476-9271, https://doi.org/10.1016/j.compbiolchem.2008.04.001.
[8]. Qian Weihong and Lu Bo 2010 Periodic changes in global temperature over the millennia and their causes Chinese Science Bulletin 55(32) p3116-3121. (in Chinese)
[9]. WANG Jinsong, CHEN Fahu, ZHANG Qiang, JIN Liya, LI Jing, JIN Ming and CHEN Jianhui 2008 Temperature Variations in Arid and Semi-Arid Areas in Middle Part of Asia during the Last 100 Years Plateau Meteotology 2008(05) p1035-1045. (in Chinese)
[10]. WANG Min, LIANG Yuhua and Zhi Gang 2016 Research on temperature trend of nine River basins in China in recent 15 years Green Environment Protection Building Materials 2016(12) p230-231. doi:10.16767/j.cnki.10-1213/tu.2016.12.203. (in Chinese)
[11]. WU Xue 2019 Analysis of Urbanization on Temperature Change--Taking Beijing, Zhengzhou, Nanjing and Hangzhou as examples Meteorology Journal of Inner Mongolia 2019(03) p42-45.doi:10.14174/j.cnki.nmqx.2019.03.010. (in Chinese)
[12]. Ye Li, Eric J. Johnson and Lisa Zaval 2011 Local Warming: Daily Temperature Change Influences Belief in Global Warming Psychological science 22(4) p454-459, https://doi.org/10.1177/0956797611400913
[13]. ZHANG Mingli, ZENG Zhaomei and JI Jingjun 1996 Characters of Regional Temperature in East Asia During Global Warming Period Acta Geographica Sinica 1996(06) p518-526. (in Chinese)