


1. Introduction
Infectious diseases fall into three groups according to the Chinese Center for Disease Control and Prevention [1]. Among them are Class A infectious illnesses including plague and cholera; Class B infectious diseases contain 25 types including COVID-19, AIDS, SARS, and neonatal tetanus; and Class C communicable diseases include 11 types including influenza and leprosy, so altogether 39 infectious diseases. It is clear that long-standing hazard to human and animal life has been infectious illnesses. According to incomplete statistics, on average, at least one new infectious disease is discovered every year. Since the 1970s, more than 40 new infectious diseases have been discovered and spread between human and animal populations [2]. Due to the ability of infectious diseases to spread across species and their rapid spread, they have become one of the key issues threatening human life. As early as 1997, the World Health Organization put forward the slogan of "Global Alert, Action to Respond to Emerging Infectious Diseases", calling on countries to pay attention to the threat of infectious diseases and strengthen prevention and control [2]. Apart from endangering lives, infectious diseases can significantly affect the national economy and, in severe forms potentially challenge the basis of the nation. For instance, in the mid-14th century, the Black Death broke out in Europe. After the first case appeared in Mexico, the disease quickly spread throughout Europe, killing nearly a quarter of the European population within three years and causing a devastating blow to the economy and social order. In 2003, the SARS epidemic in China killed 346 people and caused serious damage to the economy.
After experiencing a severe SARS outbreak in 2003, China once again faced a new public health challenge. Chinese officials told the World Health Organization on December 31, 2019, that Wuhan, Hubei Province has a pneumonia of unknown etiology outbreak. 2019-nCoV (COVID-19) is the novel viral strain effectively identified from patients on January 7, 2020 [3]. Early studies showed that most initial cases were related to live animal markets such as the South China Seafood Market, suggesting that the virus may have originated from a zoonotic disease [4], but its specific source remains unclear. Family clusters and infections among medical workers point to the virus being able to spread between people, even if the exact mode of transmission remains unknown. The World Health Organisation once more cautioned on January 21, 2020, that the virus might keep spreading person to person. Most nations worldwide have recorded COVID-19 instances as of April 10, 2020, and exhibit indications that the outbreak may get worse still. With total 81,553 confirmed cases and 3, 339 deaths recorded as of April 10, 2020, the pandemic has affected all 34 administrative areas in China. The Lunar New Year coincided with the epidemic, which resulted in national closures of businesses and education as well as the closing of several cities, therefore affecting China's first quarter economy.
These facts clearly show that every epidemic of an infectious disease causes major death toll as well as financial harm. Reducing the societal impact of infectious diseases requires in-depth research into their transmission mechanisms and pathways. Building models to simulate infectious disease spread helps in understanding epidemic dynamics, predicting trends, and making informed decisions for prevention and control [5]. Therefore, understanding the transmission mechanisms and dynamics of infectious diseases holds significant practical value for enhancing public health initiatives in China. This study also offers valuable insights to support efforts in combating the COVID-19 pandemic.
Since the 20th century, prominent scholars worldwide have made significant strides in researching infectious disease dynamics models. The precision of these models has been much improved by developments in theoretical approaches, which also help to better represent actual epidemic trends and so enable the prevention and control of infectious illnesses. Among these, the "homogeneous population approach" [6] has been widely adopted for its effectiveness in describing disease transmission across various population groups, such as susceptible, infected, latent, and removed categories. Building on this basis, this work uses the dynamic model technique to investigate the transmission dynamics of COVID-19 in China during 2020 in order to suggest focused preventive and protective measures.
Mathematical models have progressively become a useful instrument for investigating the spread mechanism of infectious illnesses since Hammer developed the discrete stochastic model of measles in 1906 [7]. Models have been applied increasingly by academics to explain the infection process. Kermack and McKendrick's SIR model (susceptible-infectious-removed) was forward in 1927 [8] is the most powerful one. Originally, the Black Death and epidemic were investigated using this concept. It creates three groups out of the population: susceptible (S), infected (I), and removed (R), and uses differential equations to characterize the infection dynamics between these groups [9]. And then Aron [10] found that some individuals in the transmission process are latent carriers, and the simple SIR model was insufficient. In 1984, Aron added an exposed (E) compartment, creating the SEIR model. Researchers have since expanded models by adding compartments to reflect various transmission characteristics. For example, during China’s 2003 SARS outbreak, extensive home isolation led Castillo-Chavez [11] to develop the SEQIJR model, where Q represents the quarantined and J represents the isolated and treated individuals. Similarly, in influenza studies, Nuno [12] added early infected (I1), late infected (I2), hospitalized (H), treated (T), and vaccinated (P) compartments to capture influenza transmission more accurately.
Compared to other countries, China began its research on infectious disease dynamics models relatively late due to significant academic setbacks. In theoretical research, notable domestic advances include the SEIRP model developed by Cai Quancai [13] during the 2003 SARS outbreak. Beijing implemented home isolation, prompting the addition of a new compartment (P for quarantined individuals) to the SEIR model, resulting in the SEIRP model. In applied research, scholars [14] used multiple models (SIR, SEIR, SEIHFR) to simulate the Ebola epidemic, concluding that the SEIHFR model, which incorporates hospitalization and burial periods, better reflects the epidemic dynamics. Similarly, Ma Xia [15] applied the discrete SCIRS model to study meningitis in China, concluding that seasonal factors significantly impact the spread and progression of this infectious disease.
Pathogens like bacteria or viruses mutate to adapt to their environment. Experts suggest that the gene sequence of COVID-19 shares 80% similarity with the SARS virus genome from 2003 [16]. The constantly evolving nature of infectious diseases underscores the urgent need to study their transmission mechanisms and pathways. Infectious disease dynamics models are crucial for concretely analyzing transmission processes. However, given the complexity of real-world social environments, accurately modeling infectious disease transmission to obtain reliable parameter estimates remains challenging, a focus of ongoing and future research in infectious disease dynamics.
2. Construction of the improved SEIR model differential equations
2.1. Basic concepts of infectious disease dynamics models
The manner infectious diseases either directly or indirectly are passed on. Related to the whole population, the contact rate is defined as the frequency with which a virus carrier comes into touch with vulnerable people. The effective contact rate is the computation of the virus's infection rate by aggregating the contact rate and the infection rate, therefore determining the rate of transmission to susceptible individuals. Epidemiology includes numerous concepts related to infectious diseases that play crucial roles in constructing infectious disease dynamic models. Understanding these foundational concepts is essential before building relevant models, as they form the basis of the model’s structure. One indispensable concept in studying infectious disease dynamics is the infection rate, which is of particular importance. However, to fully grasp the infection rate, it is first necessary to understand the terms contact rate and effective contact rate. As so, the number of fresh infections produced by sick people I(t) at time t can be stated as:
\( {β_{0}} C(N) \frac{S(t)}{N(t)} I(t) \) (1)
The expression in Equation (1) is typically referred to as the infection rate or disease incidence rate. In current research, there are generally two approaches to designing C(N):
Relatively Small Total Population:
In systems with a smaller population, it is commonly assumed that the contact rate C(N) is directly proportional to the total population, such that C(N)=mN, where m is a constant. This assumption yields the infection rate as follows:
\( {β_{0}} C(N) \frac{S(t)}{N(t)} I(t)={β_{0}} mN(t) \frac{S(t)}{N(t)} I(t)={β_{0}} S(t) I(t) \) (2)
where \( β={β_{0}}m \) , known as the infection rate coefficient. Based on this assumption, the resulting infection rate is often called a bilinear incidence rate.
(ii) Large Total Population N:
Assumed to be proportionate to the total population is the contact rate C(N). N does not correspond to the reality in larger populations. In large population settings, contact between virus carriers and susceptible individuals is limited due to the limited range of movement of carriers. Therefore, the infection rate under these conditions is given by the following formula:
\( {β_{0}} C(N) \frac{S(t)}{N(t)} I(t)=β \frac{S(t)}{N(t)} I(t) \) (3)
More realistic types of effective contact rates have been suggested to better reflect real-world transmission scenarios as the research of infectious disease dynamics keeps deepening. For example, H. Caswell proposed a model that incorporates random factors into the effective contact rate, thereby deriving a disease transmission rate with random factors:
\( {β=β_{0}} C(N) =\frac{aN}{1+bN+\sqrt[]{1+2bN}} \) (4)
In recent years, to capture the complexities observed in the transmission processes of certain infectious diseases, Liu Wei and Hethcote proposed nonlinear infection rates such as IpSq and g(I)S. Moreover, to better align with the real dynamics of infectious disease spread, researchers are increasingly expanding their studies beyond merely designing contact rates.
2.2. The SEIR model
With the continuous deepening of the research on infectious disease dynamics models, the classic SIR model has gradually shown its limitations in simulating actual transmission mechanisms. Aron et al. pointed out that many infectious diseases involve individuals in the exposure (latent) stage, who are not immediately contagious after infection. The SIR model suggested by Kermack et al. does not include this stage, so its application in some illness scenarios is rather straightforward. In order to create the SEIR model, Aron et al. thus devised an exposure stage (E) between the susceptible and the infected populations in 1984. Like the SIR model, the SEIR model breaks out the whole population into four groups: susceptible population (S), exposed population (E), infected population (I), and removed population (R). Every group is characterised as follows: Individuals that are healthy but not immune and easily infected constitute S (susceptible population). E (exposed population) is those who have been infected but are not now contagious. Those who have been infected and can thereby propagate the virus constitute the infected population. R (removed population): individuals who are no longer contagious through recovery or death. Based on this classification, the disease progression in the SEIR model can be expressed as Figure1:
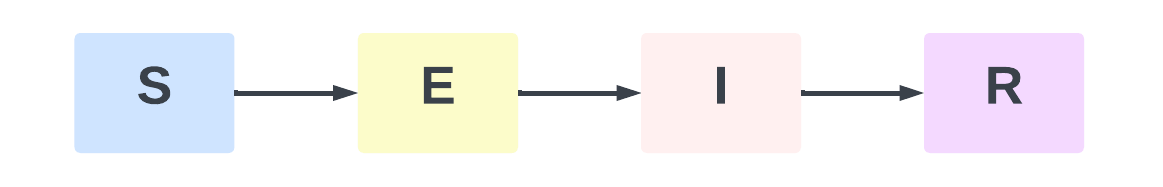
Figure 1: SEIR Model Flow Diagram
Among them, S→E: indicates that the susceptible population (S) is infected because of contact with the infected population (I), enters the incubation period, and becomes the exposed population (E); E→I: indicates that the exposed population (E) is transformed into the infected population (I) with infectious ability after experiencing the average incubation period; I→R: indicates that the infected population (I) dies due to ineffective treatment, or gains immunity after treatment, and is converted into the removed population (R) who is no longer infectious.
2.3. Transmission mechanism of the improved SEIR model
Targeting the features of many infectious diseases, like COVID-19, which are still transmissible during the incubation phase, this work suggests an modified SEIR model. The better model supposes that people in the incubation period infect susceptible populations at a transmission rate of β1, therefore more precisely reflecting the transmission properties of the novel coronavirus. The research population is split by the model into four groups: susceptible population (S), exposed population (E), infected population (I), and removed population (R.). The following presumptions help to define the transformation process from vulnerable population to eliminated population, therefore bringing the model closer to the real state: The quantity of confirmed infected individuals per unit time corresponds to the quantity of current infected individuals. Furthermore proportional to the number of current infected individuals is the number of infected individuals that recover after therapy per unit time. Individuals who gain immunity after recovery are considered to have strong immunity due to the effect of antibodies, so the risk of infection from re-exposure to the virus is extremely low. These recovered individuals are classified as removed populations. Susceptible individuals become latent after contact with infected persons, with no obvious symptoms during the incubation period, but with a certain degree of infectiousness. Infected persons sent to the hospital are considered to be in isolation and cannot effectively contact with susceptible populations, so they do not participate in disease transmission. If an infected person dies because treatment is ineffective, they are included in the removed population along with individuals who have recovered and are immune, representing a population that can no longer spread the disease. Based on these assumptions, the transmission process for individuals from the susceptible group, through the exposed and infected stages, and finally to the removed group is depicted in Figure 2.
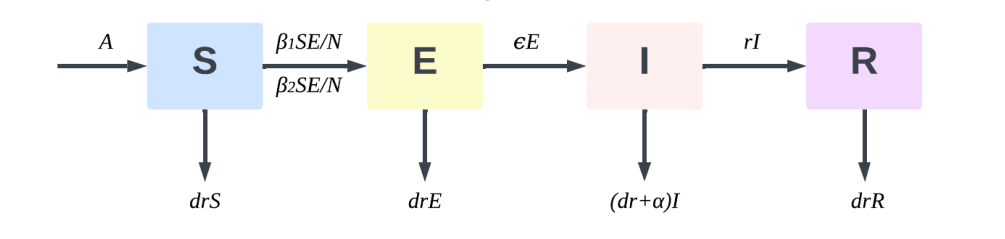
Figure 2: SEIR model infection mechanism diagram
According to Figure 2, the entire propagation mechanism can be described in three processes:
S→E: A susceptible individual (S) becomes an exposed individual (E) after being infected through contact with an infected individual (I) and an exposed individual (E). The rate of transition is given by \( \frac{{β_{2}}SI}{N}+\frac{{β_{1}}SE}{N} \) .
E→I: Exposed individuals (E) become infectious (I) after an average incubation period. This transition rate is denoted by ϵE, where ϵ is the rate at which exposed individuals progress to the infectious stage.
I→R: Infected individuals (I) transition to the removed (R) compartment, representing those who have either developed immunity through treatment or succumbed to the disease. The rate of transition is rI, where r represents the recovery or mortality rate among infected individuals, effectively removing them from the chain of transmission.
2.4. Equilibrium points and stability analysis of the improved SEIR model
Based on Equation 2-1 and the above discussions, let β1=β01C(N) and β2 =β02C(N), With the definitions, the differential equations for the improved SEIR model can be expressed as follows:
\( \begin{cases} \begin{array}{c} \frac{dS}{dt}=A-C(N)S({β_{1}}E+{β_{2}}I)/N-drS \\ \frac{dE}{dt}=C(N)({β_{1}}E+{β_{2}}E)/N-(ε+dr)E \\ \frac{dI}{dt}=εE-(dr+α+r)I \\ \frac{dR}{dt}=rI-drR \\ N=S+E+I+R \end{array} \end{cases} \) (5)
For the model, Condition 1: C(N) is a non-negative, non-decreasing continuous function for N>0. Additionally: C(0) is equal to 0 if N=0, C(N) ′ is larger than 0 if N≥0, meaning that C(N) does not decrease as the population N increases. Condition 2: \( \frac{C(N)}{N} \) is a non-negative, non-increasing, continuously differentiated function for N>0, meaning that the effective contact rate per individual decreases as N increases and \( (\frac{C(N)}{N}) \prime ≤0 \) . This condition reflects the decreasing likelihood of contact as population size grows, aligning with realistic disease transmission dynamics.
3. Parameter design and estimation for the improved seir model
In the improved SEIR model, the infection rate coefficient is designed under the following assumptions: 1) Initial Phase of the Epidemic: During the initial outbreak, government intervention requires a certain response time, so the effectiveness of control measures is assumed to be minimal in the early stages. After this response period, the impact of enforced governmental interventions is expected to significantly increase. 2) Early Stage of the Epidemic: At the outset, mandatory restrictions on the movement and gatherings of individuals are not immediately implemented, allowing susceptible individuals to easily come into contact with virus carriers through group activities and other means. 3) Post-Intervention Phase: After the implementation of governmental control measures, all public and private venues are assumed to be closed, and most susceptible individuals are prohibited from leaving their homes freely. Thus, the infection coefficients β1(for exposed individuals) and β2(for infected individuals) are assumed to be decreasing functions of time.
Based on these assumptions, the infection rate exhibits two distinct states before and after the implementation of government interventions: \( \begin{cases} \begin{array}{c} {β_{1}}(t)={β_{1}}(0) \\ {β_{2}}(t)={β_{2}}(0) \end{array} \end{cases} \) . Pre-Intervention Phase: During the initial outbreak phase, before effective government control measures are implemented, the infection rate coefficient is assumed to be constant:
\( \begin{cases} \begin{array}{c} {β_{1}}(t)={β_{1}}(0){e^{{k_{1}}(t-τ)}} \\ {β_{2}}(t)={β_{2}}(0){e^{-{k_{2}}(t-τ)}} \end{array} \end{cases} \) (6)
4. Empirical analysis of the COVID-19 pandemic
4.1. Assumptions of the improved SEIR model
Based on the transmission properties of COVID-19 and government intervention policies, we assume before using the enhanced SEIR model to actual COVID-19 data analysis:
Initial Conditions: Assuming no consideration of births or natural deaths, the initial state includes only one confirmed infection case. Therefore, I have \( {S_{0}}=N-1, {E_{0}}=0, {I_{0}}=0 \) and \( {R_{0}}=0 \) with the state space represented as ( \( {S_{0}} \) , \( {E_{0}} \) , \( {I_{0}} \) , \( {R_{0}} \) )=(N-1,0,1,0). The cumulative confirmed cases initially C0=1.
Incubation and Infection Periods: Since there is no definitive research on the average incubation and infection periods for COVID-19, this study utilizes initial parameter values from research on a similar virus (hemorrhagic fever virus). Specifically, individuals in the exposed category are assumed to become infectious after an average incubation period of 5.3 days, giving \( \frac{1}{ϵ}=5.3 \) .. Infected individuals are assumed to transition to the removed category after an average of 5.61 days, representing recovery or death, giving \( \frac{1}{r}=5.61 \) . Based on this, the initial conditions for parameter ranges are as follows:1 < \( \frac{1}{ϵ} \) < 28, 3.5 < \( \frac{1}{r} \) < 25, 0 < β1 < 1, 0 < β2 <1, 0 < K1 < 50, 0 < K2 < 50.
Distribution assumption: The cumulative number of confirmed cases follows a Poisson distribution and is not affected by changes in time or geographic location.
Infectiousness of Exposed and Removed Groups: Individuals in the latent period are assumed to be infectious, while those in the removed group are considered non-infectious. According to reports, COVID-19 recoverees are not reinfected within six months, implying the presence of antibodies. Thus, recovered individuals are assumed to be immune to reinfection.
Timing of Governmental Interventions: According to reports, the COVID-19 outbreak was publicly announced in China on December 31, 2019, with emergency measures (e.g., city lockdowns and restrictions on large gatherings) implemented on January 23. For the "Diamond Princess" outbreak, the first case was detected on January 25, 2020, and quarantine measures with testing began on the night of February 3. Therefore, τ1=23 and τ2= 9.
Based on these assumptions, the improved SEIR differential equation model is established as follows:
\( \begin{cases} \begin{array}{c} \frac{dS}{dt}=-S(t)({β_{2}}exp(-{k_{2}}t)I(t)+{β_{1}}exp(-{k_{1}}t)E(t))/N \\ \frac{dE}{dt}=S(t)({β_{2}}exp(-{k_{2}}t)I(t)+{β_{1}}exp(-{k_{1}}t)E(t))/N-εE(t) \\ \frac{dI}{dt}=εE(t)-rI(t) \\ \frac{dR}{dt}=rI(t) \\ \frac{dC}{dt}=εE(t) \\ N=S+E+I+R+C \end{array} \end{cases} \) (7)
Whereas C(t) shows the total number of confirmed cases as of time t, S(t), E(t), I(t), and R(t) correspondingly in the model reflect the number of susceptible population, exposed population, infected population, and removed population at time t. Thus, (S0 ,E0, I0, R0) = (N−1,0,1,0) and the initial parameter values \( \frac{1}{ϵ}=5.3 \) and \( \frac{1}{r}=5.61 \) , Based on formula (6), the maximum likelihood estimation (MLE) of cumulative confirmed cases was carried out, and the optimal parameter values were obtained by Nelder-Mead optimization algorithm. Combined with formula 4-1, the cumulative number of confirmed cases of novel coronavirus pneumonia was simulated. Finally, the simulated cumulative number of cases was compared with the actual cumulative confirmed case sample data to evaluate the model fit.
4.2. Overall epidemic analysis
In this section, example data were obtained using Python’s requests library. Real-time tracking data for COVID-19 is available from several public websites, including Tencent’s and Baidu’s COVID-19 tracking platforms. For this analysis, data were scraped from Tencent’s real-time COVID-19 tracker. The dataset comprises three main features: date, cumulative confirmed cases, and cumulative deaths. The data spans 67 days, from January 23, 2020, to March 29, 2020 (see Appendix for detailed data). Based on the overall data collected for COVID-19, I plotted the trend in cumulative confirmed cases and cumulative deaths. This trend visualization is presented in Figure 3.
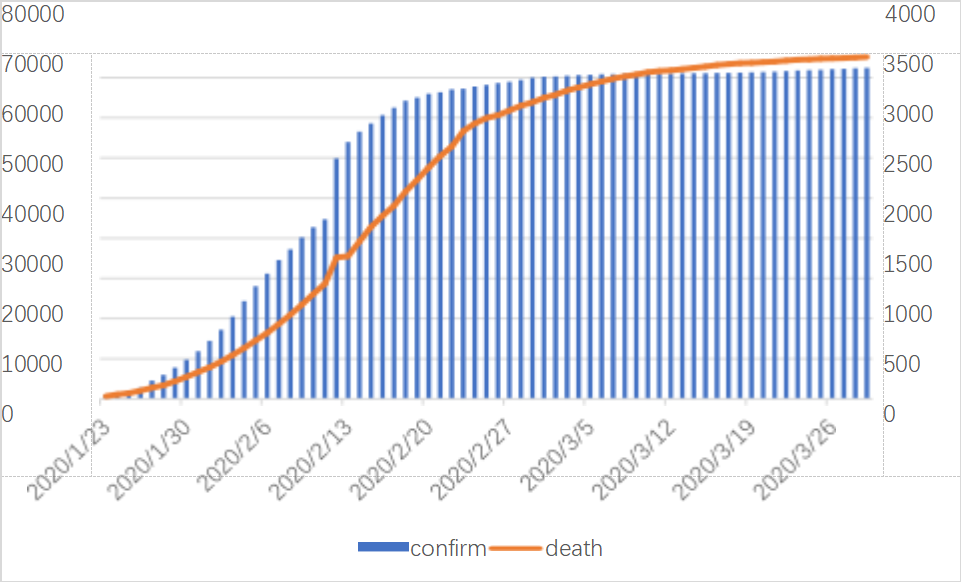
Figure 3: Cumulative number of infections and deaths from the novel coronavirus pneumonia epidemic in China in the first quarter of 2020
As shown in Figure 3, since January 23, 2020, China has adopted a series of control measures to respond to the COVID-19 epidemic, including imposing a lockdown on Wuhan and restricting gathering activities nationwide. As shown in Figure 3 and associated statistics, there were 835 confirmed cases overall as of January 23, 2020. The number of confirmed cases swiftly surpassed 10,000 within a week, and the total number of verified cases has continued to grow dramatically ever since. But the total number of fatalities hasn't gone up much at the same time. The low number of deaths in the early stages of the epidemic may be because it is still in its early stages of transmission and the government's preventative and control measures will not be fully successful for some time. On February 13, 2020, a notable surge in confirmed cases occurred, with the cumulative confirmed count increasing from over 40,000 to more than 60,000—a rise of over 10,000 cases. This sharp increase could be attributed to the influx of healthcare workers to Wuhan from across the country, enabling a higher volume of testing and thus a higher confirmed case count. Fortunately, the cumulative death count did not show a comparable spike, indicating a relatively low fatality rate for this disease and suggesting that medical interventions were proving effective.
Further, from February 29, 2020, onward, the growth rate of cumulative confirmed cases began to level off, signaling effective containment of the outbreak under strict national control measures. Similarly, the growth rate of cumulative deaths started to stabilize from March 7, 2020.The total number of confirmed cases worldwide as on March 29, 2020, has surpassed 80,000; the total death toll has also surpassed 3,000. With abundant medical resources, the overall mortality rate is around 4%, highlighting the effectiveness of timely intervention and medical measures during the epidemic.
4.3. Analysis of the COVID-19 outbreak on the diamond princess
Among the best 15 luxury cruise ships worldwide is the Diamond Princess. On January 20, the cruise ship set sail from Yokohama, Japan, passing through Kagoshima (Japan), Hong Kong (China), Vietnam, Taiwan (China) and Naha (Japan), and was scheduled to return to Yokohama on the evening of February 4. However, an 80-year-old male passenger disembarked in Hong Kong on January 25 and was subsequently diagnosed with COVID-19. Affected by this, on the evening of February 3, the Diamond Princess terminated its journey ahead of schedule, returned urgently, and anchored near Yokohama for at least 14 days for quarantine. Japanese health officials boarded the ship the night it arrived and began screening passengers and crew. The Diamond Princess was carrying 3,711 people, including 1,045 crew members and 2,666 passengers from 56 different countries and regions. The composition of passengers and crew on board is illustrated in Figure 4.
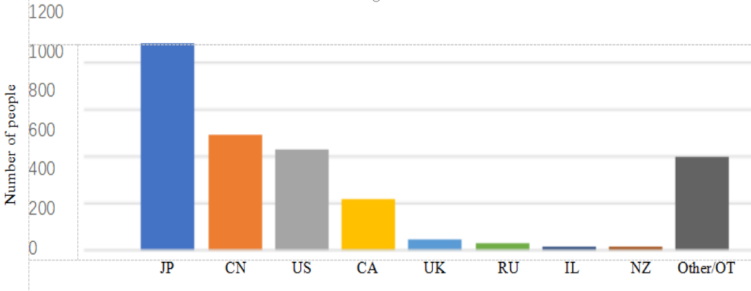
Figure 4: Composition of major nationalities on board the Diamond Princess
4.4. Comparative analysis of different models
Using the improved SEIR model established in this study, I analyzed the control coefficients, reproduction numbers, and fit accuracy for both the national COVID-19 epidemic and the Diamond Princess outbreak. To further assess the model’s applicability in representing COVID-19 data—particularly the effect of adding a latent compartment with infectious individuals during the incubation period—I compare the improved SEIR model with the traditional SIR and SEIR models.
Table 1: Comparison of national SIR, SEIR, and improved SEIR model
MODEL | RMSE |
SIR | 379.4670 |
SEIR | 351.3016 |
Improved SEIR | 298.3101 |
Table 2: Comparison of SIR, SEIR, and improved SEIR models for the Diamond Princes
MODEL | RMSE |
SIR | 379.4670 |
SEIR | 351.3016 |
Improved SEIR | 298.3101 |
Table 1 and Table 2 show from the appropriate fitting of the national epidemic data and the Diamond Princess epidemic data that the root mean square error (RMSE) of the SEIR model and the modified SEIR model is lower than that of the SIR Model, so indicating that the model with the incubation chamber is closer to the actual outbreak dynamics. Furthermore, the root-mean-square error of the improved SEIR model was compared with the root-mean-square error of the SEIR model; it was discovered that the improved SEIR model's root-mean-square error was smaller, suggesting that adding latent infectivity to the SEIR model would help to more precisely fit the COVID-19 data under the same compartment structure. This is in line with the finding that COVID-19 incubation period people have capacity for transmission.
5. Conclusion
This work established an infectious disease dynamic model in which both infected and latent cases have the transmission ability, investigated the disease-free equilibrium point and its stability, and obtained the expression of the fundamental regeneration number R0 of the model from the point of view of improving the SEIR model. One can deduce the following from analyzing the changing trend of the model under several R0 values: The disease will progressively vanish even without outside control when R0≤1; if no control measures are applied, the condition will continue and might become endemic when R0>1. These results indicate that the size of R0 determines whether the sickness disappears totally; so, the smaller the regeneration number, the more suited the elimination of the disease is. The expression of R0 indicates that the infection rate coefficient determines its size. The lower the infection rate is (that is, the smaller the values of β1 and β2 in the model), the smaller the threshold value is, which is conducive to the elimination of the disease. For the other aspect, the disease is more difficult to manage and eradicate the more quickly infection rates are rising. Therefore, good control measures usually entail lowering the infectivity of persons carrying the virus, which is necessary to stop the dissemination of the disease. Empirical data strengthens this conclusion even more. When fitting the COVID-19 epidemic in China and the Diamond Princess outbreak, It is observed that the modified SEIR model generated reduced root-mean-square error (RMSE) values when compared with the SIR and SEIR models. This implies that the modified SEIR model, which supposes latent people to be infectious, is more suited to depict the real features of the epidemic.
Empirical study of the national epidemic and the Diamond Princess epidemic reveals, from the standpoint of transmission coefficient, variations in transmission rate between infected and latent cases. Latent case transmission is always higher than confirmed infection rate, hence it is noteworthy. The reduced transmission rate could be the result of the rigorous isolation of confirmed patients and fewer contact with vulnerable persons. Higher transmission rates follow from latent cases, which lack symptoms and are more difficult to find and isolate.
In general, the created enhanced SEIR model in this work demonstrated good performance in fitting the 2019 COVID-19 epidemic; moreover, the parameter estimates generated by fitting real data have great explanatory relevance. Rapid COVID-19 spread and its several modes of transmission have resulted in major epidemics in several nations. The improved SEIR model based on the transmission characteristics of COVID-19 is not only suitable for analyzing the epidemic across China and the special case of the Diamond Princess, but also provides valuable management suggestions for other countries and regions affected by the epidemic, and provides reference and inspiration for the study of infectious diseases with similar transmission mechanisms.
References
[1]. Ren, S., He, K., Girshick, R., & Sun, J. (2015). Faster R-CNN: Towards real-time object detection with region proposal networks. Advances in neural information processing systems, 28.
[2]. Tan, W., Zhao, X., Ma, X., Wang, W., Niu, P., Xu, W., et al. (2020). A novel coronavirus genome identified in a cluster of pneumonia cases—Wuhan, China 2019–2020. China CDC Weekly, 2(4), 61-62.
[3]. Merbs, C. F. (1992). A new world of infectious disease. American Journal of Physical Anthropology, 35(S15), 3-42.
[4]. World Health Organization. (2020a). WHO | Novel Coronavirus–China. WHO. Retrieved January 12, 2020.
[5]. World Health Organization. (2020b, January 21). [Twitter post].
[6]. Zhang, F., Li, L., & Xuan, H. Y. (2011). A review of infectious disease transmission models. Systems Engineering Theory and Practice, 31(9), 1736-1744.
[7]. Cohen, J. E. (1992). Infectious diseases of humans: Dynamics and control. Epidemiology & Infection, 268(23), 3381.
[8]. Anderson, R. M. (2013). The population dynamics of infectious diseases: Theory and applications. Springer.
[9]. Kermack, W. O., & McKendrick, A. G. (1927). A contribution to the mathematical theory of epidemics. Proceedings of the Royal Society A: Mathematical, Physical and Engineering Sciences, 115(772), 700-721.
[10]. Kermack, W. O., & McKendrick, A. G. (1933). Contributions to the mathematical theory of epidemics. III.—Further studies of the problem of endemicity. Proceedings of the Royal Society A: Mathematical, Physical and Engineering Sciences, 141(843), 94-122.
[11]. Aron, J., & Schwartz, I. (1984). Seasonality and period doubling bifurcations in an epidemic model. Journal of Theoretical Biology, 110(4), 665-679.
[12]. Watts, D. J., Muhamad, R., Medina, D. C., & Dodds, P. S. (2005). Multiscale, resurgent epidemics in a hierarchical metapopulation model. Proceedings of the National Academy of Sciences, 102(32), 11157-11162.
[13]. Nuño, M., Chowell, G., & Gumel, A. B. (2007). Assessing the role of basic control measures, antivirals, and vaccines in curtailing pandemic influenza: Scenarios for the US, UK, and the Netherlands. Journal of the Royal Society Interface, 4(14), 505-521.
[14]. Cai, Q. C., Jiang, Q. W., Xu, Q. F., Cheng, X., Guo, Q., Sun, Q. W., & Zhao, G. M. (2005). A quantitative evaluation of SARS intervention measures using a transmission dynamics model. Chinese Journal of Epidemiology, (03), 5-10.
[15]. Biotechnology Bulletin. (2017). Adenovirus vector vaccine expressing glycoprotein of Ebola virus Makona strain is effective in guinea pigs and non-human primates. Biotechnology Bulletin, 28(1), 64-64.
[16]. Ma, X., & Zhou, Y. C. (2016). Application of a discrete SCIRS model with age stages to meningitis in China. Journal of Engineering Mathematics, (06), 597-612.
Cite this article
Gao,F. (2025). The Study of COVID-19 Virus Infection Based on the SEIR Model. Theoretical and Natural Science,68,46-56.
Data availability
The datasets used and/or analyzed during the current study will be available from the authors upon reasonable request.
Disclaimer/Publisher's Note
The statements, opinions and data contained in all publications are solely those of the individual author(s) and contributor(s) and not of EWA Publishing and/or the editor(s). EWA Publishing and/or the editor(s) disclaim responsibility for any injury to people or property resulting from any ideas, methods, instructions or products referred to in the content.
About volume
Volume title: Proceedings of the 3rd International Conference on Modern Medicine and Global Health
© 2024 by the author(s). Licensee EWA Publishing, Oxford, UK. This article is an open access article distributed under the terms and
conditions of the Creative Commons Attribution (CC BY) license. Authors who
publish this series agree to the following terms:
1. Authors retain copyright and grant the series right of first publication with the work simultaneously licensed under a Creative Commons
Attribution License that allows others to share the work with an acknowledgment of the work's authorship and initial publication in this
series.
2. Authors are able to enter into separate, additional contractual arrangements for the non-exclusive distribution of the series's published
version of the work (e.g., post it to an institutional repository or publish it in a book), with an acknowledgment of its initial
publication in this series.
3. Authors are permitted and encouraged to post their work online (e.g., in institutional repositories or on their website) prior to and
during the submission process, as it can lead to productive exchanges, as well as earlier and greater citation of published work (See
Open access policy for details).
References
[1]. Ren, S., He, K., Girshick, R., & Sun, J. (2015). Faster R-CNN: Towards real-time object detection with region proposal networks. Advances in neural information processing systems, 28.
[2]. Tan, W., Zhao, X., Ma, X., Wang, W., Niu, P., Xu, W., et al. (2020). A novel coronavirus genome identified in a cluster of pneumonia cases—Wuhan, China 2019–2020. China CDC Weekly, 2(4), 61-62.
[3]. Merbs, C. F. (1992). A new world of infectious disease. American Journal of Physical Anthropology, 35(S15), 3-42.
[4]. World Health Organization. (2020a). WHO | Novel Coronavirus–China. WHO. Retrieved January 12, 2020.
[5]. World Health Organization. (2020b, January 21). [Twitter post].
[6]. Zhang, F., Li, L., & Xuan, H. Y. (2011). A review of infectious disease transmission models. Systems Engineering Theory and Practice, 31(9), 1736-1744.
[7]. Cohen, J. E. (1992). Infectious diseases of humans: Dynamics and control. Epidemiology & Infection, 268(23), 3381.
[8]. Anderson, R. M. (2013). The population dynamics of infectious diseases: Theory and applications. Springer.
[9]. Kermack, W. O., & McKendrick, A. G. (1927). A contribution to the mathematical theory of epidemics. Proceedings of the Royal Society A: Mathematical, Physical and Engineering Sciences, 115(772), 700-721.
[10]. Kermack, W. O., & McKendrick, A. G. (1933). Contributions to the mathematical theory of epidemics. III.—Further studies of the problem of endemicity. Proceedings of the Royal Society A: Mathematical, Physical and Engineering Sciences, 141(843), 94-122.
[11]. Aron, J., & Schwartz, I. (1984). Seasonality and period doubling bifurcations in an epidemic model. Journal of Theoretical Biology, 110(4), 665-679.
[12]. Watts, D. J., Muhamad, R., Medina, D. C., & Dodds, P. S. (2005). Multiscale, resurgent epidemics in a hierarchical metapopulation model. Proceedings of the National Academy of Sciences, 102(32), 11157-11162.
[13]. Nuño, M., Chowell, G., & Gumel, A. B. (2007). Assessing the role of basic control measures, antivirals, and vaccines in curtailing pandemic influenza: Scenarios for the US, UK, and the Netherlands. Journal of the Royal Society Interface, 4(14), 505-521.
[14]. Cai, Q. C., Jiang, Q. W., Xu, Q. F., Cheng, X., Guo, Q., Sun, Q. W., & Zhao, G. M. (2005). A quantitative evaluation of SARS intervention measures using a transmission dynamics model. Chinese Journal of Epidemiology, (03), 5-10.
[15]. Biotechnology Bulletin. (2017). Adenovirus vector vaccine expressing glycoprotein of Ebola virus Makona strain is effective in guinea pigs and non-human primates. Biotechnology Bulletin, 28(1), 64-64.
[16]. Ma, X., & Zhou, Y. C. (2016). Application of a discrete SCIRS model with age stages to meningitis in China. Journal of Engineering Mathematics, (06), 597-612.